


Performance Summary
- Profit of $20.83 billion for Q4, marking a 49% increase from $14.02 billion in the same period last year.
- This translated to earnings of $8.02 per share, up from $5.33 per share a year ago. Revenue for the quarter grew by 21%, reaching $48.39 billion, compared to $40.11 billion in Q4
- For the entire 2024, revenue reached $164.5 billion, a 22% increase compared to 2023. Higher ad impressions and an increase in the average price per ad drove this growth.
Meta’s Family of Apps, including Facebook, Instagram, and WhatsApp, saw strong user engagement. Daily active users reached 3.35 billion in December, marking a 5% year-over-year growth.

Rising Costs and AI Investment
While revenue soared, expenses also increased. Costs and expenses for the full year rose by 8% to $95.12 billion. In Q4 alone, Meta reported $25.02 billion in costs, including a $1.55 billion reduction in legal losses, which offset some expenses. Capital expenditures for the year totaled $39.23 billion.
CEO Mark Zuckerberg expressed himself on Meta’s solid performance. He said,
“I expect 2025 to be the year when a highly intelligent and personalized AI assistant reaches more than 1 billion people, and I expect Meta AI to lead the way.”
Meta’s strong Q4 results reflect its ability to leverage advertising growth and user engagement while navigating rising costs. However, with significant investments in AI on the horizon, 2025 will be a key year for the company’s long-term vision.
Microsoft’s Robust Results Driven by AI and Cloud Growth
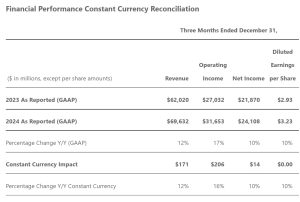
Microsoft also posted its financial results for the quarter ending December 31, 2024, fueled by strong performance in its AI and cloud segments. The performance snapshot is explained below:
- Revenue reached $69.6 billion, a 12% increase compared to the same period in 2023.
- Operating income grew 17% to $31.7 billion. Net income rose 10% to $24.1 billion, with earnings per share at $3.23.
Satya Nadella, chairman and CEO of Microsoft noted,
“We are innovating across our tech stack and helping customers unlock the full ROI of AI to capture the massive opportunity ahead. Already, our AI business has surpassed an annual revenue run rate of $13 billion, up 175% year-over-year.”
Key Business Highlights
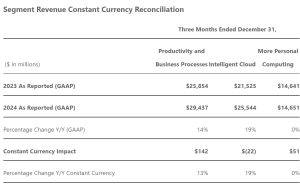
- The Productivity and Business Processes segment reported $29.4 billion in revenue, a 14% increase driven by strong demand for Microsoft 365 and Dynamics 365.
- Intelligent Cloud revenue grew 19% to $25.5 billion, with Azure and other cloud services leading the growth with a 31% increase.
- The More Personal Computing segment remained flat at $14.7 billion, although search and advertising revenue grew by 21%, and Windows OEM revenue increased by 4%.
Cloud and AI Lead the Way
Amy Hood, executive vice president and chief financial officer of Microsoft said,
“This quarter Microsoft Cloud revenue was $40.9 billion, up 21% year-over-year. We remain committed to balancing operational discipline with continued investments in our cloud and AI infrastructure.”
Looking ahead, Microsoft expects Azure growth of 31-32% for the third fiscal quarter. At the same time, Hood also highlighted challenges with capacity constraints but remains optimistic about future growth opportunities.
Meta Vs Microsoft: Comparative Analysis of Emission Reduction and Net Zero Goals
Both Microsoft and Meta are committed to reducing their greenhouse gas (GHG) emissions, with ambitious goals aimed at achieving net-zero across their global operations and value chains. However, their emissions profiles and strategies show some key differences.
Meta’s Commitment to Net Zero Emissions
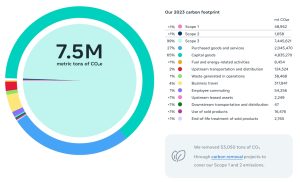
As per its latest sustainability report, in 2023, Meta’s net emissions equaled 7.4 million metric tons of CO2. Key commitments include:
- Reducing Scope 1 and 2 emissions by 42% by 2031, compared to a 2021 baseline, and ensuring maximum suppliers adopt science-aligned GHG reduction targets by 2026.
- Keep Scope 3 emissions at or below 2021 levels by 2031.
- Since 2020, Meta has successfully maintained net zero emissions in its operations, and it is on track to achieve net zero across its entire value chain by 2030.
To address residual emissions, Meta is investing in both nature-based and technological carbon removal projects, which help mitigate climate change and provide broader environmental benefits, including enhanced biodiversity.
Scaling Renewable Energy
Renewable energy has played a pivotal role in Meta’s emissions reduction strategy.
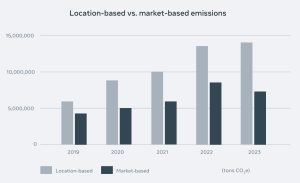
- In 2023 alone, the company’s renewable energy initiatives helped cut operational emissions by 5.1 million tons of CO2e, while value chain emissions were reduced by 1.4 million tons of CO2e.
Through strategic partnerships with utilities such as Pacific Power and Dominion Energy, Meta has facilitated the addition of 2,600 MW of new wind and solar capacity in the U.S., making clean energy more accessible.
- As of 2023, Meta’s global renewable energy portfolio exceeded 11,700 MW, with over 6,700 MW of that capacity online in the U.S.
Data Center Efficiency and Carbon Removal Solutions
Meta’s data center facilities have achieved LEED Gold Certification or higher and are powered by 100% renewable energy to meet their electricity needs.
In addition, 91% of the construction waste generated by Meta’s data centers was recycled in 2023. Additionally, it reduces embedded carbon by extending hardware lifespan and using recycled plastics and metals, promoting a circular model to cut waste and carbon impact.
Meta also uses “green tariffs”, which allow the company to purchase renewable energy directly from electricity providers. This not only supports clean energy projects but also increases the accessibility of renewable resources to a wider customer base.
In 2023, Microsoft made significant strides in its commitment to sustainability, expanding its contracted renewable energy portfolio to over 19.8 GW across 21 countries.
Scope Emissions
- Scope 3 emissions which account for over 96% of Microsoft’s total emissions rose by 30.9% in 2023.
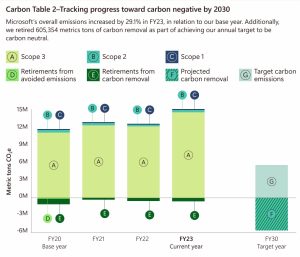
- Overall greenhouse gas (GHG) emissions were 15.4 MtCO₂e in 2023, a 29.1% rise as compared to the 2020 baseline.
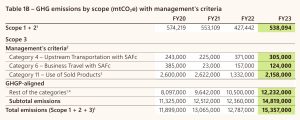
This increase was largely driven by upstream purchased goods and services and downstream use of sold products. However, as per Microsoft, it has achieved a 6% reduction in Scope 1 and 2 emissions compared to its 2020 baseline by adopting renewable energy and energy efficiency initiatives.
Data Centers Efficiency and Fleet Electrification
In its data centers, Microsoft has focused on maximizing energy efficiency. In 2023, its data centers achieved a Power Usage Effectiveness (PUE) score of 1.12, demonstrating the company’s commitment to minimizing energy use while optimizing operations.
Additionally, the company reduced its Azure hardware needs by 1.5%, minimizing embodied carbon in the process. It is also transitioning to a 100% electric fleet by 2030, with infrastructure development already underway at its Redmond headquarters.
Overall, both companies are taking significant steps toward reducing their carbon footprint. Meta is focused on keeping Scope 3 emissions steady while scaling renewable energy adoption, whereas Microsoft faces a rise in Scope 3 emissions which is a matter of concern.
Additionally, Microsoft’s total GHG emissions are significantly higher than Meta’s. Yet it’s continuing to prioritize its energy efficiency in its operations and decarbonize its supply chain to achieve its net zero goals.
The post Meta Vs. Microsoft: Who’s Leading the Q4 Revenue Game and Net Zero Goals? appeared first on Carbon Credits.

EU carbon credit claims changed on 27 September 2026, the day the Directive (EU) 2024/825 began to apply across the European Union. The change is narrow. It changes how a company can talk about the credits it buys. A product can no longer be called neutral on the strength of compensation alone; however, every specific, evidenced statement about what a company measured, reduced, and funded stays fully available.

The post Promoting Improved Cooking Practices in Nigeria appeared first on Terrapass.



-
Climate Change1 year ago
Guest post: Why China is still building new coal – and when it might stop
-

 Greenhouse Gases2 years ago
嘉宾来稿:满足中国增长的用电需求 光伏加储能“比新建煤电更实惠”
-
Greenhouse Gases1 year ago
Guest post: Why China is still building new coal – and when it might stop
-

 Climate Change2 years ago
嘉宾来稿:满足中国增长的用电需求 光伏加储能“比新建煤电更实惠”
-

 Renewable Energy12 months ago
Sending Progressive Philanthropist George Soros to Prison?
-
Climate Change2 years ago
Bill Discounting Climate Change in Florida’s Energy Policy Awaits DeSantis’ Approval
-
Greenhouse Gases1 year ago
嘉宾来稿:探究火山喷发如何影响气候预测
-

 Climate Change2 years ago
Analysis: China’s CO2 falls 1% in Q2 2024 in first quarterly drop since Covid-19