

Global electricity demand is entering a decisive growth phase. IEA’s 2026 electricity report forecasts that over the next five years, power consumption is set to rise faster than at any time in recent decades, marking a structural shift in how the world uses energy. This trend reflects the rapid electrification of industries, transport, buildings, and digital infrastructure, alongside climate-driven demand for cooling and heating.
Unlike previous cycles, electricity demand is no longer simply following economic growth. Instead, power consumption is becoming a leading driver of economic activity. This shift signals the arrival of what analysts increasingly call the “Age of Electricity,” where power is the backbone of modern economies and decarbonization strategies.
Let’s deep dive into IEA’s report here to understand the present and the future of electricity demand.
Electricity Demand Breaks Away from Economic Growth
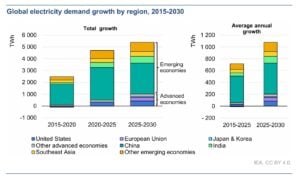
Global electricity demand is projected to grow at an average annual rate of around 3.6% between 2026 and 2030, significantly faster than the growth seen over the past decade. In contrast, total energy demand will rise much more slowly, meaning electricity will expand at least 2.5 times faster than overall energy consumption.
This divergence marks a fundamental change. Historically, electricity consumption closely tracked GDP growth. That relationship is now reversing. In 2024, electricity demand outpaced economic growth globally for the first time in three decades outside of crisis periods, and this trend is expected to continue.
Several structural drivers are accelerating this shift:
- Electrification of transport, especially electric vehicles
- Expansion of data centres and artificial intelligence workloads
- Rising demand for air conditioning due to climate change
- Industrial electrification and reshoring
- Growth in heat pumps and electric heating
Together, these trends are pushing electricity to become the dominant form of final energy consumption.
Emerging economies will remain the main engine of demand growth, accounting for roughly 80% of new electricity consumption through 2030. However, advanced economies are also seeing a resurgence after more than a decade of stagnation, driven by digitalization and electrification.
Global Power Mix: Renewables and Nuclear Take Half the Market
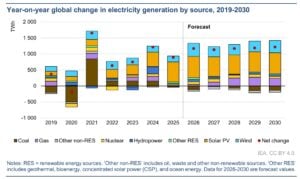
Globally, renewables and nuclear are on track to supply around 50% of electricity generation by 2030. Solar is the fastest-growing source, contributing more than half of annual generation additions.
Renewable generation is expected to grow by about 1,000 TWh per year through 2030, with solar alone adding more than 600 TWh annually. Nuclear power is also gaining momentum, supported by reactor restarts, lifetime extensions, and new builds in emerging economies.
However, coal will likely remain the single largest source of electricity in 2030, even as its share declines. Natural gas generation is also expected to rise, driven by US demand and fuel switching in the Middle East.
Overall, renewables, nuclear, and gas are projected to meet all net new electricity demand globally, displacing coal in aggregate but not eliminating it.
Advanced Economies Re-Enter the Demand Growth Cycle
Electricity demand in advanced economies is rising again after a prolonged period of stagnation. In the United States, demand is projected to grow by around 2% annually through 2030, with data centres accounting for roughly half of the increase.
In the European Union, electricity demand is expected to grow at around 2% per year, though consumption may not return to pre-2021 levels until the late 2020s. Other advanced economies, including Japan, Canada, Korea, and Australia, are also seeing accelerating growth.
This resurgence reflects:
- AI and cloud computing expansion
- Electrification of heating and transport
- Industrial reshoring and new manufacturing facilities
- Climate-driven cooling demand
Electricity is becoming a core input for economic competitiveness in digital and industrial sectors.
Power Sector Emissions: Plateau but Not Yet Declining Fast Enough
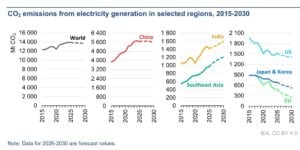
Electricity generation remains the largest source of energy-related carbon dioxide emissions, producing roughly 13.9 billion tonnes of CO₂ per year. After rising between 2022 and 2024, power sector emissions stabilised in 2025.
Looking ahead, emissions are expected to plateau through 2030, rather than decline sharply. This reflects the rapid growth in electricity demand, offsetting gains from clean power deployment.
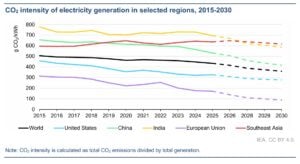
The carbon intensity of electricity has already fallen by around 14% over the past decade, and it is expected to decline faster as low-emission generation expands. This decline is mainly due to more renewable energy and strong nuclear power output.
- The trend is expected to accelerate. CO₂ intensity is forecast to fall by around 3.7% per year, dropping from 435 g CO₂ per kWh in 2025 to about 360 g CO₂ per kWh by 2030.
However, absolute emissions reductions will be harder to achieve due to rising demand. China’s trajectory is particularly critical. As the world’s largest power market and emitter, its pace of renewable deployment, coal retirement, and grid reform will heavily influence global climate outcomes.
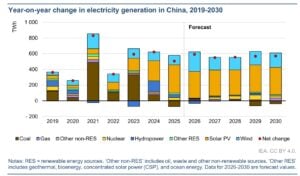
China: The Single Largest Driver of Global Electricity Growth
China will remain the central force shaping global electricity demand over the next decade. Despite slower economic growth and structural shifts toward services, China’s sheer scale means it will contribute close to half of global electricity demand growth through 2030.
Electricity demand in China rose by just over 5% in 2025, down from roughly 7% in 2024. Looking ahead, demand is expected to grow at an average of around 4.9% annually between 2026 and 2030, slower than the past decade but still massive in absolute terms.
The drivers are multifaceted:
- Continued electrification across industry and households
- Expansion of manufacturing, including clean energy supply chains
- Growing services sector electricity use
- Rising cooling demand due to extreme heat events
- Digital infrastructure and smart technologies
China’s power demand growth over the next five years alone is expected to match the current total electricity consumption of the European Union. This highlights the scale of China’s influence on global power markets, fuel demand, and emissions trajectories.
At the same time, efficiency improvements are tempering demand growth. Government policies targeting lower energy intensity and more efficient appliances are helping reduce electricity use per unit of GDP. However, these gains are not enough to offset the scale of electrification and economic activity.
MUST READ:
- China Adds Power 8x More Than the US in 2025, with $500B Energy Build-Out in a Single Year
- How China’s $180B Clean-Tech Investments Transform the Global South
Renewables Surge, But Grid Constraints Loom Large
China’s renewable energy buildout continues at an unprecedented pace. Solar generation jumped by more than 40% in 2025, while wind grew by double digits. The share of variable renewable energy (VRE) in China’s power mix reached around 22%, up sharply from the previous year.
Record capacity additions are transforming the power system. More than 300 GW of solar and over 100 GW of wind were added in a single year, driven partly by developers rushing to complete projects before the end of fixed-price tariffs.
However, this rapid expansion is creating new challenges. Curtailment rates for solar and wind increased, reflecting grid congestion and integration constraints. This highlights a global issue: generation is growing faster than grid infrastructure.
Coal’s Role Is Changing, Not Disappearing
Despite the renewable boom, coal remains a dominant force in China’s power sector. Coal-fired generation declined slightly in 2025, but coal still accounts for the largest share of electricity generation.
China’s coal share is expected to fall from around 55% in 2025 to about 43% by 2030, reflecting the rapid expansion of renewables and nuclear. However, coal capacity continues to grow, driven by projects approved during the 2022–2023 permitting boom.
Rather than serving as baseload power, coal plants are increasingly being used as flexibility and backup resources to support variable renewables. Capacity utilisation is expected to decline, even as installed capacity rises.
This shift illustrates a broader global trend: coal is becoming a reliability asset rather than a growth engine, but its persistence complicates decarbonization efforts.
Grids and Flexibility: The Hidden Bottleneck
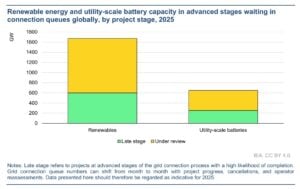
The transition to an electricity-centric energy system depends on grid expansion and flexibility. Investment in grids currently lags far behind generation capacity additions. Worldwide, more than 2,500 GW of projects are stuck in grid connection queues, including renewables, storage, and large industrial loads such as data centres. Without faster grid expansion and smarter system management, power shortages and curtailment risks will rise.
Meeting projected demand will require around 50% higher annual grid investment by 2030, rising from roughly USD 400 billion today. Without this, congestion, curtailment, and reliability risks will increase.
Flexibility solutions are also scaling rapidly. Utility-scale battery deployment is accelerating, especially in regions with high solar and wind penetration. However, conventional power plants still provide most flexibility today.
Policy reforms, grid-enhancing technologies, and non-firm connection agreements could unlock 1,200–1,600 GW of stalled projects, significantly accelerating the transition.
The Global Outlook: A Power-Centric Energy System
The global energy system is undergoing a structural transformation. Electricity is becoming the dominant vector for economic growth, digitalization, and decarbonization. Demand growth is accelerating across emerging and advanced economies, with China playing the most decisive role.
Renewables and nuclear are rapidly expanding, but coal and gas will remain part of the mix for reliability. Emissions are stabilising but not falling fast enough to meet climate targets, highlighting the scale of the challenge ahead.
The next five years will be critical. Grid expansion, flexibility solutions, and policy reforms will determine whether the Age of Electricity delivers a clean, affordable, and resilient energy future—or locks in new infrastructure bottlenecks and emissions risks.
- ALSO READ: 2026: The Year Nuclear Power Reclaims Relevance With 15 Reactors, AI Demand, and China’s Expansion
The post How Power Demand, Emissions, and China Will Shape the Global Energy System to 2030 appeared first on Carbon Credits.
Every business carbon footprint report ends with a number, the amount of carbon emissions produced by the business, less the amount of carbon reduced and offset, given in tonnes of CO₂. Many of the people who sign off on that number, including those who paid for it, cannot picture what it represents on the ground. A tonne is a unit of mass. CO₂ is invisible. The link between the amount offset in the report and a real piece of restored forest somewhere in the world is almost never indicated.
![]()
Americans are paying more for insurance, electricity, taxes, and home repairs every year. What many people may not realize is that climate change is already one of the drivers behind those rising costs.
For many households, climate change is no longer just an environmental issue. It is becoming a cost-of-living issue. While climate impacts like melting glaciers and shrinking polar ice can feel distant from everyday life, the financial effects are already showing up in monthly budgets across the country.
Today, a larger share of household income is consumed by fixed costs such as housing, insurance, utilities, and healthcare. (3) Climate change and climate inaction are adding pressure to many of those expenses through higher disaster recovery costs, rising energy demand, infrastructure repairs, and increased insurance risk.
The goal of this article is to help connect climate change to the everyday financial realities people already experience. Regardless of where someone stands on climate policy, it is important to recognize that climate change is already increasing costs for households, businesses, and taxpayers across the United States.
More conservative estimates indicate that the average household has experienced an increase of about $400 per year from observed climate change, while less conservative estimates suggest an increase of $900.(1) Those in more disaster-prone regions of the country face disproportionate costs, with some households experiencing climate-related costs averaging $1,300 per year.(1) Another study found that climate adaptation costs driven by climate change have already consumed over 3% of personal income in the U.S. since 2015.(9) By the end of the century, housing units could spend an additional $5,600 on adaptation costs.(1)
Whether we realize it or not, Americans are already paying for climate change through higher insurance premiums, energy costs, taxes, and infrastructure repairs. These growing expenses are often referred to as climate adaptation costs.
Without meaningful climate action, these costs are expected to continue rising. Choosing not to invest in climate action is also choosing to spend more on climate adaptation.
Here are a few ways climate change is already increasing the cost of living:
- Higher insurance costs from more frequent and severe storms
- Higher energy use during longer and hotter summers
- Higher electricity rates tied to storm recovery and grid upgrades
- Higher government spending and taxpayer-funded disaster recovery costs
The real debate is not whether climate change costs money. Americans are already paying for it. The question is where we want those costs to go. Should we invest more in climate action to help reduce future climate adaptation costs, or continue paying growing recovery and adaptation expenses in everyday life?
How Climate Change Is Increasing Insurance Costs
There is one industry that closely tracks the financial impact of natural disasters: insurance. Insurance companies are focused on assessing risk, estimating damages, and collecting enough revenue to cover losses and remain financially stable.
Comparing the 20-year periods 1980–1999 and 2000–2019, climate-related disasters increased 83% globally from 3,656 events to 6,681 events. The average time between billion-dollar disasters dropped from 82 days during the 1980s to 16 days during the last 10 years, and in 2025 the average time between disasters fell to just 10 days. (6)
According to the reinsurance firm Munich Re, total economic losses from natural disasters in 2024 exceeded $320 billion globally, nearly 40% higher than the decade-long annual average. Average annual inflation-adjusted costs more than quadrupled from $22.6 billion per year in the 1980s to $102 billion per year in the 2010s. Costs increased further to an average of $153.2 billion annually during 2020–2024, representing another 50% increase over the 2010s. (6)
In the United States, billion-dollar weather and climate disasters have also increased significantly. The average number of billion-dollar disasters per year has grown from roughly three annually during the 1980s to 19 annually over the last decade. In 2023 and 2024, the U.S. recorded 28 and 27 billion-dollar disasters respectively, both setting new records. (6)
The growing impact of climate change is one reason insurance costs continue to rise. “There are two things that drive insurance loss costs, which is the frequency of events and how much they cost,” said Robert Passmore, assistant vice president of personal lines at the Property Casualty Insurers Association of America. “So, as these events become more frequent, that’s definitely going to have an impact.” (8)
After adjusting for inflation, insurance costs have steadily increased over time. From 2000 to 2020, insurance costs consistently grew faster than the Consumer Price Index due to rising rebuilding costs and weather-related losses.(3) Between 2020 and 2023 alone, the average home insurance premium increased from $75 to $360 due to climate change impacts, with disaster-prone regions experiencing especially steep increases.(1) Since 2015, homeowners in some regions affected by more extreme weather have seen home insurance costs increased by nearly 57%.(1) Some insurers have also limited or stopped offering coverage in high-risk areas.(7)
For many families, rising insurance costs are no longer occasional financial burdens. They are becoming recurring monthly expenses tied directly to growing climate risk.
How Rising Temperatures Increase Household Energy Costs

The financial impacts of climate change extend beyond insurance. Rising temperatures are also changing how much energy Americans use and how utilities plan for future electricity demand.
Between 1950 and 2010, per capita electricity use increased 10-fold, though usage has flattened or slightly declined since 2012 due to more efficient appliances and LED lighting. (3) A significant share of increased energy demand comes from cooling needs associated with higher temperatures.
Over the last 20 years, the United States has experienced increasing Cooling Degree Days (CDD) and decreasing Heating Degree Days (HDD). Nearly all counties have become warmer over the past three decades, with some areas experiencing several hundred additional cooling degree days, equivalent to roughly one additional degree of warmth on most days. (1) This trend reflects a warming climate where air conditioning demand is increasing while heating demand generally declines. (4)
As temperatures continue rising, households are expected to spend more on cooling than they save on heating. The U.S. Energy Information Administration (EIA) projects that by 2050, national Heating Degree Days will be 11% lower while Cooling Degree Days will be 28% higher than 2021 levels. Cooling demand is projected to rise 2.5 times faster than heating demand declines. (5)
These projections come from energy and infrastructure experts planning for future electricity demand and grid capacity needs. Utilities and grid operators are already preparing for higher peak summer electricity loads caused by rising temperatures. (5)
Longer and hotter summers also affect how homes and buildings are designed. Buildings constructed for past climate conditions may require upgrades such as larger air conditioning systems, stronger insulation, and improved ventilation to remain comfortable and energy efficient in the future. (10)
For many households, this means higher monthly utility bills and potentially higher long-term home improvement costs as temperatures continue to rise.
How Climate Change Affects Electricity Rates
On an inflation-adjusted basis, average U.S. residential electricity rates are slightly lower today than they were 50 years ago. (2) However, climate-related damage to utility infrastructure is creating new upward pressure on electricity costs.
Electric utilities rely heavily on above-ground poles, wires, transformers, and substations that can be damaged by hurricanes, storms, floods, and wildfires. Repairing and upgrading this infrastructure often requires substantial investment.
As a result, utilities are increasing electricity rates in response to wildfire and hurricane events to fund infrastructure repairs and future mitigation efforts. (1) The average cumulative increase in per-household electricity expenditures due to climate-related price changes is approximately $30. (1)
While this increase may appear modest today, utility costs are expected to rise further as climate-related infrastructure damage becomes more frequent and severe.
How Climate Disasters Increase Government Spending and Taxes
Extreme weather events also damage public infrastructure, including roads, schools, bridges, airports, water systems, and emergency services infrastructure. Recovery and rebuilding costs are often funded through taxpayer dollars at the federal, state, and local levels.
The average annual government cost tied to climate-related disaster recovery is estimated at nearly $142 per household. (1) States that frequently experience hurricanes, wildfires, tornadoes, or flooding can face even higher public recovery costs.
These expenses affect taxpayers whether they personally experience a disaster or not. Climate-related recovery spending can increase pressure on public budgets, emergency management systems, and infrastructure funding nationwide.
Reducing Climate Costs Through Climate Action
While this article focuses on the growing financial costs associated with climate change, the issue is not only about money for many people. It is also about recognizing our environmental impact and taking responsibility for reducing it in order to help preserve a healthy planet for future generations.
While individuals alone cannot solve climate change, collective action can help reduce future climate adaptation costs over time.
For those interested in taking action, there are three important steps:
- Estimate your carbon footprint to better understand the emissions connected to your lifestyle and activities.
- Create a plan to gradually reduce emissions through energy efficiency, cleaner technologies, and more sustainable choices.
- Address remaining emissions by supporting verified carbon reduction projects through carbon credits.
Carbon credits are one of the most cost-effective tools available for climate action because they help fund projects that generate verified emission reductions at scale. Supporting global emission reduction efforts can help reduce the long-term impacts and costs associated with climate change.
Visit Terrapass to learn more about carbon footprints, carbon credits, and climate action solutions.
The post How Climate Change Is Raising the Cost of Living appeared first on Terrapass.

Investor climate group closes down, blaming “limits” of shareholder activism

Where the Republican Party Has Gone Since Eisenhower in the 1950s
Cropped 3 June 2026: Highway through the Amazon | El Niño impact | State of CO2 removal
-
Climate Change10 months ago
Guest post: Why China is still building new coal – and when it might stop
-
Greenhouse Gases10 months ago
Guest post: Why China is still building new coal – and when it might stop
-

 Greenhouse Gases2 years ago
嘉宾来稿:满足中国增长的用电需求 光伏加储能“比新建煤电更实惠”
-

 Climate Change2 years ago
嘉宾来稿:满足中国增长的用电需求 光伏加储能“比新建煤电更实惠”
-
Climate Change2 years ago
Bill Discounting Climate Change in Florida’s Energy Policy Awaits DeSantis’ Approval
-

 Renewable Energy7 months ago
Sending Progressive Philanthropist George Soros to Prison?
-

 Carbon Footprint2 years ago
US SEC’s Climate Disclosure Rules Spur Renewed Interest in Carbon Credits
-
Greenhouse Gases11 months ago
嘉宾来稿:探究火山喷发如何影响气候预测