


Many fail to realize this is not the first energy transition.
Although the media have made it appear as if it’s the first energy transition, it’s not.
For example, the nuclear energy industry development which started in WW2 was a major energy transition. In today’s dollars, half a trillion dollars went into the research and development of nuclear reactors along with uranium mines and fabrication plants that would feed the operating nuclear reactors.
In fact, one of the most fascinating stories of collusion, corruption and cartels happened as America was developing its first energy transition. Amazingly, it almost “destroyed” the nuclear industry.
So, before you think the current Energy Transition has failed (which it is not over and will happen) let’s explain the drama that almost took down the first major Energy Transition in America.
Have you ever heard of the Yellow Cartel?
The Yellow Cartel
Everyone knows about the oil cartel called OPEC. But did you know that in the 1970s, a uranium cartel was conspired by one of the largest mining companies in the world and the Canadian government?
From 1955 through 1970 hundreds of billions of dollars were being committed by the US, France, Sweden, Japan and West Germany to build nuclear power plants. The Yellow Cartel started in 1971 with the London based mining giant, Rio Tinto approaching the Canadian government concerning the formation of a cartel for controlling uranium market pricing.
The first official meeting occurred in February 1972, in Paris, and the International Uranium Cartel was created.
Eventually, 29 producing companies would become members of the International Uranium Cartel, which was nicknamed the ‘Yellow Cartel” for the color of yellowcake that the cartel was colluding to price fix.
Rio Tinto, Uranerz (the large German uranium producer in the 70s), the Canadian Government and ultimately a total 29 uranium producers made up the Uranium Cartel.
The Uranium Cartel was successful in increasing the price of uranium almost 10-fold in a few short years by deploying illegal tactics such as price fixing schemes.
Later, the Canadian government would form two uranium entities which would lead to the creation of Cameco, a top 5 uranium producer worldwide.
There were two real catalysts that caused the formation of the International Uranium Cartel. But why did Rio Tinto pitch this plan that almost would turn the energy world upside down and risk America’s energy security and the first major energy transition?
The first catalyst was the move by the US government to place an embargo on all foreign uranium in 1964 to protect its own uranium mines.
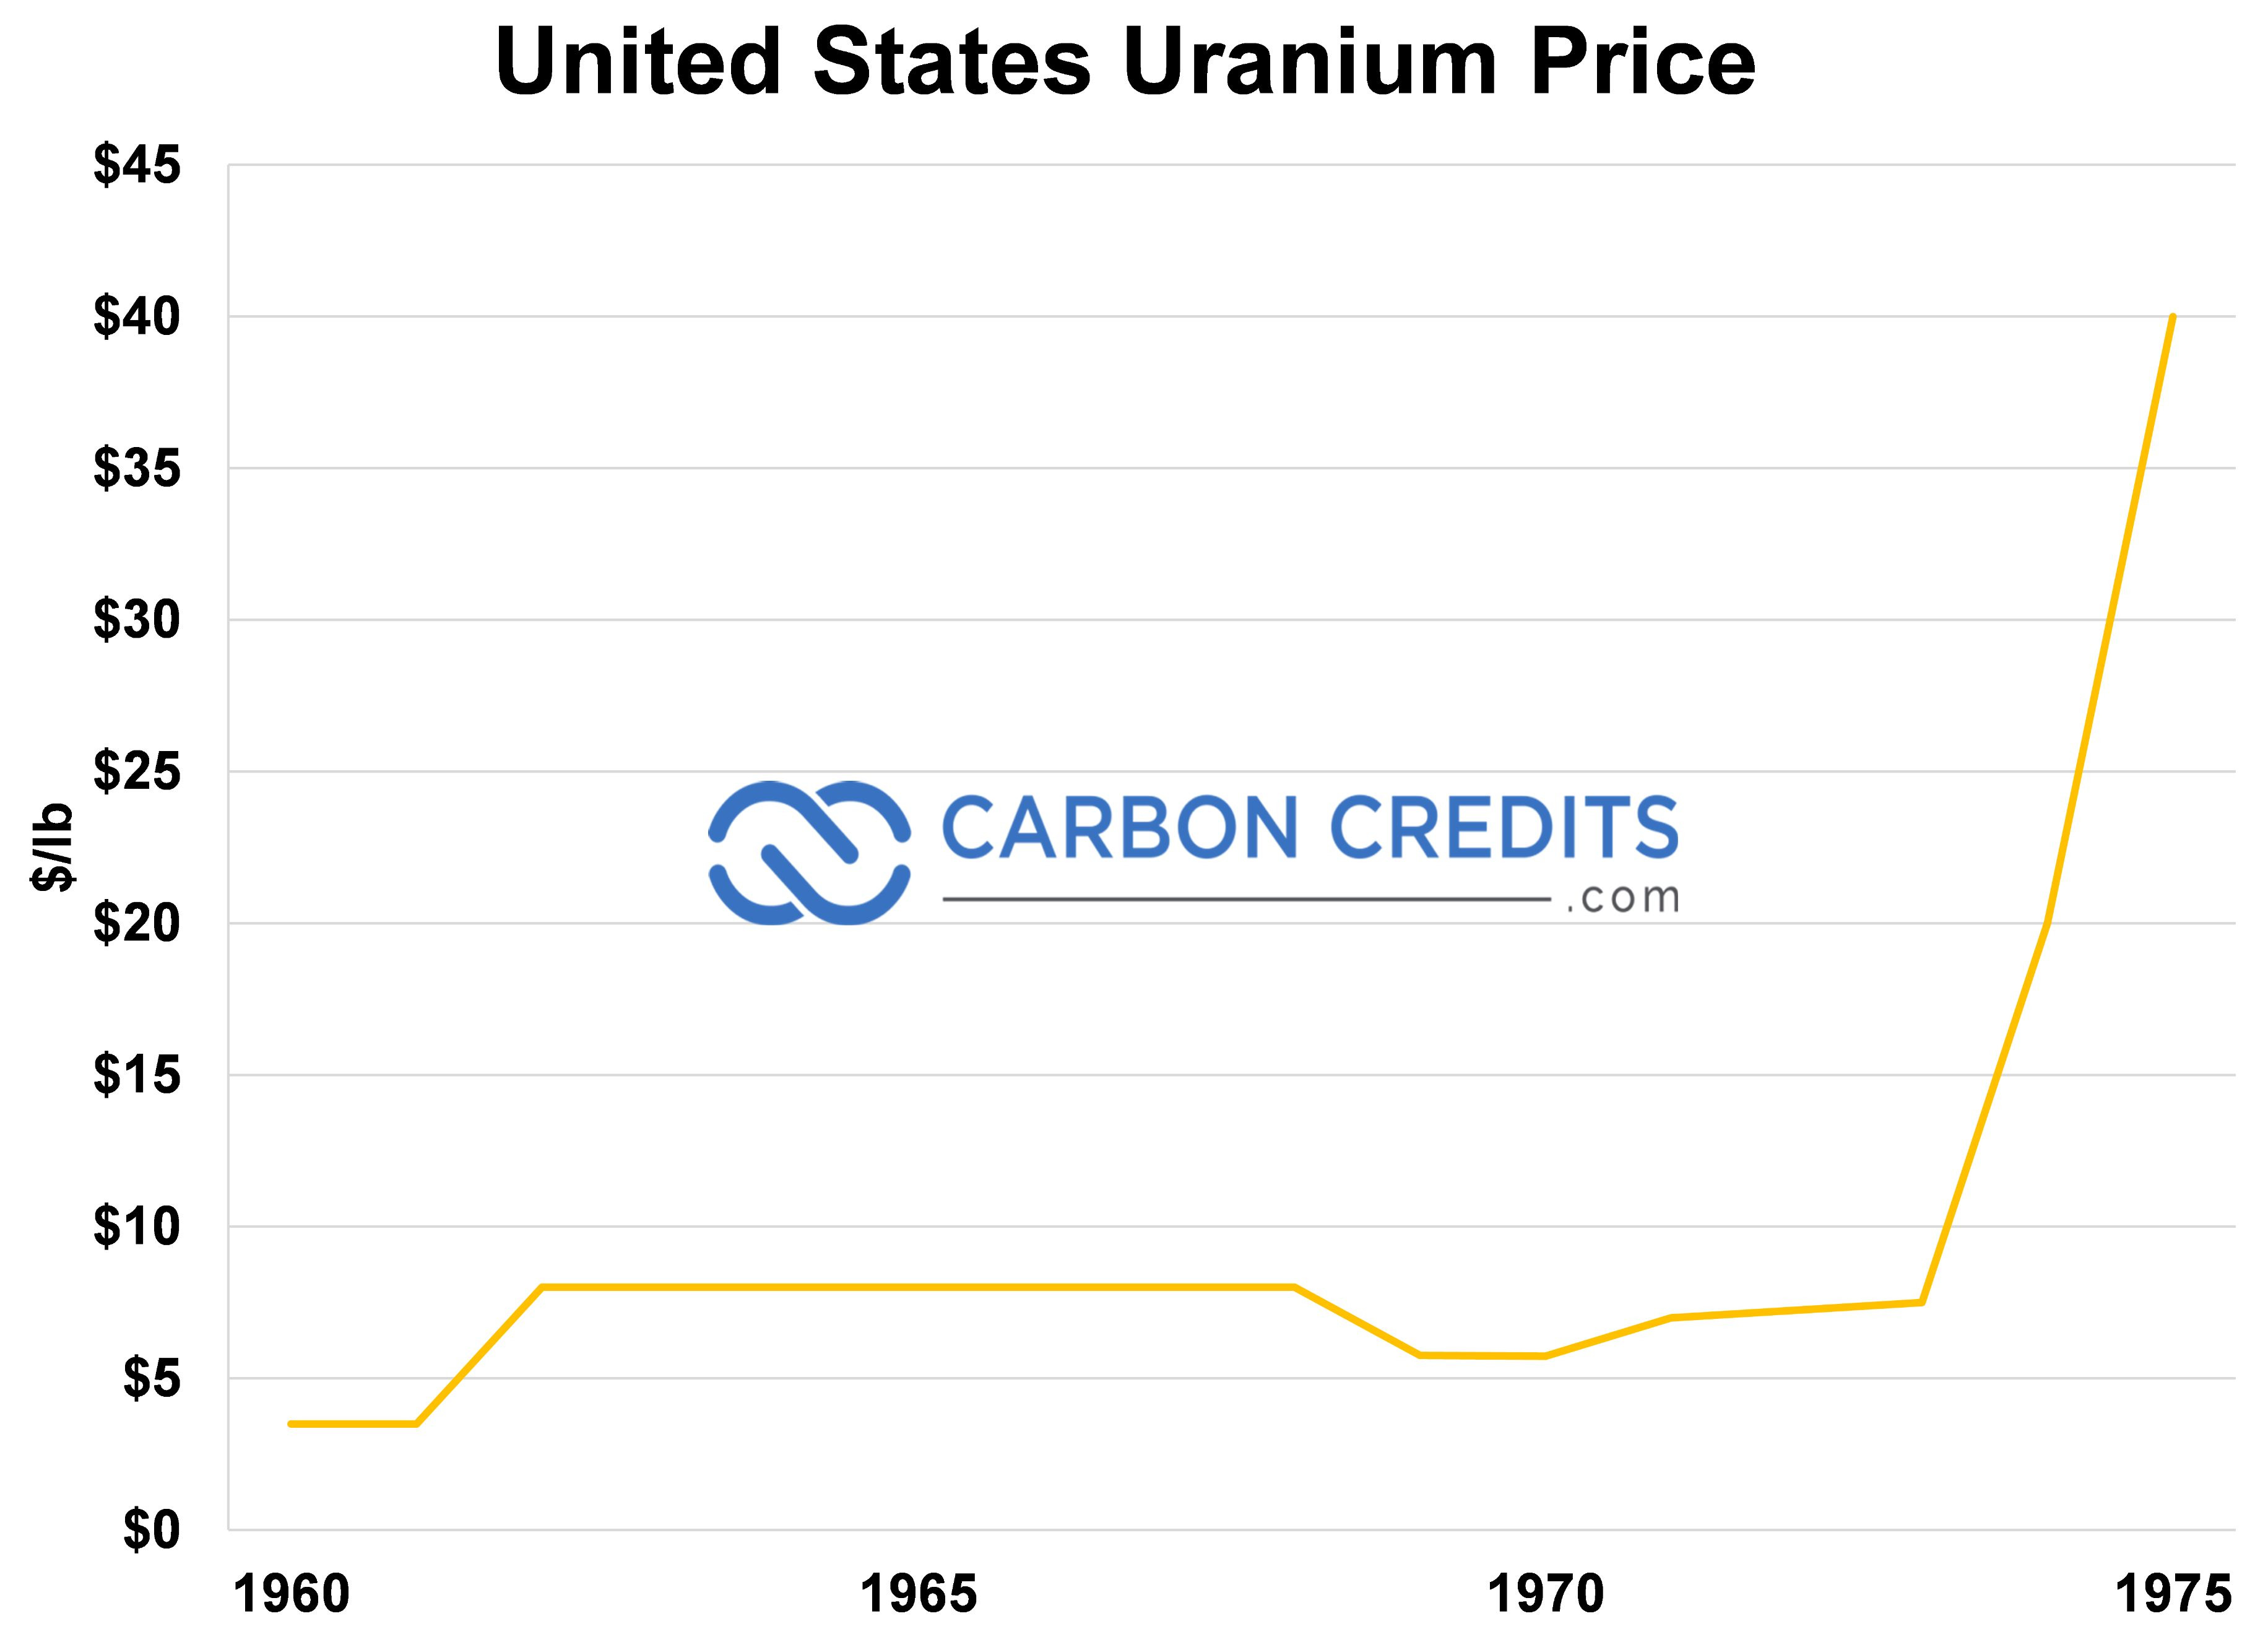
At that time, the United States consumed about 70% of the global uranium production (for both its military and energy needs) and with that demand for uranium now gone outside the USA, the price of uranium crashed to $5 per pound in 1970.
But because the price of uranium was so high during the 1950s and first half of the 1960s, significant amounts of risk capital was spent on exploration for new uranium deposits globally. As a result of all this new uranium exploration was major uranium discoveries were made in places like Niger and Australia.
By the late 1960s significant uranium deposits would be discovered in Australia such as Jabiluka 1 & 2.
Eventually the massive discovery of Olympic Dam which would become one of the largest polymetallic mines (including uranium) in the world. Olympic Dam would soon replace the depleting uranium from the Rum Jungle Mine in Australia which was producing uranium since 1954 and was shut down for good in 1971.
Because of and other events such as those mentioned above, by 1971, there was over 220 Million pounds of global uranium production and only 55 Million pounds of uranium global demand. The uranium market was oversupplied by 400%.
Because of both the US embargo on foreign supplies of uranium and an oversupply of uranium production to demand by 400%, the price of uranium was hovering around $5/pound in 1971.
But because of the price fixing tactics of the Uranium Cartel, the price of uranium surged to $40/pound.
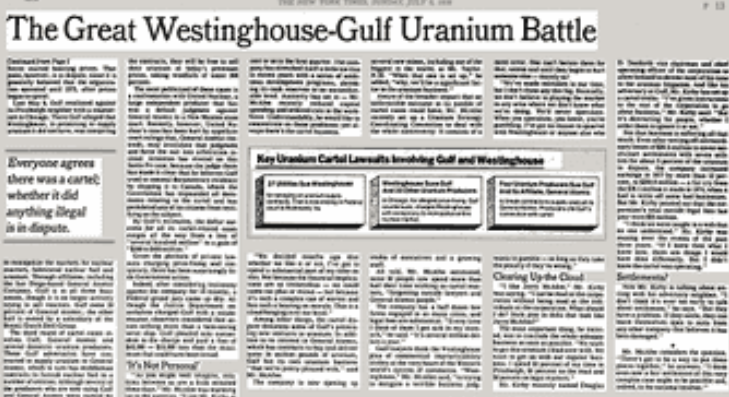
The move in uranium prices brought down the world’s largest nuclear reactor builder in the world, Westinghouse Electric Corp. on September 8, 1975.
Westinghouse was able to become the world’s largest developer and installer of nuclear reactors because it had the best track record, nuclear technology and most importantly it promised a long-term supply of uranium feed to power the Westinghouse PWR reactors. A dream trifecta for large utilities and government entities alike.
To put things in perspective, half of the world’s current operating nuclear power plants are using the basis of Westinghouse’s PWR reactor technology. Between 1960 and 1970, Westinghouse was able to secure US government backed utility contracts (and same in Sweeden) worth tens of billions of dollars because Westinghouse committed to supply 65 million pounds to the American and Swedish nuclear reactors with a fixed price contract.
But things quickly turned very bad for Westinghouse. The utilities, citizens and the American Government. Because the price of uranium increased 10X (1000%) from when Westinghouse signed those fixed price utility contracts, on September 8th, 1975 Westinghouse announced that it would not honor the 65 million pounds of uranium it committed to the American and Swedish utilities.
It was revealed in legal documents that the American consumer ended up paying billions of dollars in additional electricity costs due to the Uranium Cartels actions. In fact, New York state alone paid over $1Billion in electricity prices shortly after the Yellow Cartel activities.
On October 15, 1976, Westinghouse took matters into its own hands. It filed for conspiracy, in violation of United States anti-trust laws against the 29 producing uranium companies that made up the International Uranium Cartel estimating damages between $4-6 Billion.
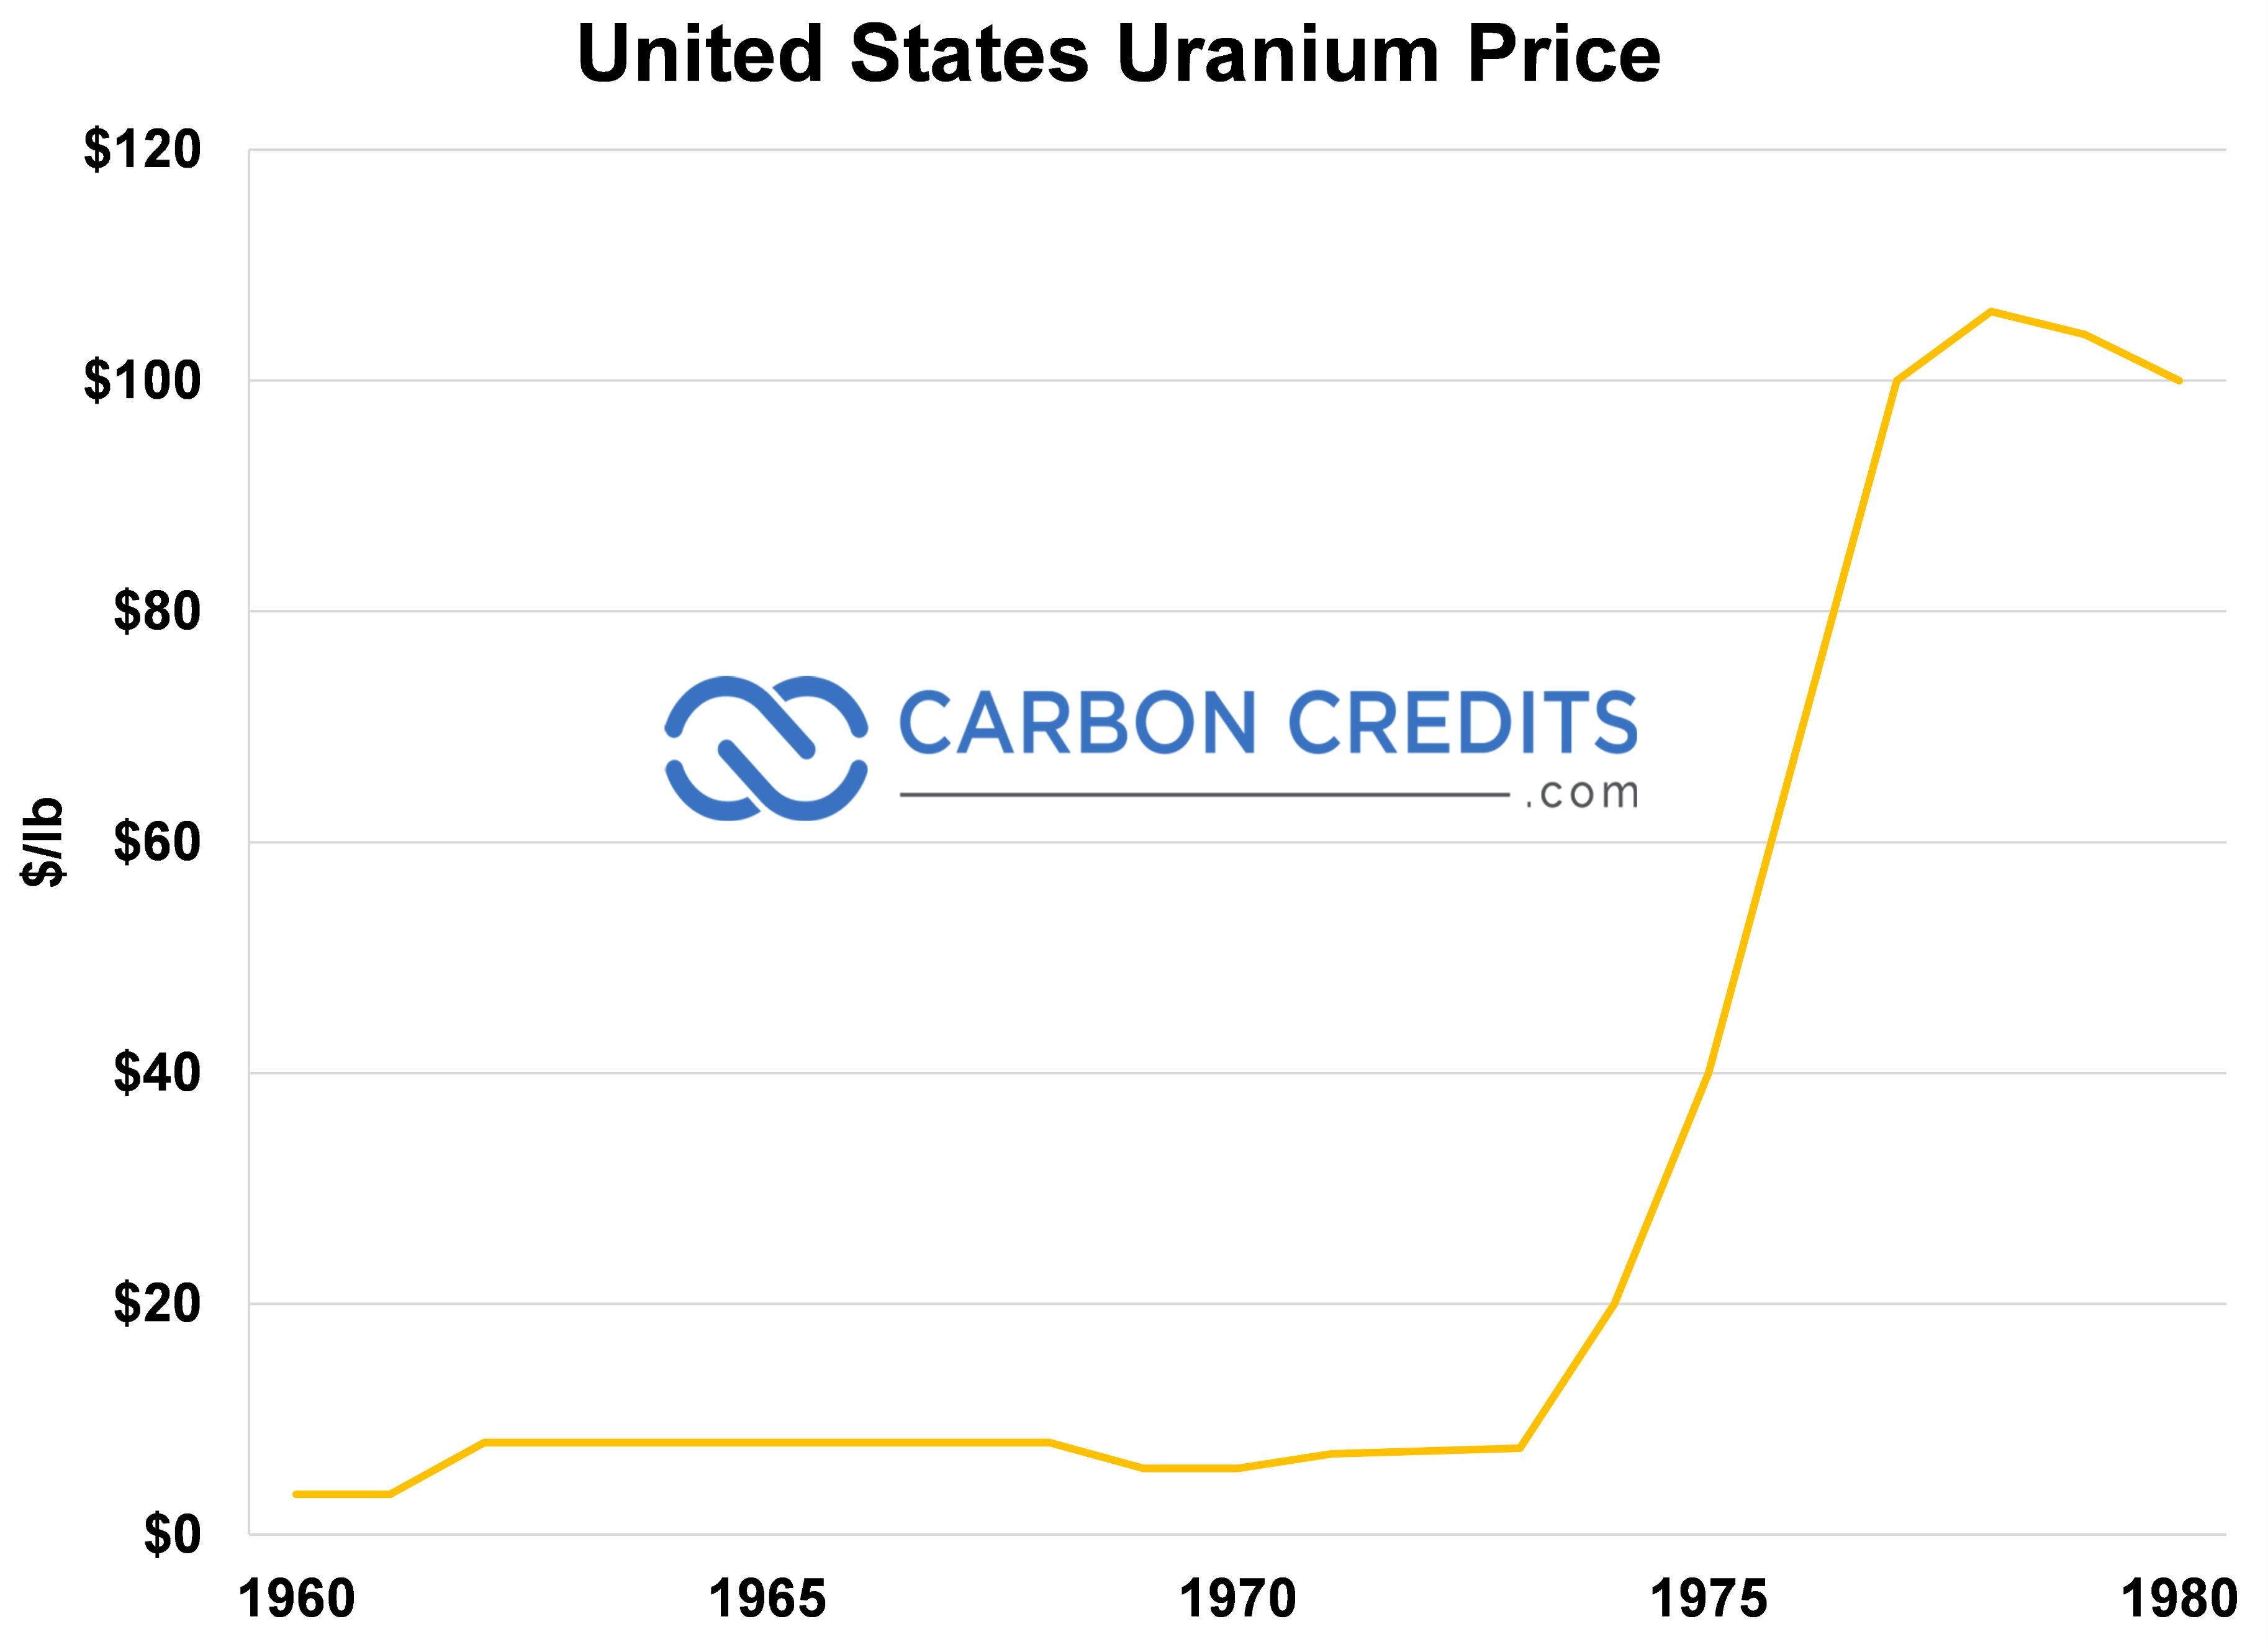
Uranium continued to soar after 1976, surpassing $100 per pound throughout the late seventies.
Around that time, people called for the end of the energy transition citing the negative impact caused by the Uranium Cartel. This was just one of many attacks survived by the uranium industry. In fact, the nuclear sector not only survived the Uranium Cartel fiasco, but Chernobyl, Fukushima and countless other project and sector setbacks over the years.
Right now, we are in the greatest energy transition in human history. Tens of trillions of dollars will be spent worldwide on energy transition and decarbonization. Nuclear is a big part of the solution.
In fact, without uranium, there is no clean, long term base load nuclear power. Which is why we are currently in one of the greatest uranium bull markets of all time.
There are three uranium giants in global uranium production. The largest global producer came out of the fall of the Soviet Union, Kazatomprom. The third largest global uranium producer, as described above, was the result of the Canadian Government merging two state owned enterprises and created Cameco.
But do you know who the second largest producer of uranium globally is?
And the major moves this company is making after almost blowing itself up?
In an upcoming feature article, we will bring to the forefront the under the radar moves that the second largest producer of uranium is doing and how investors can benefit.
The post Has the Energy Transition Failed and is it Over? appeared first on Carbon Credits.

EU carbon credit claims changed on 27 September 2026, the day the Directive (EU) 2024/825 began to apply across the European Union. The change is narrow. It changes how a company can talk about the credits it buys. A product can no longer be called neutral on the strength of compensation alone; however, every specific, evidenced statement about what a company measured, reduced, and funded stays fully available.

The post Promoting Improved Cooking Practices in Nigeria appeared first on Terrapass.



-
Climate Change1 year ago
Guest post: Why China is still building new coal – and when it might stop
-

 Greenhouse Gases2 years ago
嘉宾来稿:满足中国增长的用电需求 光伏加储能“比新建煤电更实惠”
-
Greenhouse Gases1 year ago
Guest post: Why China is still building new coal – and when it might stop
-

 Climate Change2 years ago
嘉宾来稿:满足中国增长的用电需求 光伏加储能“比新建煤电更实惠”
-

 Renewable Energy12 months ago
Sending Progressive Philanthropist George Soros to Prison?
-
Climate Change2 years ago
Bill Discounting Climate Change in Florida’s Energy Policy Awaits DeSantis’ Approval
-
Greenhouse Gases1 year ago
嘉宾来稿:探究火山喷发如何影响气候预测
-

 Climate Change2 years ago
Analysis: China’s CO2 falls 1% in Q2 2024 in first quarterly drop since Covid-19