
Over the past decade, research has emerged suggesting that ramping up reforestation around the world could make a substantial contribution to tackling climate change.
Studies have estimated that the CO2-absorbing power of newly planted trees could add up to mitigation “potential” of 10bn tonnes (GtCO2) per year – more than the annual emissions of the US.
Achieving this would require planting trees across 678m hectares – an area twice the size of India.
But the uncertainty around those figures is large due to a range of factors, such as where sufficient trees already exist, how much climate mitigation those trees offer and where people actually want additional trees to be planted.
In our new study, published in Nature Communications, we unpack eight years of research into reducing these uncertainties.
We have quantified, for example, how the carbon-sucking power of trees changes when you let forests grow back naturally versus planting monoculture or mixed-species plantations.
We figured out how much carbon could be removed at different price points and mapped where trees – somewhat counterintuitively – actually act to warm, rather than cool, our climate.
But, as we shrank the uncertainty, we also shrank the estimate itself.
Our research provides the most precise estimate of global reforestation area to date – 195m hectares, or 71% less than earlier estimates.
Reforesting an area this size could capture 2GtCO2 per year.
Mapping reforestation opportunity
Maps of global reforestation potential have been cited in thousands of scientific publications, inspired large-scale tree-planting movements and been used by the International Panel on Climate Change (IPCC) in its flagship reports.
However, they have also been very controversial.
Critics have pointed out, for example, that these maps failed to account for natural disturbances that prevent forest growth, ignored existing trees and overlooked the people that live, steward and often depend on those lands for their wellbeing.
In our new study, we resolved to produce a map that addresses these past critiques.
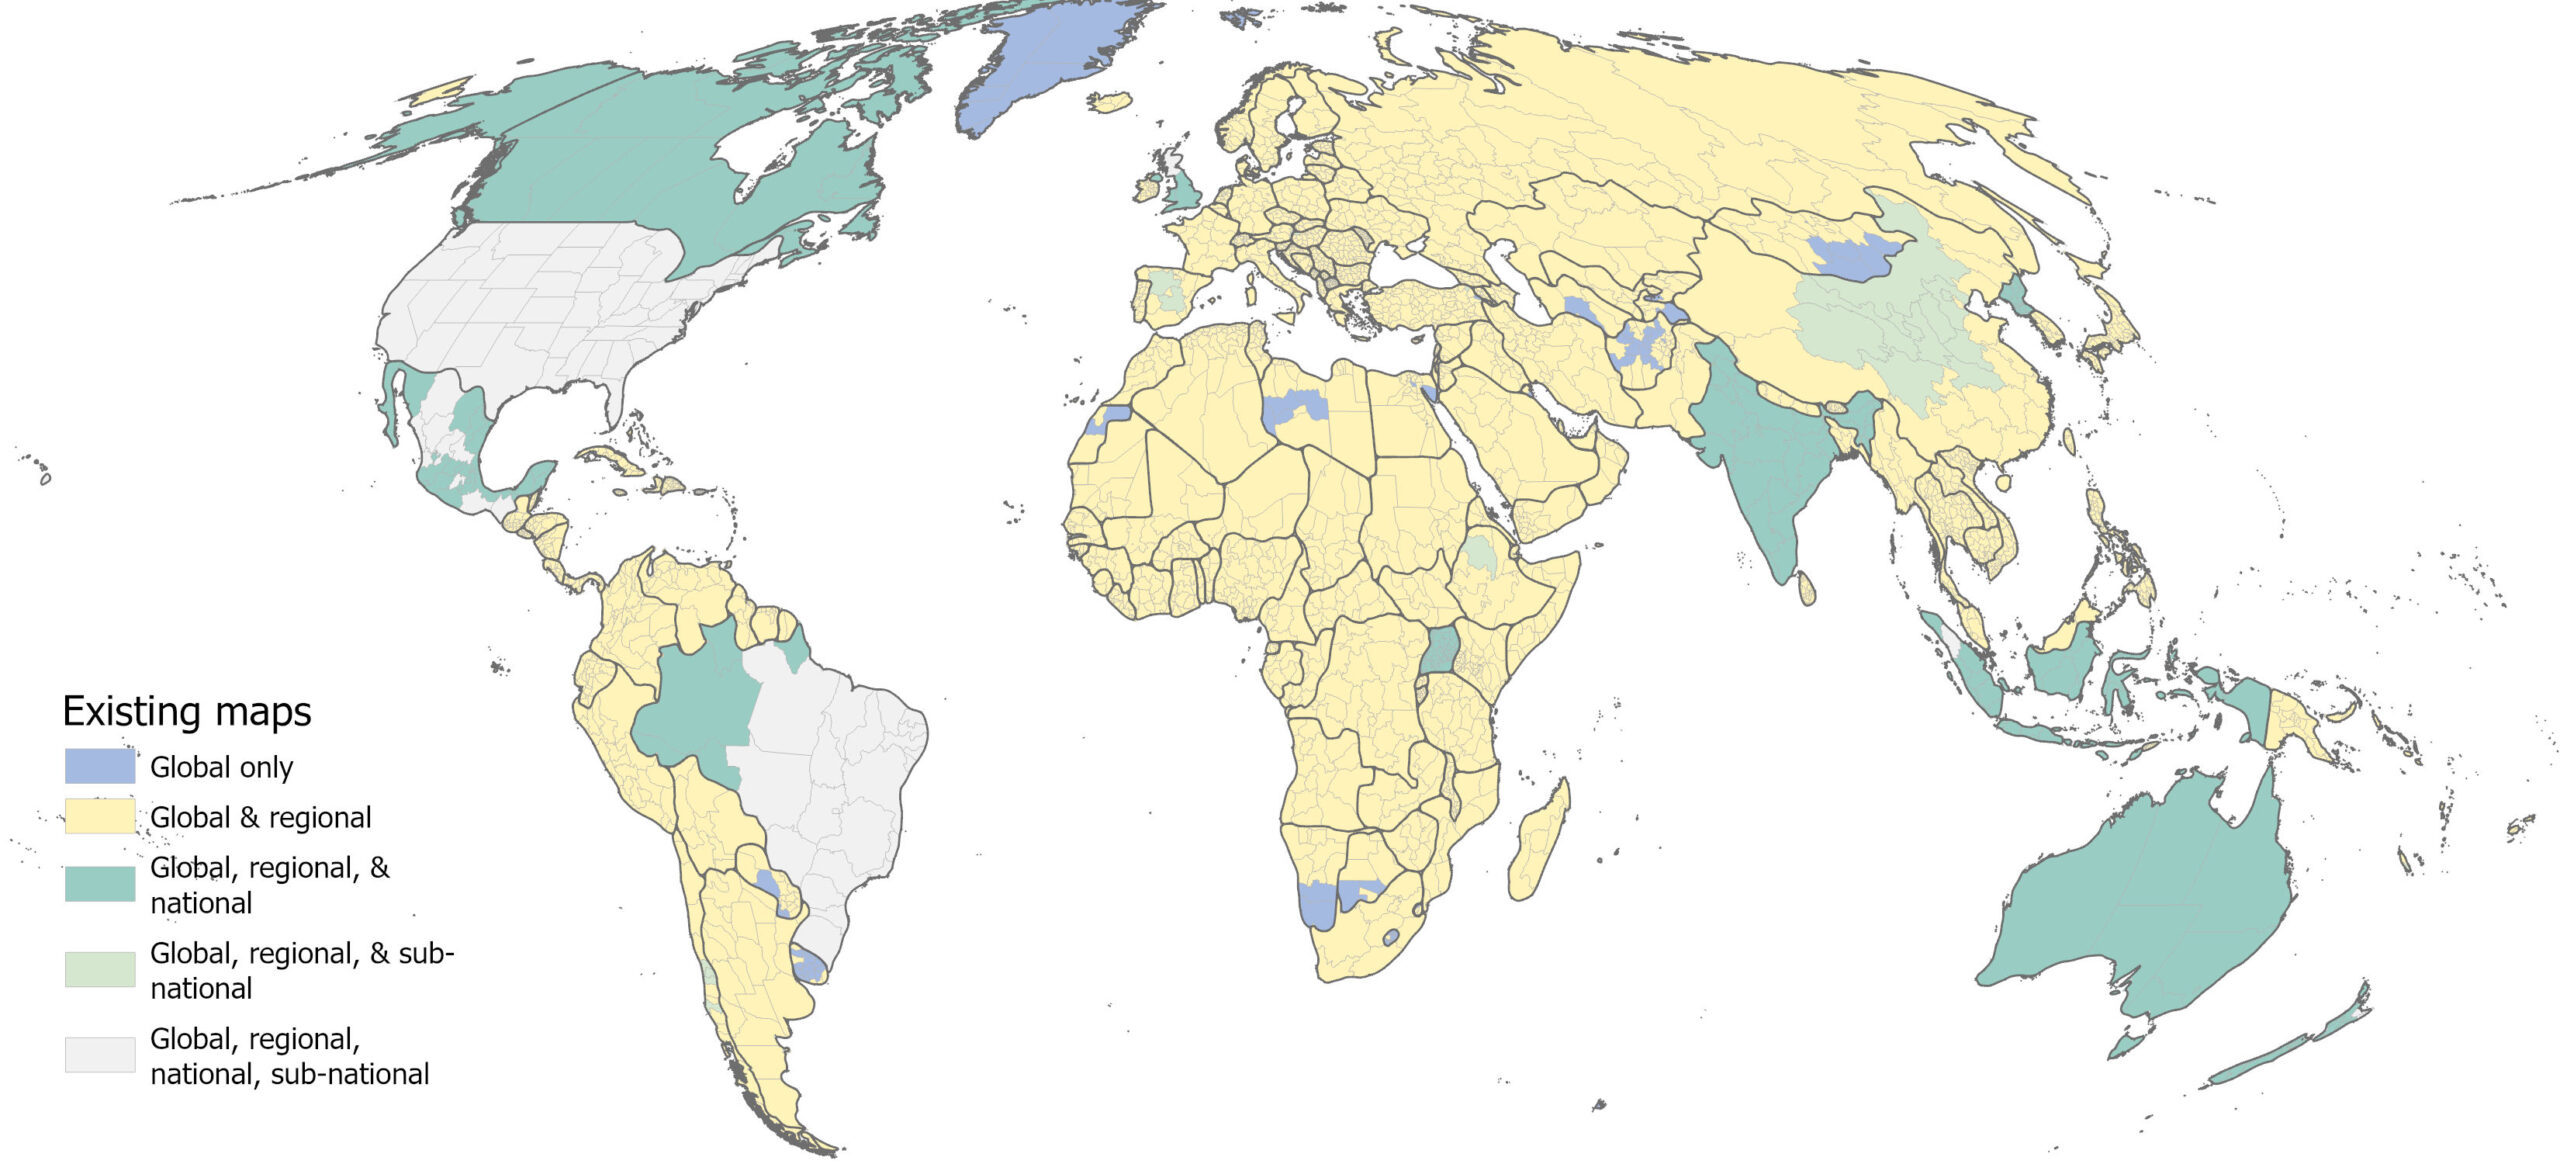
We began by searching for existing maps of reforestation “opportunity”.
Our search uncovered 89 such maps, although most of those we identified are national or sub-national. Some places – such as Brazil’s Atlantic Forest – have many maps, but we found that most of the globe was only covered by a single older, more controversial map.
The map below shows where we found existing maps at the global, regional, national and sub-national levels.
Thus, we set about creating a new global map that built upon the methods of past efforts, tackled prominent critiques and incorporated newly available layers.
Our new map accounts for albedo, for example – how restoring tree cover can, in some locations, actively heat the Earth, rather than cool it, by affecting how much sunlight is absorbed or reflected.
It excludes native grasslands and other ecosystems where carpeting the land with trees would harm biodiversity and exacerbate the risk of wildfire. And it layers in additional safeguards, such as food security, to ensure that reforestation outcomes are more likely to be beneficial to people.
These constraints left us with up to 195m hectares of reforestation opportunity across the world.
A reforestation ‘menu’
Not all reforestation opportunities are created equal – different communities may want to implement reforestation for different reasons, such as restoring floodplains or re-establishing iconic ecosystems that have been lost.
So, alongside the reforestation opportunity, our map shows other factors that communities or decisionmakers may use to help them prioritise areas for reforestation.
We show, for example, where natural regeneration may be most likely to occur and where biodiversity benefits may be greatest, given proximity to existing forest. We show where reforestation opportunity exists on slopes and floodplains – and therefore is more likely to provide benefits for the local watershed. We show places where people have strong rights and secure land tenure, to avoid exacerbating social inequities.
Perhaps unsurprisingly, it is hard to find places that tick all of these complex boxes. But, it is still possible to achieve multiple objectives in one location.
In fact, our study finds that 83% of reforestation opportunities occur close to existing forest, while 81% occur in places that are expected to have low conflicts with rural livelihoods.
More than half of the opportunity that we identify also occurs in countries with explicit restoration goals – places such as Brazil’s Atlantic Forest, where we are working with local partners and communities to restore 1.2m hectares of forest. Forest restoration there contributes to national climate goals, supports sustainable economic development and connects habitat for wildlife.
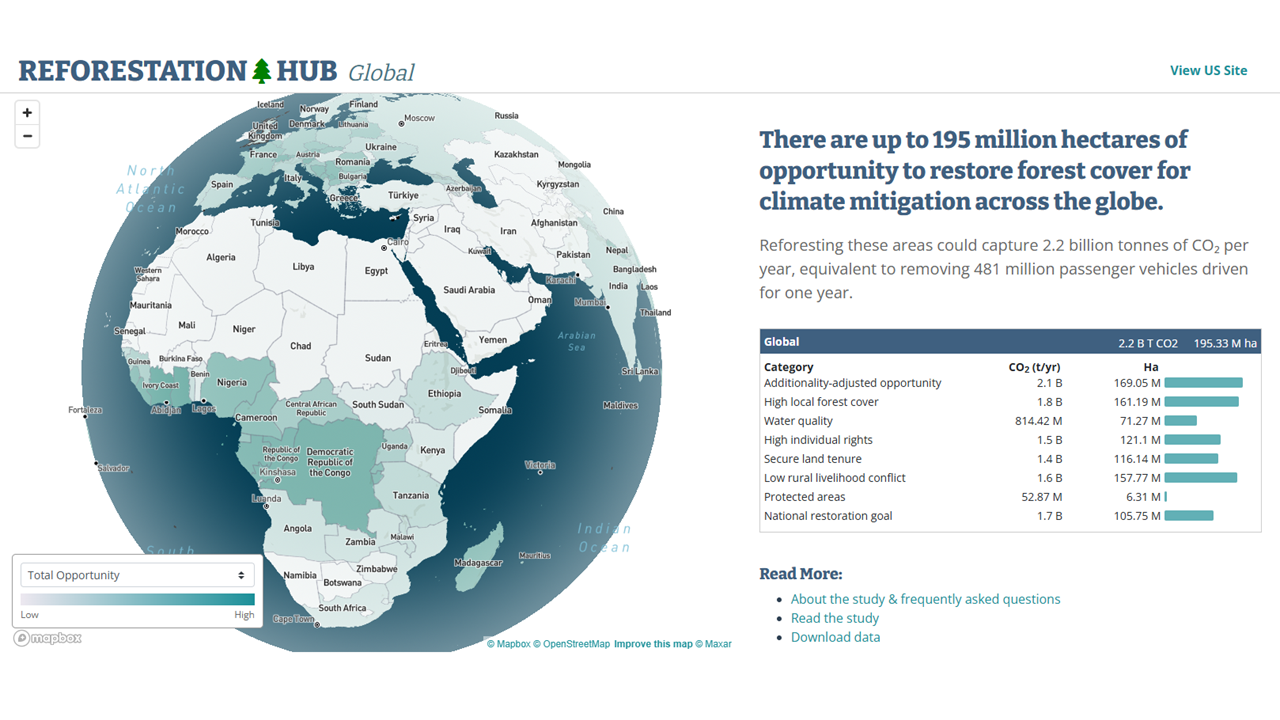
Alongside the paper, we present the Global Reforestation Hub, which allows users to explore this menu of reforestation options, drill down to reforestation potential at county level and see what opportunities meet a given set of objectives.
For example, a government interested in climate mitigation and protection from floods might use the tool to find the places within their country where both goals might be achieved via reforestation.
The screenshot below shows the Global Reforestation Hub. Countries are coloured by their total reforestation opportunity, from low (white) to high (dark blue). The table shows the amount of land available for – and the CO2 mitigation potential of – reforestation given different priorities and constraints.
Smaller can be better
Reforestation remains one of the most cost-effective climate removal options, but it cannot – and should not – happen everywhere.
While there are certainly opportunities to plant and regrow trees beyond what we have mapped here, we created these maps to show where the climate mitigation opportunities – and their co-benefits – are most concentrated.
Prioritising other motivations, such as human health, habitat for specific wildlife species or local considerations, would also increase the total reforestation opportunity area. For example, our maps don’t include the potential for reforestation in dense urban areas, but trees in those areas can be highly beneficial for human health.
Our study prioritised mapping opportunities for climate change mitigation – and we were deliberately conservative, erring on the side of caution when determining which places to include.
The result is a map that shows the places where reforestation offers both the greatest climate benefits and the fewest downsides for both people and nature.
During a year when the UN climate COP will be hosted in the most iconic forest of all, our study is less a critique of the pre-existing numbers and more an effort to create the most precise and pragmatic maps of reforestation potential. This can help ensure that we get the reforestation part of the climate equation right.


The post Guest post: Why the global area for regrowing trees is 71% smaller than thought appeared first on Carbon Brief.
Guest post: Why the global area for regrowing trees is 71% smaller than thought
A new paper suggests that 15 percent of global warming comes from overlooked pollutants.
Record-high global temperatures aren’t driven only by well-known greenhouse gas culprits.
The decision voided the EPA guidance to terminate the $2.8 billion grant program. But it stopped short of requiring the agency to resume administering it.
A federal judge in South Carolina ruled this week that the Trump administration’s termination of environmental justice grants was “illegal.” The decision dealt a setback to efforts to dismantle a Biden-era program that funded projects addressing environmental and public health challenges in underserved communities across the country.
Trump’s EPA Unlawfully Cancelled Environmental Justice Grants, Judge Rules
The surge in satellites brings pollution and risks of repeating destructive colonial practices, experts warn.
The starry night sky has always anchored humanity’s sense of place in a vast universe. It’s a map guiding travelers, a calendar for migrations and harvests, a wellspring of stories. But a surge of commercial satellite launches into the upper fringes of Earth’s atmosphere threatens the relationship between people and the celestial commons by crowding the night sky and polluting the atmosphere, scientists warn.
A Commercial Space Race Prompts a Thorny Question: Who Owns the Sky?


-
Climate Change10 months ago
Guest post: Why China is still building new coal – and when it might stop
-
Greenhouse Gases10 months ago
Guest post: Why China is still building new coal – and when it might stop
-

 Greenhouse Gases2 years ago
嘉宾来稿:满足中国增长的用电需求 光伏加储能“比新建煤电更实惠”
-

 Climate Change2 years ago
嘉宾来稿:满足中国增长的用电需求 光伏加储能“比新建煤电更实惠”
-
Climate Change2 years ago
Bill Discounting Climate Change in Florida’s Energy Policy Awaits DeSantis’ Approval
-

 Renewable Energy8 months ago
Sending Progressive Philanthropist George Soros to Prison?
-

 Carbon Footprint2 years ago
US SEC’s Climate Disclosure Rules Spur Renewed Interest in Carbon Credits
-
Greenhouse Gases11 months ago
嘉宾来稿:探究火山喷发如何影响气候预测