Extreme “wind droughts” that reduce power output from turbines for extended periods could become 15% longer by the end of the century across much of the northern hemisphere under a moderate warming scenario.
That is according to a new study in Nature Climate Change, which explores how climate change could impact the length and frequency of prolonged low-wind events around the world.
According to the study, “prominent” wind droughts have already been documented in Europe, the US, northeastern China, Japan and India.
As the planet warms, wind droughts will become longer in the northern hemisphere and mid-latitudes – especially across the US, northeastern China, Russia and much of Europe – the paper says.
The study – which focuses on onshore wind – warns that “prolonged” wind droughts could “threaten global wind power security”.
However, they add that research into the effects of climate change on wind supply can help “prepare for and mitigate the adverse impacts” of these prolonged low-wind events.
Combining wind power with other energy technologies – such as solar, hydro, nuclear power and energy storage – can help reduce the impact of wind droughts on global energy supply, the study says.
One expert not involved in the research tells Carbon Brief that the findings do not “spell doom for the wind industry”.
Instead, he says the study is a “navigation tool” which could help the energy industry to “counteract” future challenges.
Wind drought
Wind power is one of the fastest-growing sources of energy in the world and currently makes up around 8% of global electricity supply. It is also playing a crucial role in the decarbonisation of many countries’ energy systems.
Wind is the result of air moving from areas of high pressure to areas of low pressure. These differences in air pressure are often due to the Earth’s surface being heated unevenly.
Human-caused climate change is warming the planet’s atmosphere and oceans. However, different regions are heating at different rates, resulting in a shift in global wind patterns. The IPCC finds that global average wind speeds (excluding Australia) slowed down slightly over 1979-2018.
There have already been dozens of recorded instances of prolonged low-wind events, known as wind droughts, which can drive down power production from wind turbines.
Dr Iain Staffell is an associate professor at the Centre for Environmental Policy at Imperial College London who was not involved in the study. He tells Carbon Brief that wind droughts often “push up power prices” as countries turn to more expensive alternative energy supplies, such as fossil fuels.
For example, Staffell tells Carbon Brief that, in the winter of 2024-25, Germany saw an “extended cold-calm spell which sent power prices to record highs”. (In German, this type of weather event is referred to as a “dunkelflaute”, often translated as “dark doldrums”.) He adds:
“It’s important to note that I’m not aware of anywhere in the world that has suffered a blackout because of a wind drought.”
Capacity factor
The productivity of wind power sites is often measured by their “capacity factor” – the amount of electricity that is actually generated over a period of time, relative to the maximum amount that could have been generated in theory.
A capacity factor of one indicates that wind turbines are generating the maximum possible amount of electricity, while zero indicates that they are not producing any power.
The authors define a wind drought as the 20th percentile in each grid cell – in other words, winds ranking in the slowest bottom fifth of winds typically recorded in the region.
They look at the frequency of prolonged wind droughts and how that might change as the world warms.
The map below shows regions’ average capacity factor at 100 metres above the ground level, derived from the ERA5 reanalysis data over 1980-2022, where darker shading indicates a higher capacity factor.
It also shows 19 wind droughts recorded since the year 2000 across Europe, the US, northeastern China, Japan and India. Wind droughts are indicated by yellow triangles for local events and hashed areas for larger-scale events.\
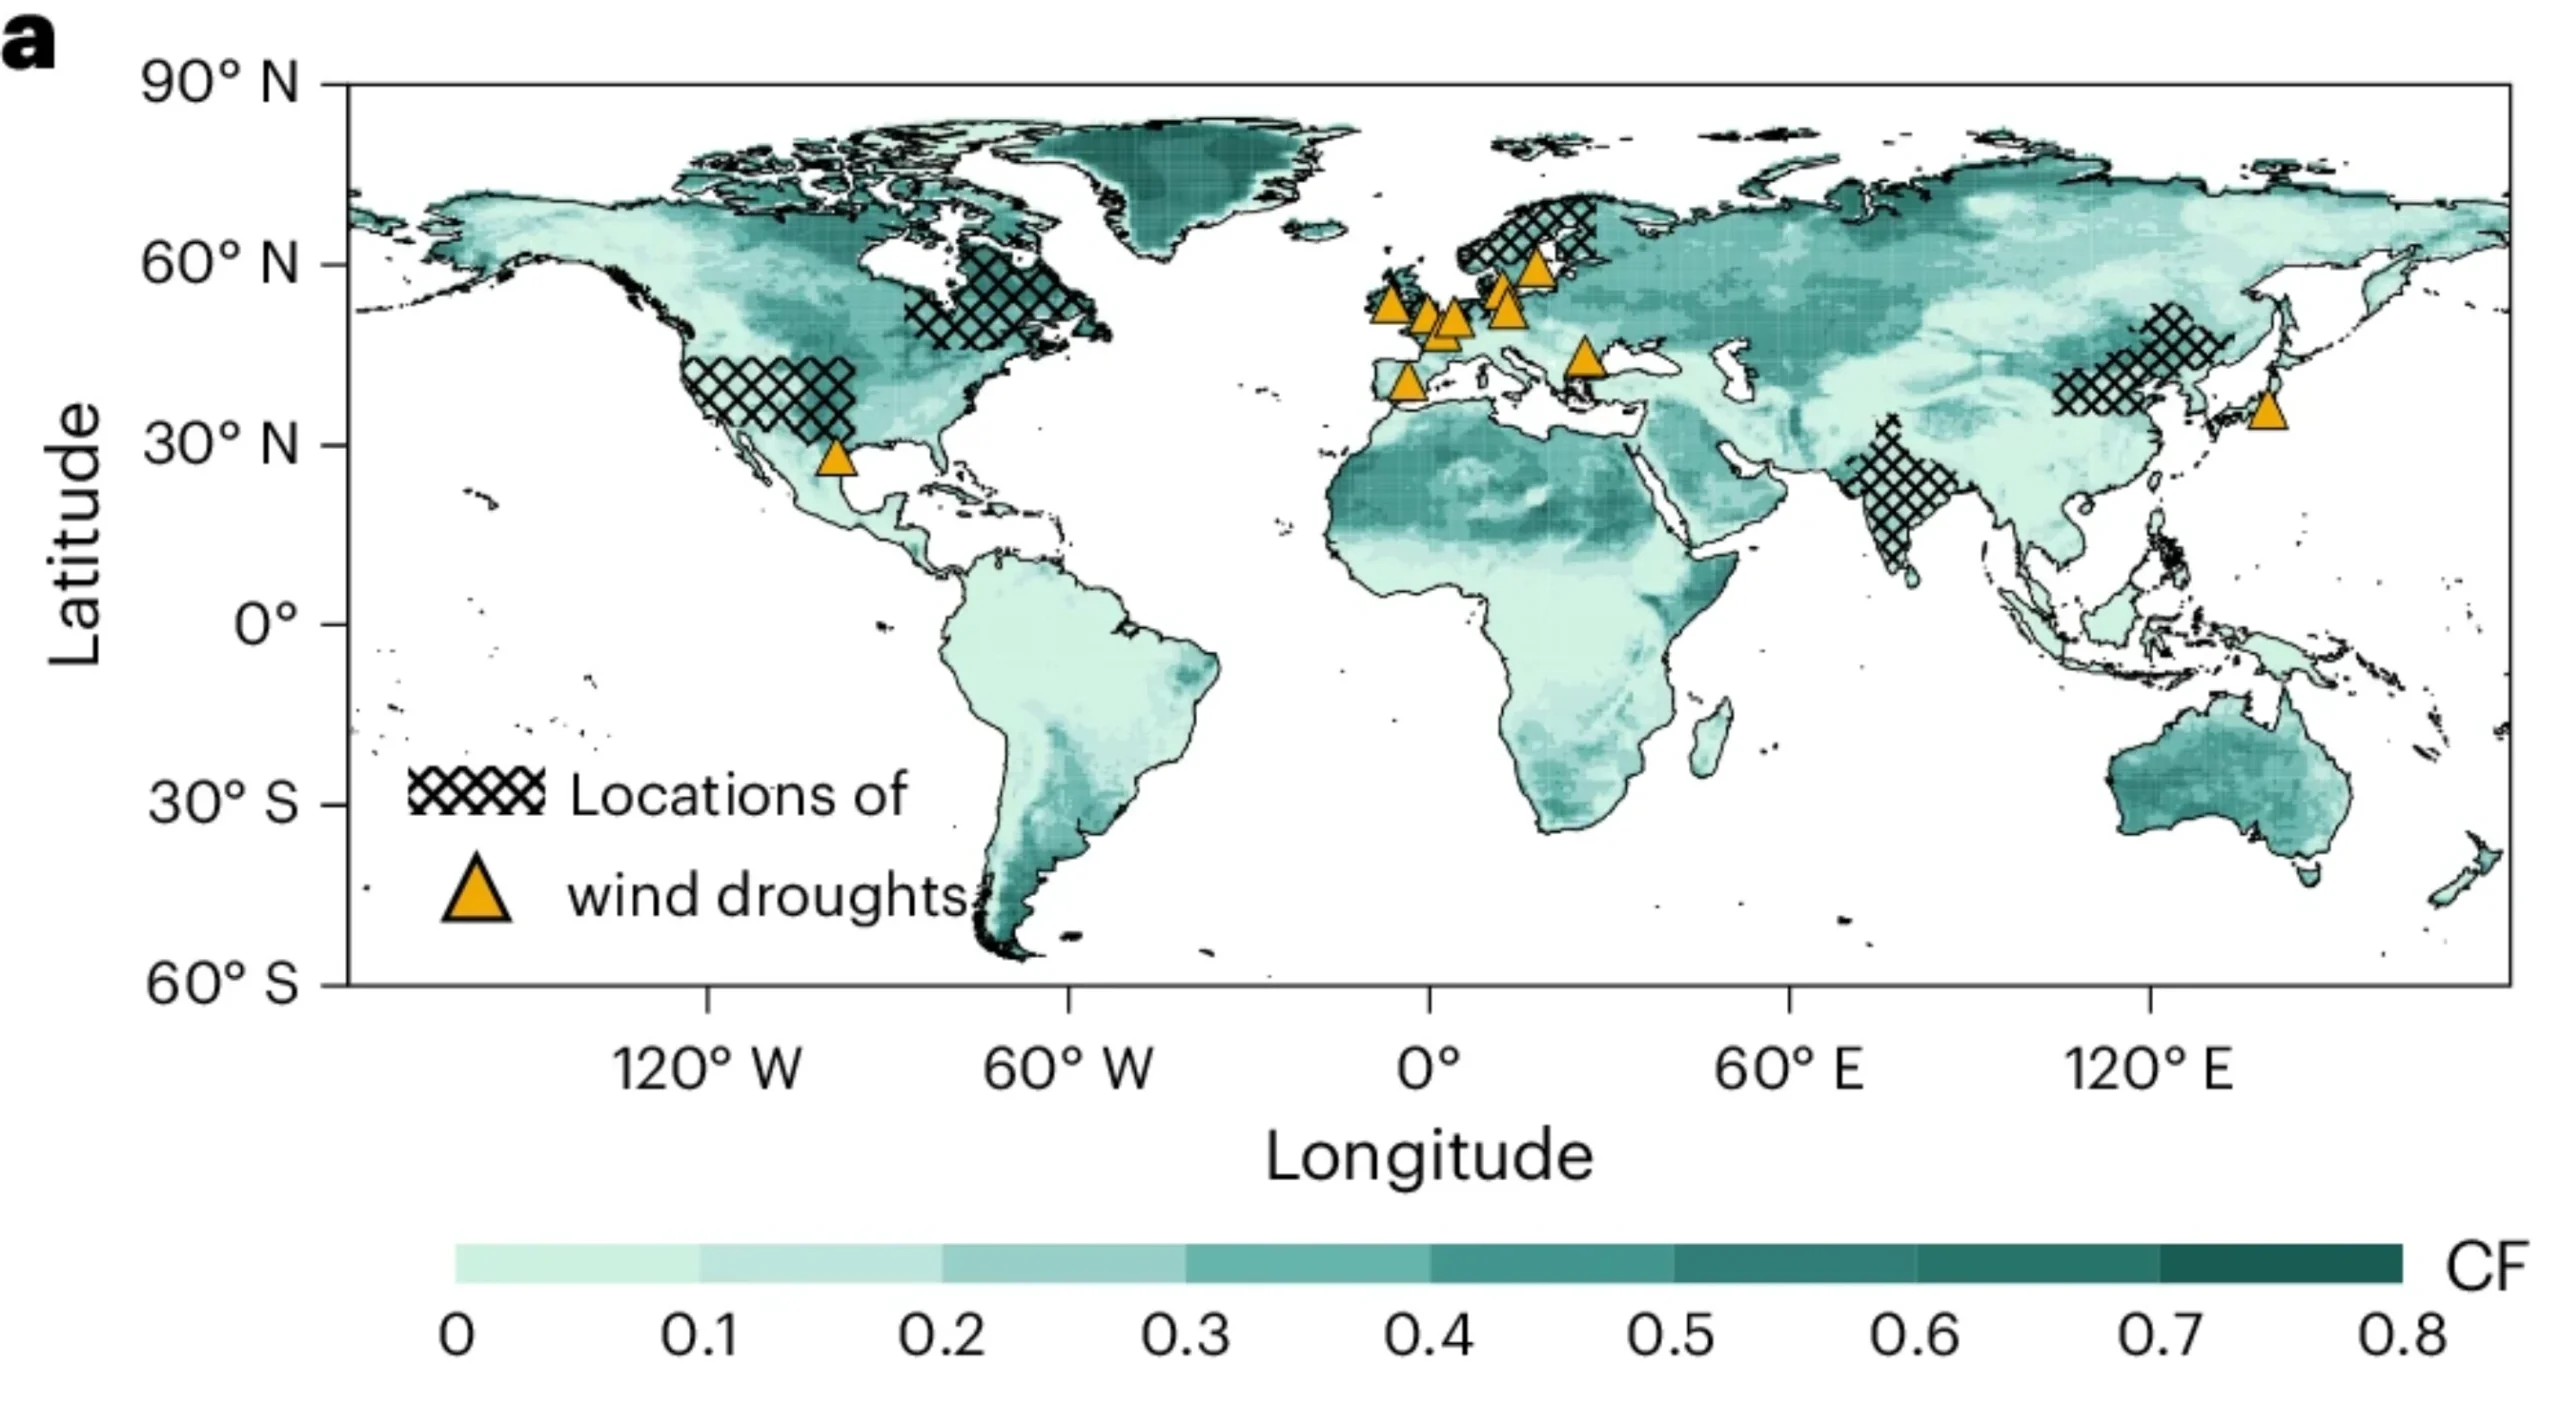
The map also shows that the darker shading for “abundant wind resources” is typically found in the mid-latitudes near “major storm tracks”, including the central US, northern Africa, northwestern Europe, northern Russia, northeastern China and Australia.
Modelling wind
To assess the severity of past and future wind droughts, the authors consider both the frequency and duration of these low-wind events.
To calculate wind drought duration, the authors use reanalysis data and models from the sixth Coupled Model Intercomparison Project (CMIP6) – the international modelling effort that feeds into the influential assessment reports from the Intergovernmental Panel on Climate Change (IPCC).
The authors then look at how wind drought conditions may change in the future, by modelling wind speeds over 2015-2100 under a range of future warming scenarios.
They find that wind drought frequency and duration will both increase in the northern hemisphere and mid-latitudes by the end of the century. The authors identify “particularly notable increases” in wind drought frequency in the US, northeastern China, Russia and much of Europe.
In the northern mid-latitudes, there will be a one-to-two hour increase in average wind drought duration by the end of the century under the moderate SSP2-4.5 scenario, according to the study. This is a 5-15% increase compared to today’s levels.
The authors also assess “extreme long-duration events” by looking at the longest-lasting wind drought that could happen once every 25 years.
The study projects roughly a 10%, 15% and 20% “elongation” in these long-duration wind droughts across “much of the northern mid-latitude regions” under the low, moderate and very high warming scenarios, by the end of the century.
However, the authors find “strong asymmetric changes” in their results, projecting a decrease in wind drought frequency and intensity in the southern hemisphere.
The authors suggest that the increase in wind droughts in the northern hemisphere is partly because of Arctic amplification – the phenomenon whereby the Arctic warms more quickly than the rest of the planet.
Accelerated warming in the Arctic narrows the temperature gap between the north pole and the equator and alters atmosphere-ocean interactions, which reduces wind speeds in the northern hemisphere.
Conversely, the authors suggest that increasing wind speeds in the southern hemisphere are caused by the land warming faster than the ocean, resulting in a greater difference in temperature between the land and the sea.
Record-breaking wind droughts
Finally, the authors also investigate the risk of “record-breaking wind droughts” – extreme events that would only be expected once every 1,000 years under the current climate.
They use CMIP6 models, based on historical data over 1980-2014, to assess how long-lasting such an event would be in different regions of the world. These results are shown on the map below, where darker brown indicates longer-duration wind droughts.
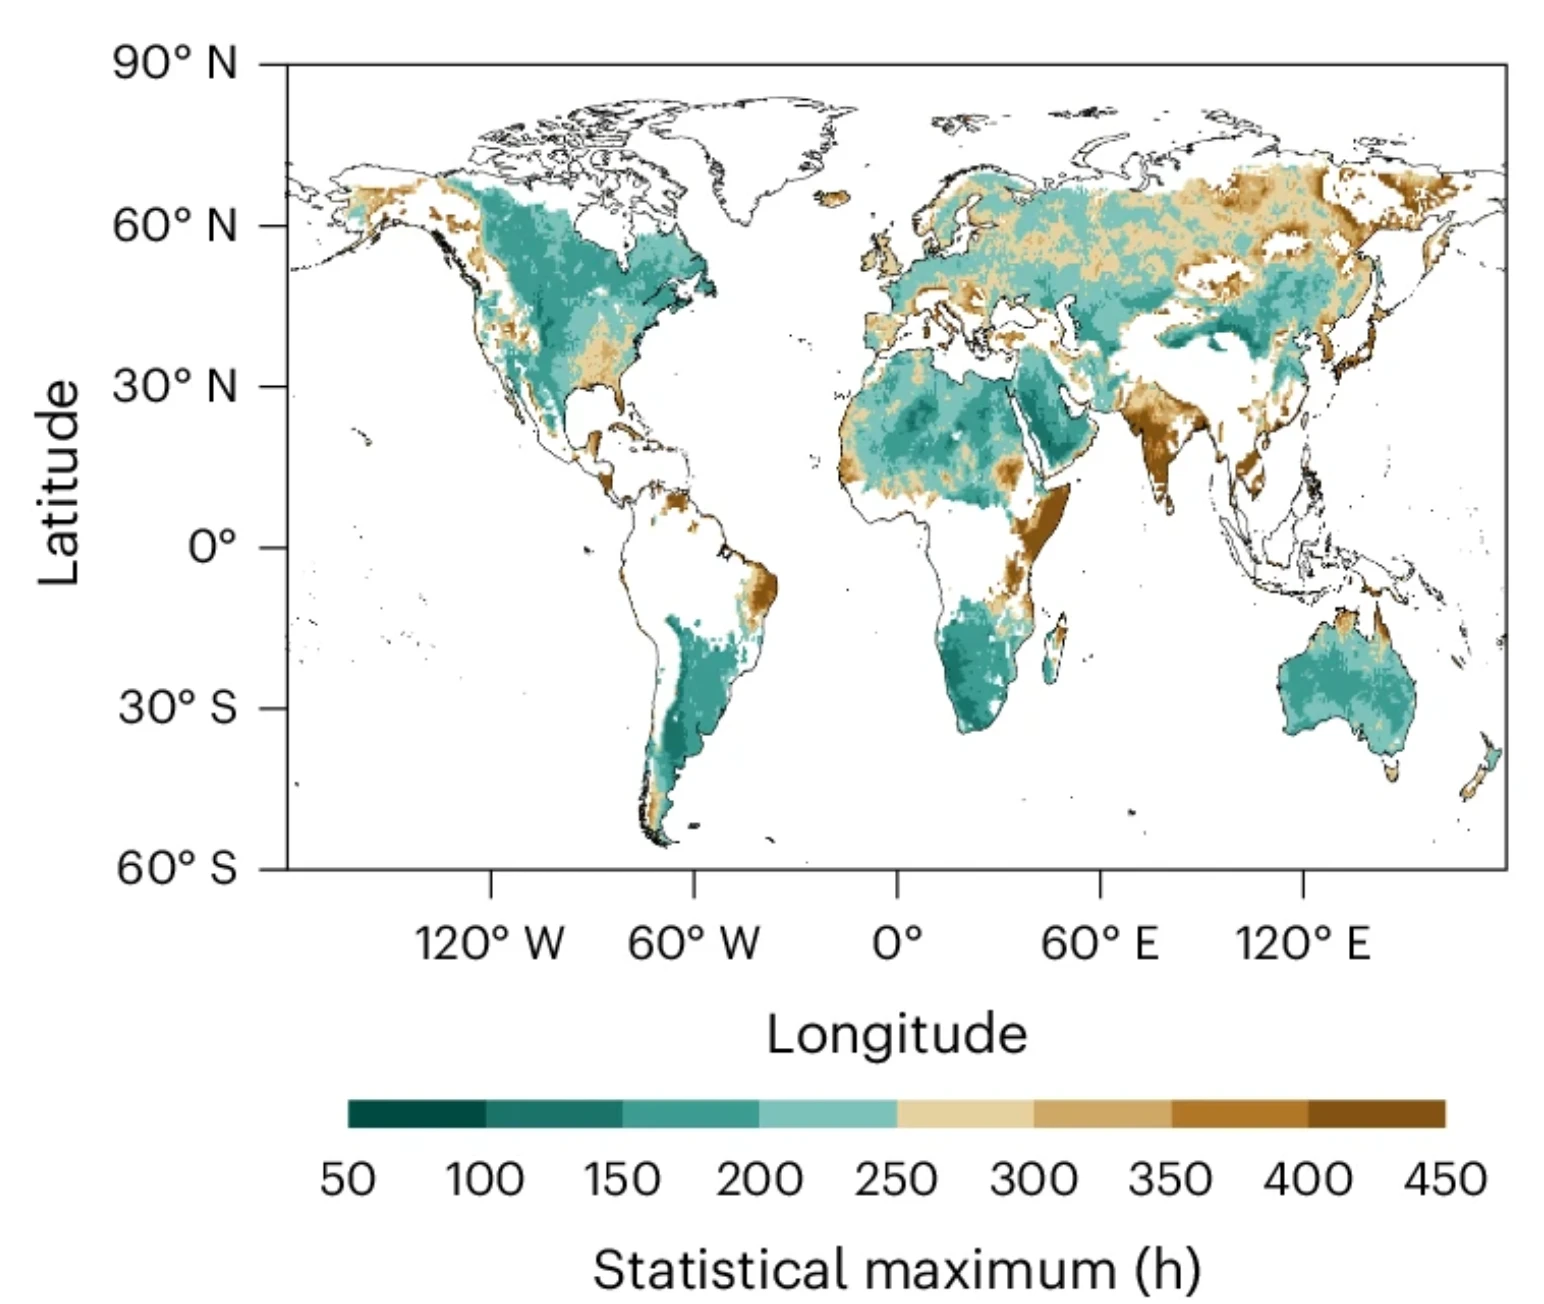
These 1,000-year record-breaking wind droughts typically last for 150-350 hours (6-15 days), occasionally reaching up to 400 hours in regions such as India, East Russia, east Africa and east Brazil, the paper says.
The authors go on to assess the risk of record-breaking wind droughts for existing wind turbines under different warming scenarios.
The plot below shows the fraction of the CMIP6 models used in this study that project record-breaking wind droughts for onshore wind turbines.
Blue bars show the percentage of wind turbines that face a “weak” risk of exposure, meaning that fewer than 25% of models predict that the turbine will be exposed to record-breaking wind droughts by the year 2100. Green bars indicate a “moderate” risk of 25-50% and brown bars denote “severe” risk of greater than 50%.
Each panel shows a different region of the world, with results for low (left) moderate (middle) and very high (right) warming scenarios.
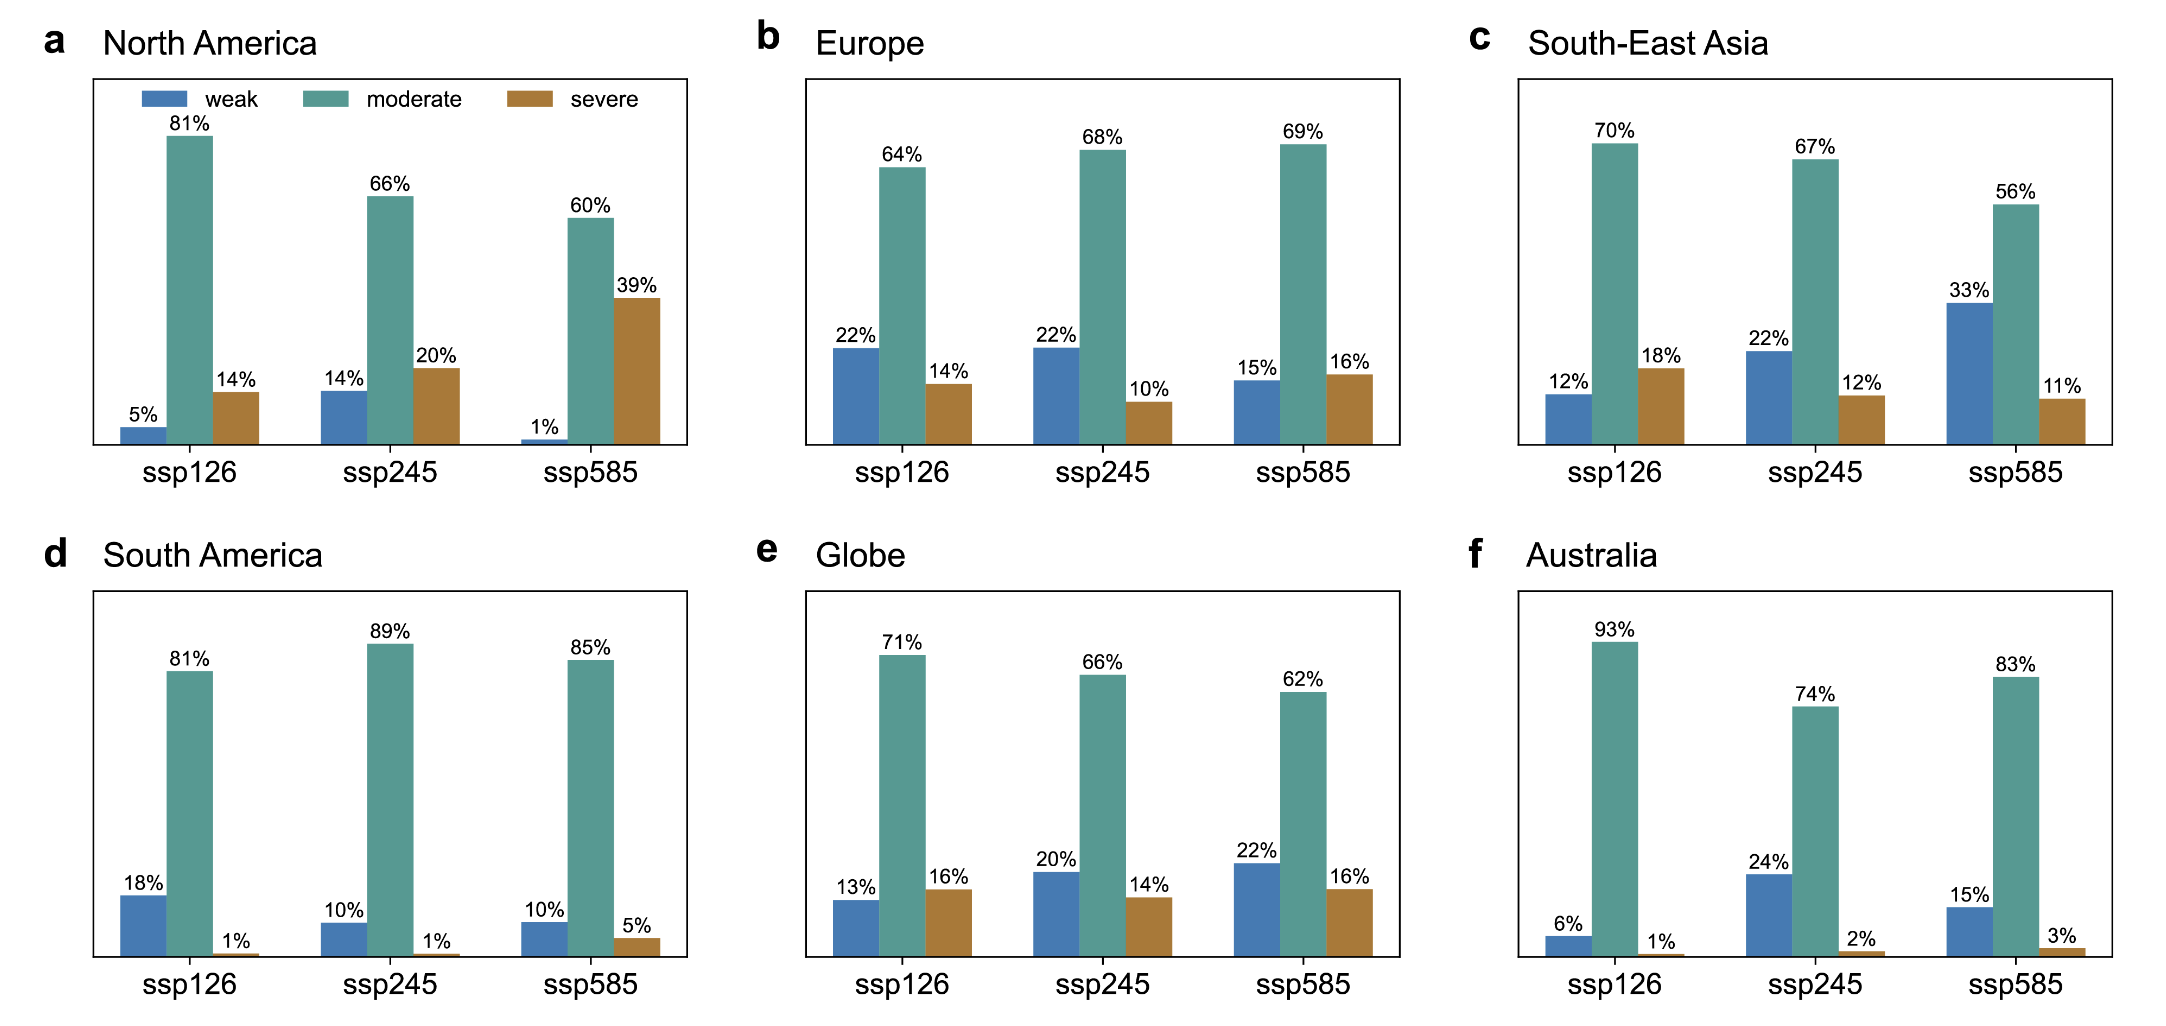
The study finds that, globally, around 15% of wind turbines will face “severe” risk from record-breaking wind droughts by the end of the century, regardless of the future warming scenario. However, different parts of the globe are expected to face different trends.
In North America, the percentage of turbines facing a “severe” risk from such extended wind droughts in the year 2100 rises from 14% in a low warming scenario to 39% in a very high warming scenario. Europe also faces a higher risk to its wind turbines under higher emissions scenarios.
However, the trends vary across the world. In south-east Asia, for example, the percentage of wind turbines at “severe” risk of the longest wind droughts drops from 18% under a low warming scenario to 11% under a very high warming scenario.
Energy security
The planet currently has 1,136GW of wind capacity. The authors say that, according to a report by the International Renewable Energy Agency, “wind power capacity is projected to grow substantially as the world pursues decarbonisation, aiming for 6,000GW by 2050”.
The paper sets out a number of ways that energy suppliers could reduce their exposure to record-breaking wind droughts.
The authors say that developers can avoid building new turbines in areas that are prone to frequent wind droughts. They add:
“Other effective mitigation measures include complementing wind power with other renewable energy sources, such as solar, hydro, nuclear power and energy storage.”
Staffell tells Carbon Brief the study provides helpful insights for how the world’s power supply could be made less vulnerable to prolonged low-wind events:
“I don’t see this study as spelling doom for the wind industry, instead it’s a navigation tool, telling us where to expect challenges in future so that we can counteract them.”
Staffell argues that there are “many solutions” for combatting wind droughts – including building the infrastructure to enable “more interconnection” between countries’ power grids.
For example, he says the UK could benefit from connecting its grid to Spain’s, noting that “wind droughts in the UK tend to coincide with [periods of] higher wind production in Spain”.
He adds:
“Increasing flexibility and diversity in power systems is a way to insure ourselves against extreme weather and cheaper than panic-buying gas whenever the wind drops.”
Similarly, Dr Enrico Antonini, a senior energy system modeller at Open Energy Transition, who was not involved in the study, tells Carbon Brief that wind droughts “do not necessarily threaten the viability of wind power”. He continues:
“Areas more exposed to these events can enhance their resilience by diversifying energy sources, strengthening grid connections over large distances and investing in energy storage solutions.”
In a news and views piece about the new study, Dr Sue Ellen Haupt, director of the weather systems assessment programme at the University of Colorado, praises the “robust” analysis.
She says the work “would ideally be accomplished with higher-resolution simulations that better resolve terrain, land-water boundaries and smaller-scale processes”, but acknowledges that “such datasets are not yet available on the global scale”.
Meanwhile, Dr Frank Kaspar is the head of hydrometeorology at Germany’s national meteorological service. He tells Carbon Brief how additions to this study could further help energy system planning in Germany.
Kaspar tells Carbon Brief it would be helpful to know how climate change will affect seasonal trends in wind drought, noting that in Germany, wind power “dominat[es] in winter” while solar plays a larger role in the energy mix in summer. [The UK sees a similar pattern.]
He adds that the study does not address offshore wind – a component of Germany’s energy mix that is “important” for the country.
The post Climate change could make ‘droughts’ for wind power 15% longer, study says appeared first on Carbon Brief.
Climate change could make ‘droughts’ for wind power 15% longer, study says
Greenhouse Gases
UNEP: New country climate plans ‘barely move needle’ on expected warming
The latest round of country climate plans ‘barely move the needle’ on future warming, the head of the UN Environment Programme (UNEP) has warned.
Executive director Inger Anderson made the comments as UNEP published its 16th annual assessment of the global “emissions gap”.
The report sets out the gap between where global emissions are headed – based on announced national policies and pledges – and what is needed to meet international temperature targets.
It finds that the latest round of national climate plans – which were due to the UN this year under Paris Agreement rules – will have a “limited effect” on narrowing this emissions gap.
Currently, the world is on track for 2.3-2.5C of warming this century if all national emissions-cutting plans out to 2035 are implemented in full, according to the report.
In a statement, UNEP executive director Inger Anderson said: “While national climate plans have delivered some progress, it is nowhere near fast enough.”
A decade on from the Paris Agreement, the UN agency credits the climate treaty for its “pivotal” role in lowering global temperature projections and driving a rise of renewable energy technologies, policies and targets.
Nevertheless, it warns that countries’ failure to cut emissions quickly enough means the world is “very likely” to breach the Paris Agreement’s aspirational 1.5C temperature limit “this decade”.
It urges countries to make any “overshoot” of the 1.5C warming target “temporary and minimal”, so as to reduce damages to people and ecosystems, as well as future reliance on “risky and costly” carbon removal methods.
Among the other key findings of the report are that China’s emissions could peak in 2025, while the impact of recent climate policy reversals in the US are likely to be outweighed by lower emissions in other countries in the coming years.
(See Carbon Brief’s detailed coverage of previous reports in 2014, 2015, 2016, 2017, 2018, 2019, 2020, 2021, 2022, 2023 and 2024.)
Greenhouse gas emissions continue to grow
The UNEP report finds that global emissions of greenhouse gases – carbon dioxide (CO2), methane, nitrous oxide and fluorinated gases (F-gases) – reached a record 57.7bn tonnes of CO2 equivalent (GtCO2e) in 2024. This marks a 2.3% increase compared to 2023 emissions.
This increase is “high” compared to the rise of 1.6% recorded between 2022 and 2023, the report says.
This rate of increase is more than four times higher than the average annual emissions growth rate throughout the 2010s, the report notes, and is comparable with the 2.2%-per-year rate seen in the 2000s.
The chart below shows total greenhouse gas emissions between 1990 and 2024.
It illustrates that “fossil CO2” (black), driven by the combustion of coal, oil and gas, is the largest contributor to annual emissions and the main driver of the increase in recent decades, accounting for around 69% of current emissions.
Methane (grey) plays the second largest role. Meanwhile, emissions from nitrous oxide (blue) fluoride gases (orange) and land use, land-use change and forestry (LULUCF, in green) make up 24% of total greenhouse gas emissions.
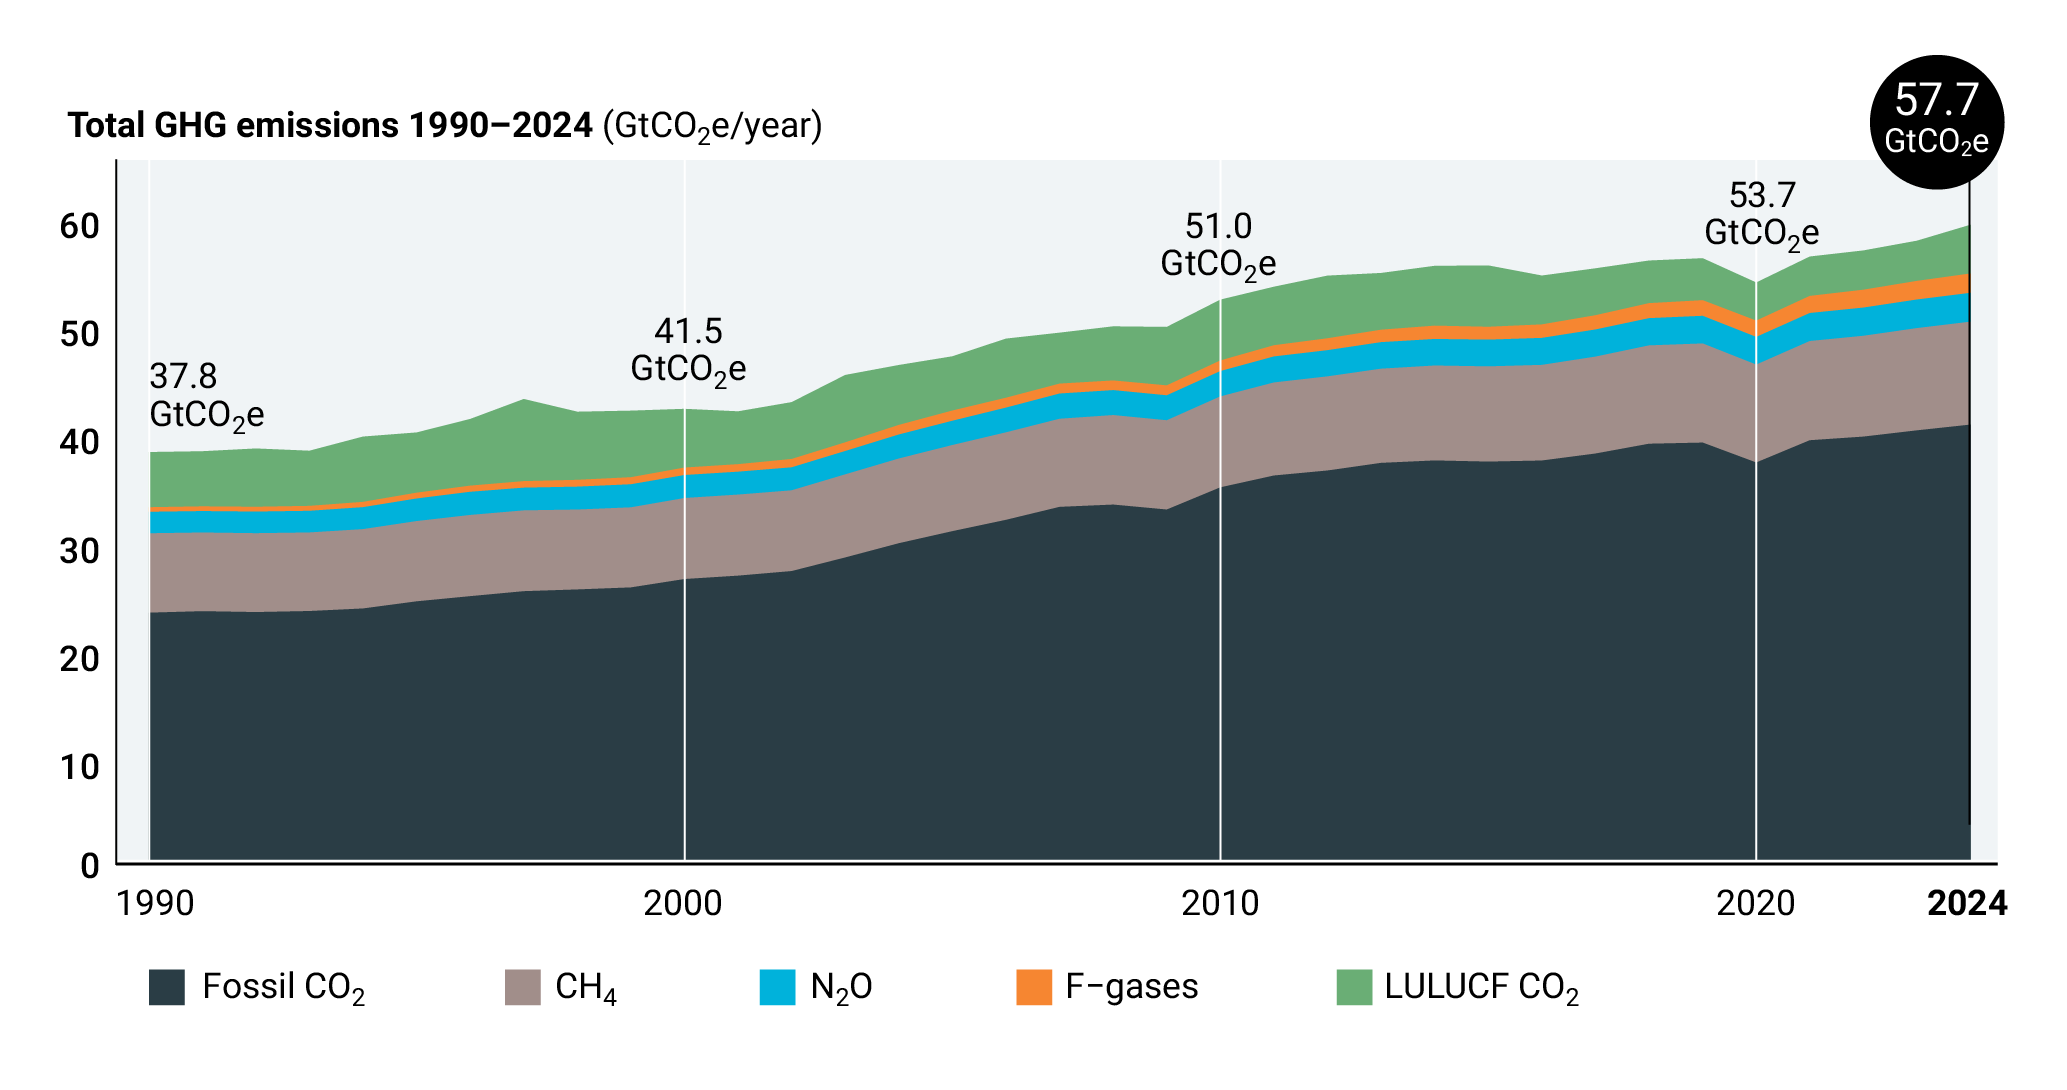
The report notes that all “all major sectors and categories” of greenhouse gas emissions saw an increase in 2024. For example, fossil CO2 emissions increased by 1.1% between 2023 and 2024.
However, it highlights that deforestation and land-use emissions played a “decisive” role in the overall increase last year. According to the report, net LULUCF CO2 emissions rose by a fifth – some 21% – between 2023 and 2024.
This spike is in contrast to the past decade, the report notes, where emissions from land-use change have “trended downwards”.
It says one of the reasons for the increase in LULUCF emissions over 2023-24 is the rise in emissions from tropical deforestation and degradation in South America, which were among the highest recorded since 1997.
The authors also break down changes in greenhouse gases by country or country group. They note that the six largest emitters in the world are China, the US, India, the EU, Russia and Indonesia.
The report finds that, when emissions from land use are excluded, emissions from the G20 countries accounted for 77% of the overall increase in emissions over 2023-24. Meanwhile, the “least developed countries” group contributed only 3% of the increase.
The graph below shows contributions to the change in greenhouse gas emissions between 2023 and 2024 for the five highest-emitting countries and groups, as well as for the rest of the G20 countries (purple), the rest of the world (grey), LULUCF globally (green) and international transport (dark blue).
The bottom horizontal black line shows the 56.2GtCO2e emitted in 2023. The size of each bar indicates the change in emissions between 2023 and 2024. The top horizontal black line shows the 57.7GtCO2e emitted in 2024.
The chart illustrates how India and China are the countries that recorded the largest individual increase in emissions between 2023 and 2024, while the EU is the only grouping where emissions decreased.
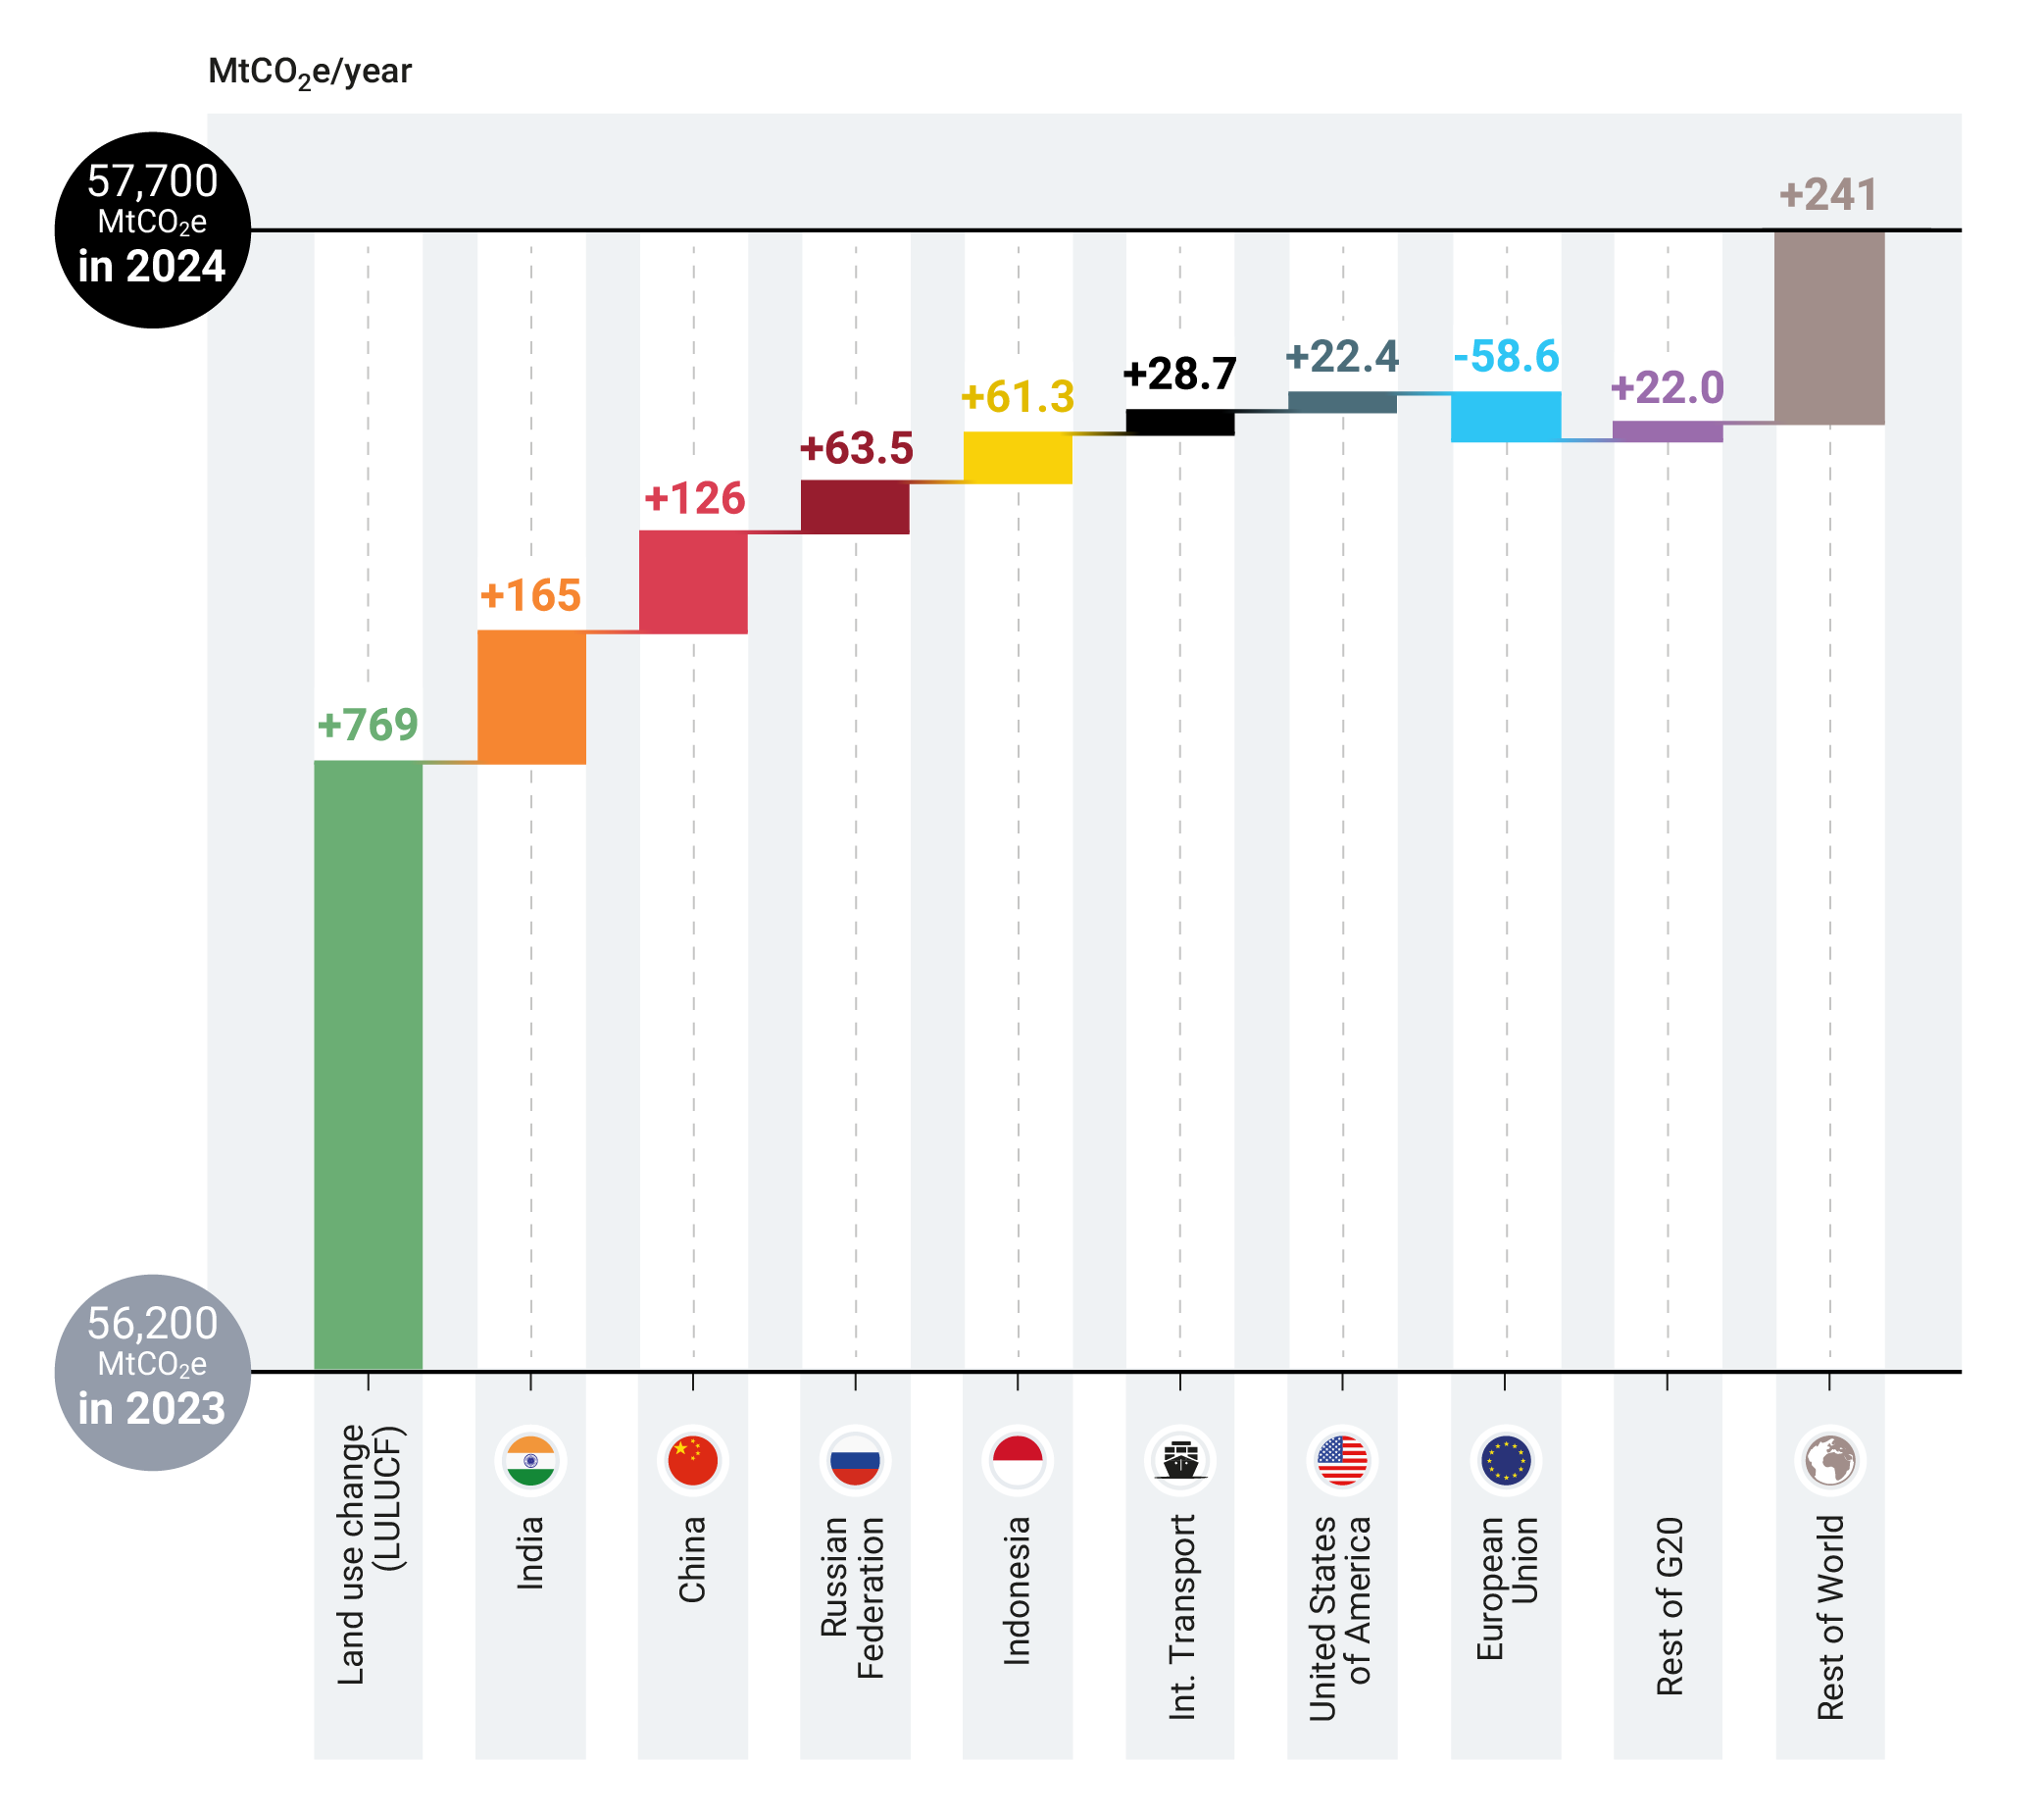
India and China recorded the largest absolute increase in emissions beyond the land sector. However, Indonesia saw the highest percentage increase of 4.6% (compared to 3.6% for India and 0.5% for China). In contrast, emissions from the EU decreased by 2.1%.
New national climate plans fall short
Under the terms of the Paris Agreement, countries are required to submit national climate plans, known as “nationally determined contributions” (NDCs), to the UN every five years. These documents describe each country’s plans to cut emissions and adapt to climate change.
The deadline for countries to submit NDCs for 2035 was February 2025.
(Carbon Brief reported earlier this year that 95% of countries had missed the February deadline and, more recently, that just one-third of new plans submitted by the end of September expressed support for “transitioning away” from fossil fuels.)
By September 2025, 64 parties had submitted or announced their new NDCs. UNEP says that 60 of these countries accounted for 63% of global emissions. Meanwhile, only 13 countries, accounting for less than 1% of global emissions, had updated their emissions reduction targets for 2030.
Writing in the foreword to the report, UNEP’s Inger Andersen says that “many hoped [the pledges] would demonstrate a step change in ambition and action to lower greenhouse gas emissions and avoid an intensification of the climate crisis that is hammering people and economies”. However, she adds that “this ambition and action did not materialise”.
The report emphasises that “immediate and stringent emissions reductions” are the “fundamental ingredient” for meeting the Paris temperature goal of keeping warming this century to well-below 2C and making efforts to keep it to 1.5C.
However, it adds that the new NDCs and “current geopolitical situation” do not provide “promising signs” that these emissions cuts will happen.
The report presents a “deep dive” into the emissions reduction targets of G20 countries – the world’s largest economies, which are collectively responsible for more than three-quarters of global emissions.
The analysis investigates NDCs and policy updates as of November 2024.
None of the G20 countries have strengthened their targets for 2030, according to the report. However, it finds that seven G20 countries have submitted NDCs with emissions reduction targets for 2035. The EU, China and Turkey have announced targets, but had not yet submitted 2035 climate plans to the UN by the time the report was finalised.
According to the report, the new NDCs and policy updates of G20 countries lead to a reduction in projected emissions by 2035. However, these reductions are “relatively small and surrounded by significant uncertainty”, it cautions.
Nevertheless, UNEP says there are a number of G20 countries whose emissions projections have seen “significant changes” in this year’s report, including the US and China.
For the first time, the projections in the gap report suggest that China will see its emissions peak in 2025, followed by a reduction in emissions of 0.3-1.4GtCO2e by 2030. According to the report, this is due to the growth of renewable electricity generation in the country “outpacing” overall power demand growth.
In contrast, the authors warn that projections for US emissions in 2030 have increased by 1GtCO2e compared to last year’s assessment, mainly due to “policy reversals”.
(Since taking office in January 2025, Donald Trump has triggered the process of withdrawing the US from the Paris Agreement for the second time and dismantled US climate policies implemented under Joe Biden. The UNEP report does not specifically mention Trump or his administration.)
However, it finds that lower greenhouse gas projections for China and several other countries outweigh the higher projections in the US by 2030.
Overall, the report projects that, under current climate policies, annual emissions from G20 countries will drop to 35GtCO2 by 2030 and 33Gt by 2035.
China is the largest contributor to this projected reduction, followed by the EU then the US, according to the report. (Emissions from the US are still projected to decline, albeit much more slowly than previously expected.)
It adds that other G20 members are on “clear downward emission trends”, noting that “several more” might see emissions “peak or plateau between 2030 and 2035” under current policies.
The graph below shows the historical emissions (light blue) and projected emissions (dark blue) of the G20 members, along with their NDCs for 2030 and 2035 (shown by the diamonds) and net-zero targets (circles).
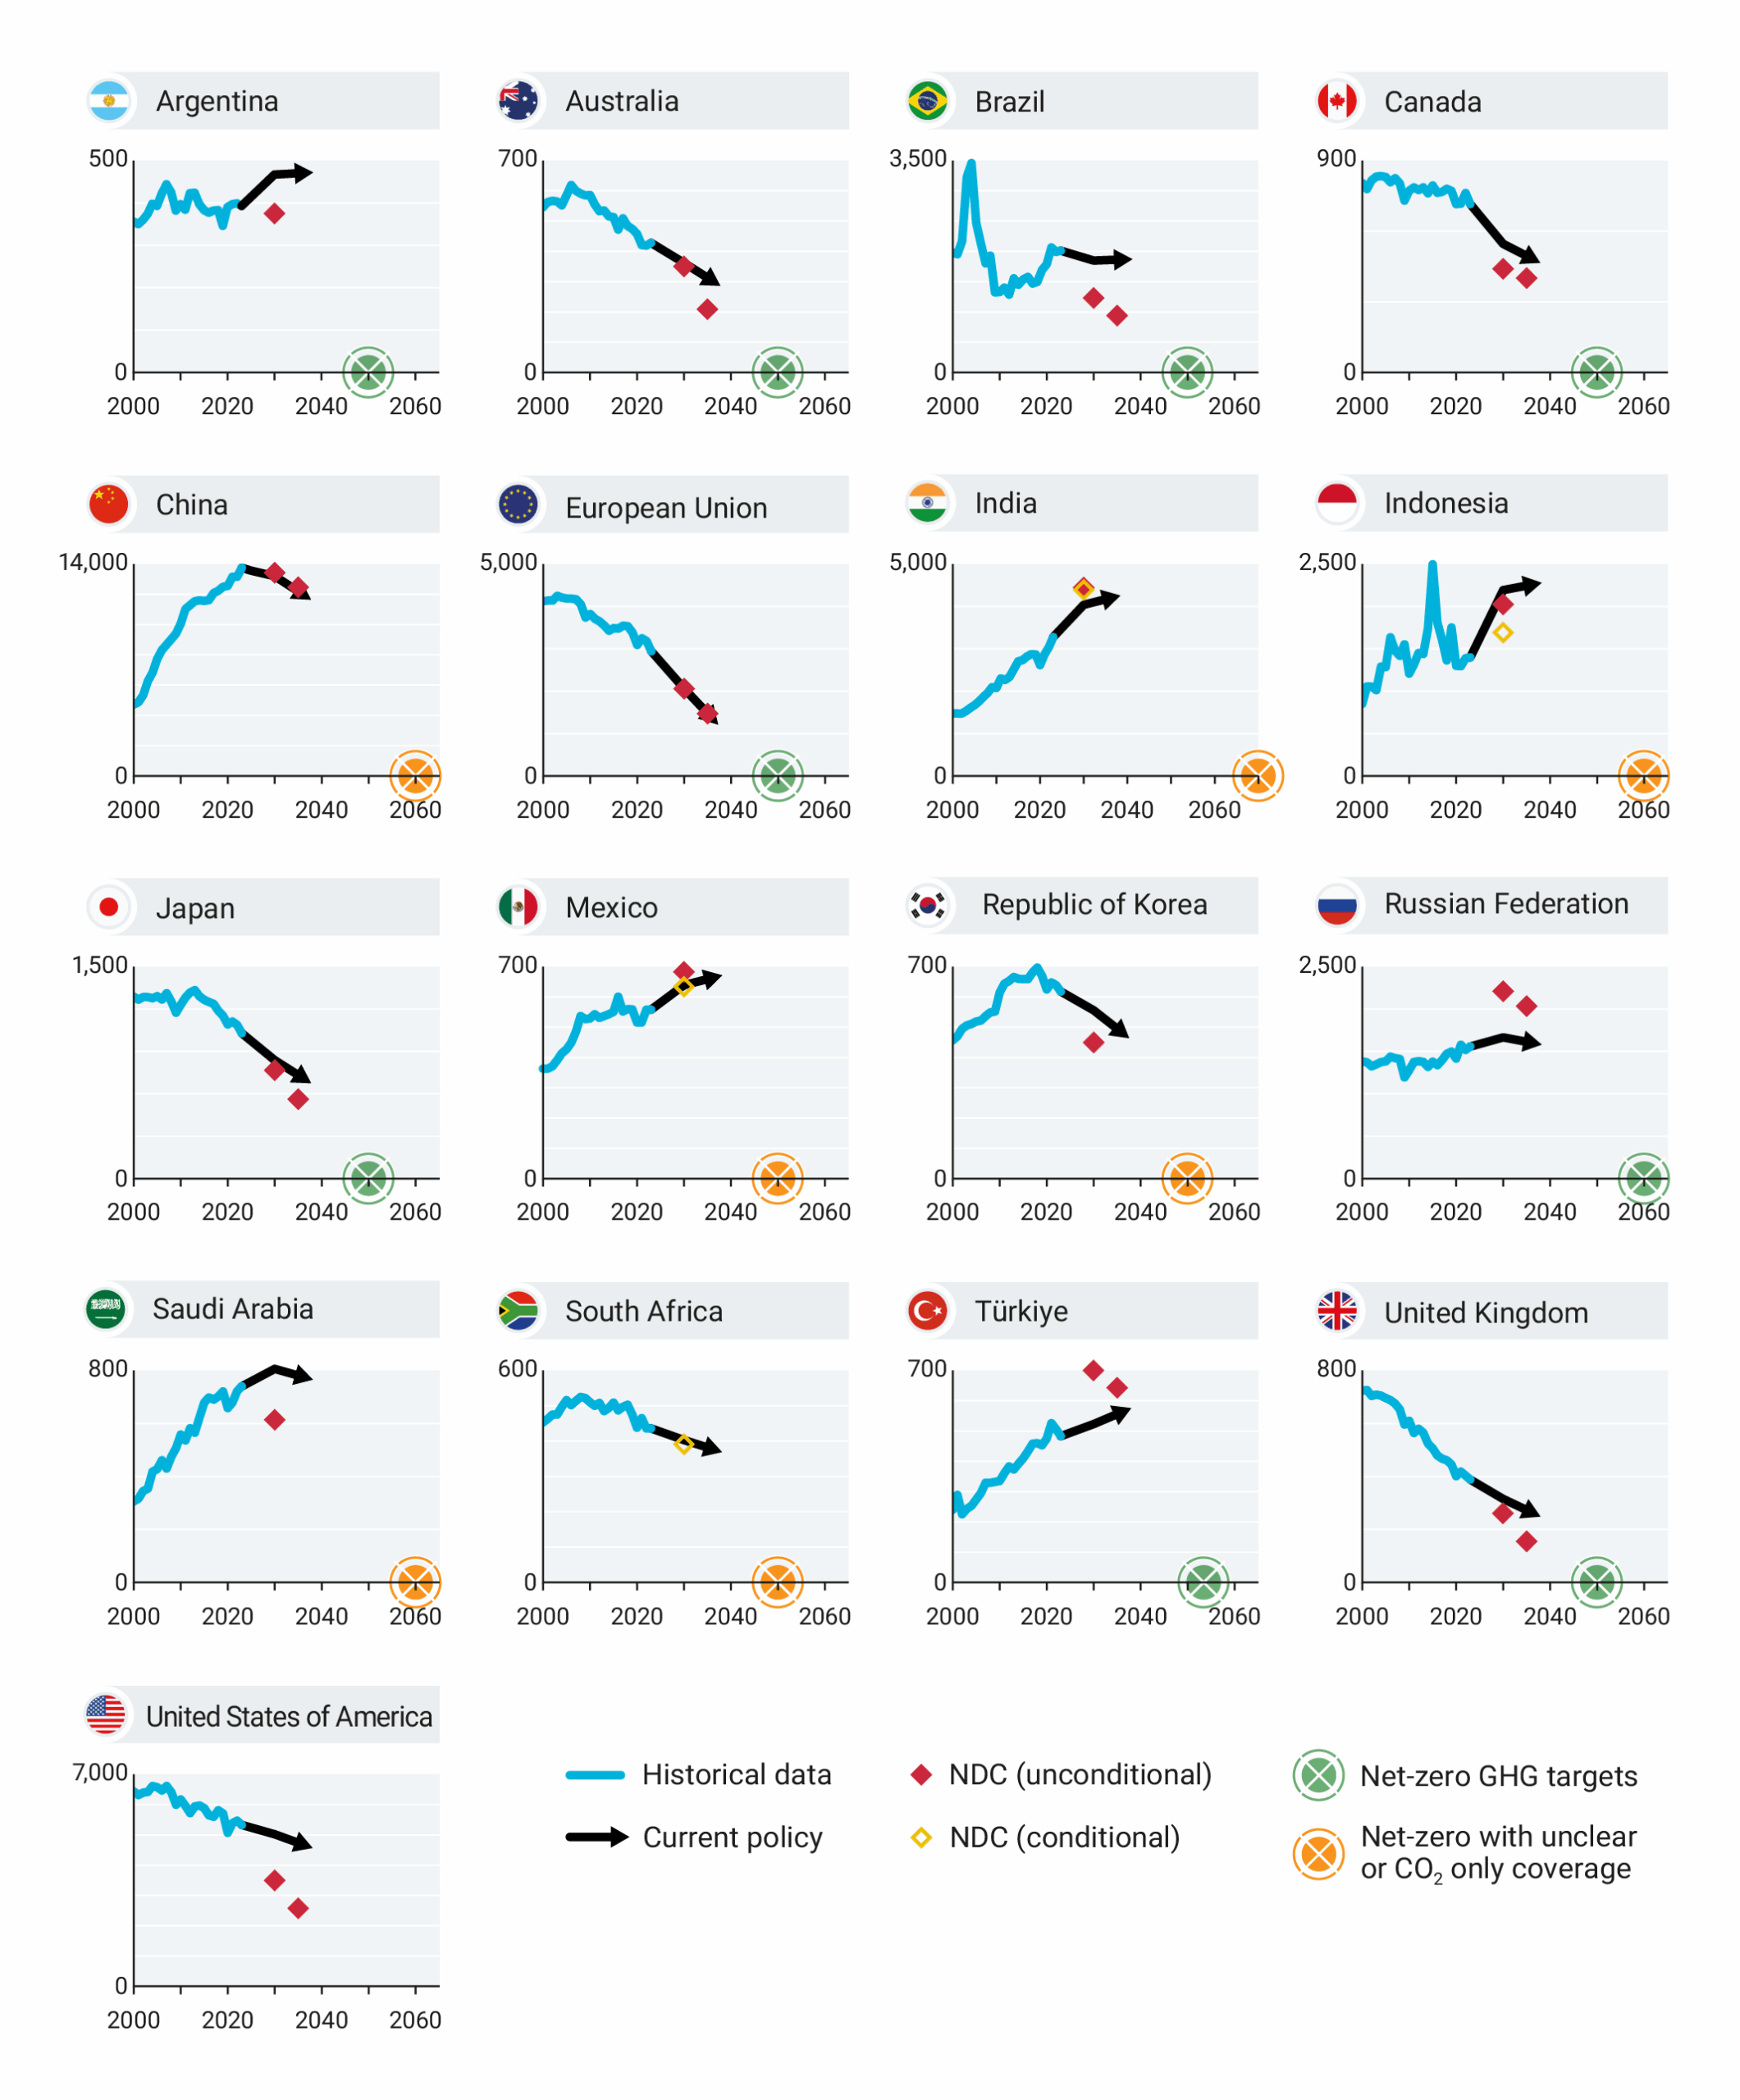
The graph shows that some countries, such as Turkey and Russia, are projected to cut emissions more rapidly than they have pledged under their NDCs. In contrast, other nations, such as the UK and Canada, are anticipated to fall short of the emissions-reduction goals set out in their national climate plans.
New NDCs and policy updates lower expected emissions in 2035
The report conducts an “emissions gap” analysis that compares the emissions that would be released if countries follow their climate policies or pledges, with the levels that would be needed in order to hold warming below 2C, 1.8C and 1.5C with limited or no overshoot.
The “gap” between these two values shows how much further emissions would need to be reduced in order to limit warming below global temperature thresholds.
To explore potential rises in global temperature over the coming years and decades, the report authors use a simple climate model, or “emulator”, called FaIR. They assess a range of potential futures:
- A “current policy” scenario, which assumes that countries follow policies adopted as of November 2024. This scenario also assumes the full implementation of announced policy rollbacks in the US as of September 2025.
- An “unconditional NDCs” scenario, which assumes the implementation of NDCs that do not depend on external support. This scenario includes the US NDC, as withdrawal from the Paris Agreement will not be complete until January 2026.
- A “conditional NDCs” scenario that further assumes the implementation of NDCs that depend on external support, such as climate finance from wealthier countries.
The report also analyses two “scenario extensions”, which explore the post-2035 implications of current policies, NDCs and net-zero pledges:
- A “current policies continuing” scenario, which “follows current policies to 2035 and assumes a continuation of similar efforts thereafter”.
- A “conditional NDCs plus all net-zero pledges” scenario, which is “the most optimistic scenario included”. This scenario assumes the “conditional NDC” scenario is achieved until 2035 and then all net-zero or other long-term low emissions developments strategies are followed thereafter, excluding that of the US.
The authors note that emissions projections for 2030 under the “current policy” scenario in this year’s report are slightly larger than they were in last year’s assessment. The authors say this is “mainly” due to policy rollbacks in the US.
In contrast, this report projects slightly lower emissions for 2035 than last year’s report, as policy changes in the US are offset by “improved 2035 policy estimates” in other countries.
The authors find that the new NDCs have “no effect” on the 2030 gap when compared to last year’s assessment.
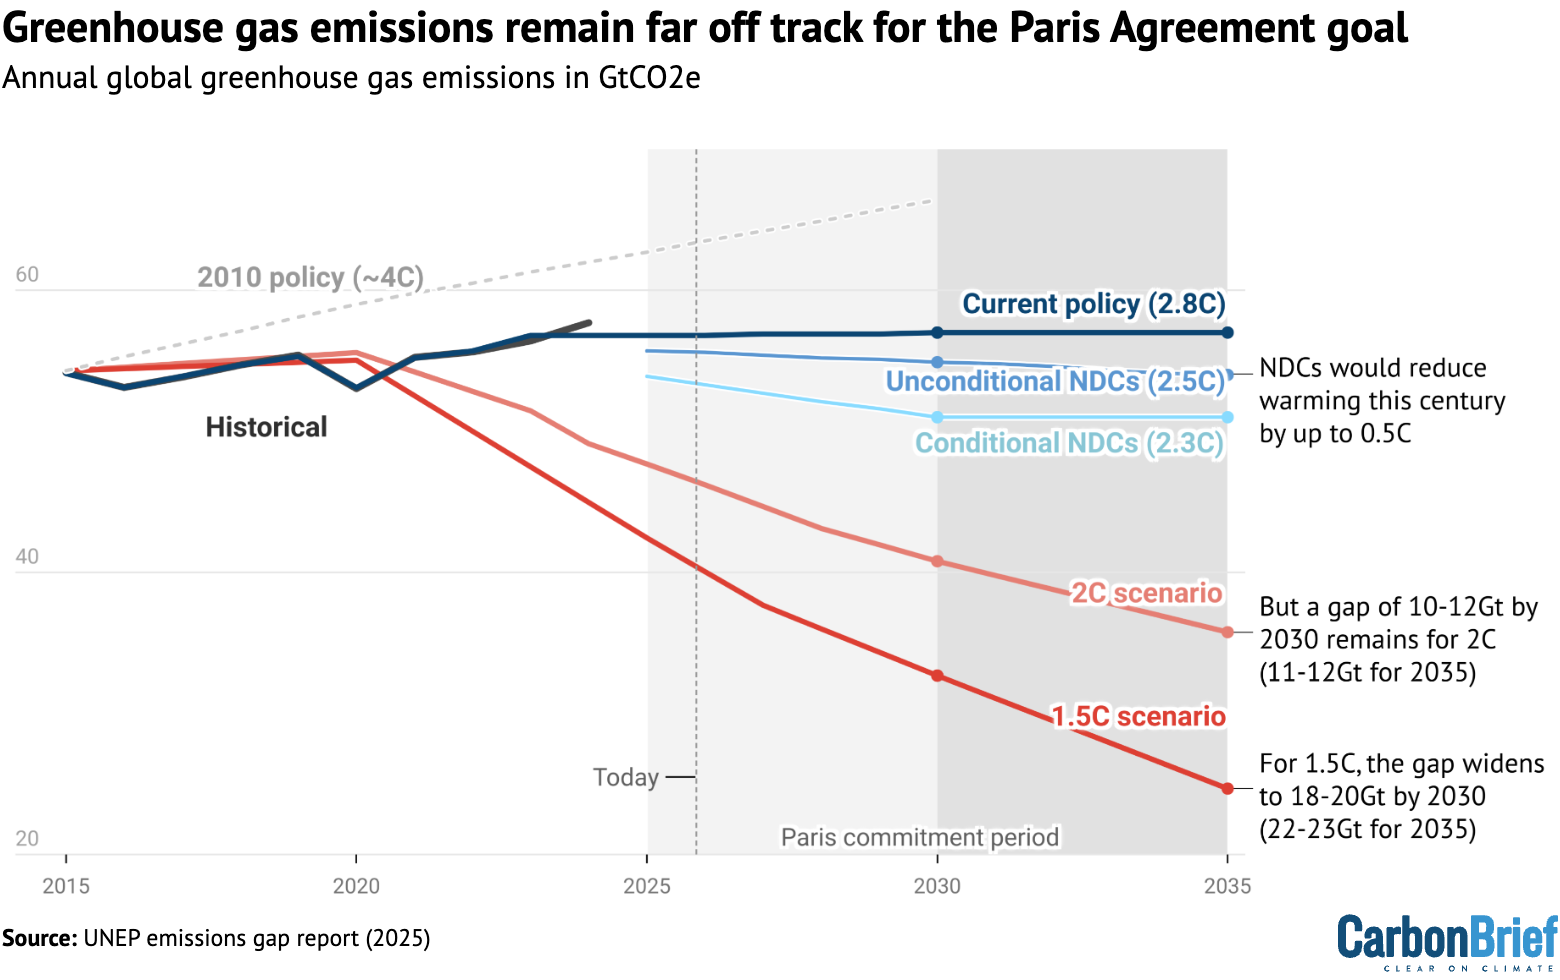
According to the report, implementing unconditional NDCs would result in emissions in 2030 being 12GtCO2e above the level required to limit warming to 2C. This number rises to 20GtCO2e for a 1.5C scenario.
Also implementing conditional NDCs would shrink these gaps by around 2GtCO2e, the report says.
(The authors note that these numbers are slightly smaller than in last year’s report, but say this is not a reflection of “strengthening of 2030 NDC targets”, but instead from “updated emission trends by modelling groups and methodological updates”.)
The report adds that the formal withdrawal of the US from the Paris Agreement for a second time will mean that emissions laid out in the US NDC are not counted. This will increase the emissions gap by 2GtCO2e, the report says.
According to the report, the new NDCs do narrow the 2035 emissions gap compared to last year’s assessment. The report says:
“The unconditional and conditional NDC gaps with respect to 2C and 1.5C pathways are 6bn and 4bn tonnes of CO2e lower than last year, respectively.”
This means that the “emissions gap” between a world that follows conditional NDCs and one that limits warming to 2C above pre-industrial temperatures is 6GtCO2e smaller in this year’s report than last year’s. Similarly, the gap between the “conditional NDCs” scenario and the 1.5C scenario is now 4GtCO2e smaller.
Despite the improvement, the report warns that the emissions gap “remains large”.
The graph below shows historical and projected global emissions over 2015-35 under the current policy (dark blue), unconditional NDCs (mid blue), conditional NDCs (light blue), 2C (pink) and 1.5C (red) scenarios.
The report also warns that there is an “implementation gap”, as countries are currently not on track to achieve their NDC targets.
The authors say the implementation gap is currently 5GtCO2e for unconditional NDCs by 2030 and 7GtCO2e for conditional NDCs, or around 2GtCO2e lower once the US withdrawal from the Paris Agreement is complete next year.
‘Limited’ progress on reducing future warming
UNEP calculates that the full implementation of both conditional and unconditional NDCs would reduce emissions in 2035 by 12% and 15%, respectively, on 2019 levels. However, these percentages shrink to 9% and 11% if the US NDC is discounted.
The projections suggest there will be a “peak and decline” in global emissions. However, the report says the large range of estimates that remain around global emissions reductions means there is “continued uncertainty” around when peaking could happen.
Projected emissions cuts by 2035 are “far smaller” than the 35% reduction required to align with a 2C pathway and the even steeper cut of 55% required for a 1.5C pathway, the report says.
The authors say that temperature projections set out in this year’s report are only “slightly lower” – at 0.3C – than last year’s assessment.
It notes that new policy projections and NDC targets announced since the last assessment have lowered warming projections by 0.2C. “Methodological updates” are responsible for the remaining 0.1C.
Furthermore, the forthcoming withdrawal of the US from the Paris Agreement would reverse 0.1C of this “limited progress”, the report notes.
Responding to these figures in the report’s foreword, UNEP’s Anderson says the new pledges have “barely moved the needle” on temperature projections.
The chart below shows the different warming projections under four of the scenarios explored in the report.
It shows how, under the current policies pathway, there is a 66% chance of warming being limited to 2.8C. In a scenario where efforts are made to meet conditional NDCs in full, there is the same probability that warming could be capped at 2.3C.
In the most optimistic scenario – where all NDCs and net-zero targets are implemented – there is a 66% chance that warming could be constrained to 1.9C. (This projection remains unchanged since last year’s report.)
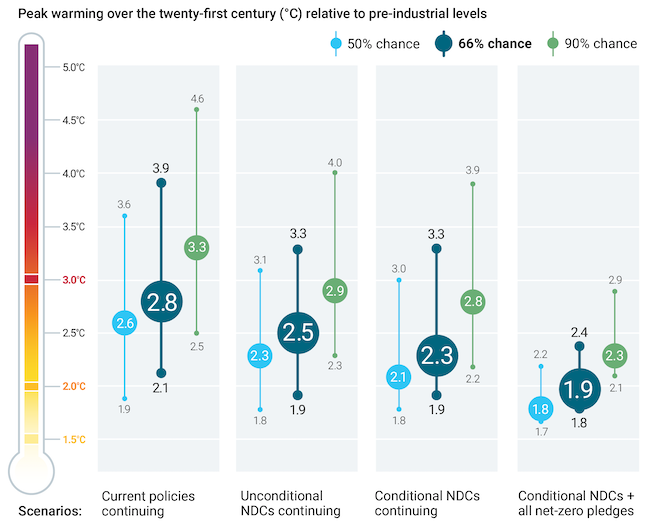
The report warns that, across all scenarios, the central warming projections would see global warming surpass 1.5C “by several tenths of a degree” by mid-century. And it calculates there is a 21-33% likelihood that warming could exceed 2C by 2050.
Nevertheless, it stresses that the Paris Agreement has been “pivotal” in reducing temperature projections. Policies at the time of the treaty’s adoption would have put the world on track for warming “just below 4C”.
1.5C limit could be exceeded within a decade
UNEP notes that its updated temperature projections underscore an “uncomfortable truth” that surpassing the Paris Agreement’s 1.5C warming limit is “increasingly near”.
The limit – which refers to long-term warming over a pre-industrial baseline and not average warming in any particular year – could be exceeded “within the next decade”, it says. However, the report emphasises that it remains “technically possible” to return to 1.5C by 2100.
Global inaction on emissions in the 2020s means that 1.5C pathways explored in previous emission gap reports and Intergovernmental Panel on Climate Change’s sixth assessment cycle are “no longer fully achievable”, according to UNEP.
Moreover, a lack of “stringent emissions cuts” in recent years means climate pathways with “limited” overshoot of 1.5C are also “slipping out of reach”, the authors say.
A future of “higher and potentially longer” overshoot of 1.5C is “increasingly likely”, they warn.
Climate “overshoot” pathways are those where temperatures exceed 1.5C temporarily, before being brought back below the threshold using techniques that remove carbon from the atmosphere.
(For more on climate overshoot, read Carbon Brief’s detailed write-up of a recent conference dedicated to the concept.)
Elsewhere, the report notes the remaining “carbon budget” for limiting warming to 1.5C without any overshoot of the goal will “likely be exhausted” before 2030.
(The carbon budget is the total amount of CO2 that scientists estimate can be emitted if warming is to be kept below a particular temperature threshold. Earlier this year, the Indicators of Global Climate Change report estimated the remaining carbon budget had declined by three-quarters between the start of 2020 and the start of 2025.)
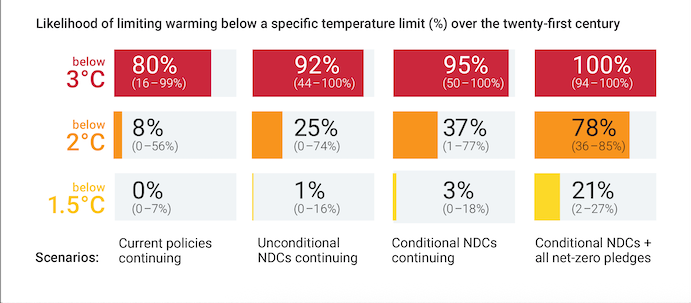
The graphic below illustrates the percentage likelihood of limiting warming under 1.5C, 2C and 3C under the four scenarios set out in the report.
It shows how the chances of limiting warming to below 1.5C throughout the 21st century is close to zero in all but the most optimistic scenario. In the scenario where conditional NDCs and net-zero pledges are met, the chances of limiting temperatures below the goal is just 21%.
The report stresses that it is critical to limit “magnitude and duration” of overshoot to avoid “greater losses for people and ecosystems”, higher adaptation costs and a heavier reliance on “costly and uncertain carbon dioxide removal”.
Roughly 220GtCO2 of carbon removals will be required to reverse every 0.1C of overshoot, according to the report. This is equivalent to five years of global annual CO2 emissions.
The report also warns that it is “highly unlikely” that all risks and hazards will “reverse proportionately” after a period of temperature overshoot.
UNEP states that pursuing the 1.5C temperature goal is nevertheless a “legal, moral and political obligation” for governments regardless of whether warming exceeds the target.
The UN agency emphasises that the 2015 Paris Agreement establishes “no target date or expiration” for its temperature goal – and points to the International Court of Justice’s recent advisory opinion that 1.5C remains the “primary target” of the climate treaty.
The post UNEP: New country climate plans ‘barely move needle’ on expected warming appeared first on Carbon Brief.
UNEP: New country climate plans ‘barely move needle’ on expected warming
Greenhouse Gases
Q&A: COP30 could – finally – agree how to track the ‘global goal on adaptation’
Nearly a decade on from the Paris Agreement, there is still not an agreed way to measure progress towards its “global goal on adaptation” (GGA).
Yet climate impacts are increasingly being felt around the world, with the weather becoming more extreme and the risk to vulnerable populations growing.
At COP30, which takes place next month, negotiators are set to finalise a list of indicators that can be used to measure progress towards the GGA.
This is expected to be one of the most significant negotiated outcomes from the UN climate summit in Belém, Brazil.
In a series of open letters running up to the summit, COP30 president-designate André Corrêa do Lago wrote that adaptation was “no longer a choice” and that countries needed to seize a “window of opportunity”:
“There is a window of opportunity to define a robust framework to track collective progress on adaptation. This milestone will…lay the groundwork for the future of the adaptation agenda.”
However, progress on producing an agreed list of indicators has been difficult, with nearly 90 experts working over two years to narrow down a list of almost 10,000 potential indicators to a final set of just 100, which is supposed to be adopted at COP30.
Below, Carbon Brief explores what the GGA is, why progress on adaptation has been so challenging and what a successful outcome would look like in Belém.
What is the GGA?
The GGA was signed into being within the Paris Agreement in 2015, but the treaty included limited detail on exactly what the goal would look like, how it would be achieved and how progress would be tracked.
The need to adapt to climate change has long been established, with the UN Framework Convention on Climate Change, adopted in 1992, noting that parties “shall…cooperate in preparing for adaptation to the impacts of climate change”.
In the subsequent years, the issue received limited focus, however. Then, in 2013, the African Group of Negotiators put forward a proposed GGA, setting out a target for adaptation.
This was then formally established under article 7.1 of the Paris text two years later. The text of the treaty says that the GGA is to “enhanc[e] adaptive capacity, strengthen…resilience and reduc[e] vulnerability to climate change”.

According to the World Resources Institute (WRI), the GGA was designed to set “specific, measurable targets and guidelines for global adaptation action, as well as enhancing adaptation finance and other types of support for developing countries”.
However, unlike the goal to cut emissions – established in article 4 of the Paris Agreement – measuring progress on adaptation is “inherently challenging”.
Emilie Beauchamp, lead for monitoring, evaluation and learning (MEL) for adaptation at the International Institute for Sustainable Development (IISD), tells Carbon Brief that this challenge relates to the context-specific nature of what adaptation means. She says:
“The main [reason] it’s hard to measure progress on adaptation is because adaptation is very contextual, and so resilience and adapting mean different things to different people, and different things in different places. So it’s not always easy to quantify or qualify…You need to integrate really different dimensions and different lived experiences when you assess progress on adaptation. And that’s why it’s been hard.”
Beyond this, attribution of the impact of adaptive measures remains a “persistent challenge”, according to Dr Portia Adade Williams, a research scientist at the CSIR-Science and Technology Policy Research Institute and Carbon Brief contributing editor, “as observed changes in vulnerability or resilience may result from multiple climatic and non-climatic factors”. She adds:
“In many contexts, data limitations and inconsistent monitoring systems, particularly in developing countries, constrain systematic tracking of adaptation efforts. Existing monitoring frameworks tend to emphasise outputs, such as infrastructure built or trainings conducted, rather than outcomes that reflect actual reductions in vulnerability or enhanced resilience.”
Despite these challenges, the need for increased progress on adaptation is clear. Nearly half of the global population – around 3.6 billion people – are currently highly vulnerable to these impacts. This includes vulnerability to droughts, floods, heat stress and food insecurity.
However, for six years following the adoption of the Paris Agreement, the GGA did not feature on the agenda at COP summits and there was limited progress on the matter.
This changed in 2021, at COP26 in Glasgow, when parties initiated the two-year Glasgow-Sharm el-Sheikh work program to begin establishing tangible adaptation targets.
This work culminated at COP28 in Dubai, United Arab Emirates, with the GGA “framework”.
Agreeing the details of this framework and developing indicators to measure adaptation progress has been the main focus of negotiations in recent years.
What progress has been made?
Following the establishment of the GGA, there was – for many years – only limited progress towards agreeing how to track countries’ adaptation efforts.
COP28 was seen as a “pivotal juncture” for the GGA, with the creation of the framework and a new two-year plan to develop indicators, which is supposed to culminate at COP30.
Negotiations across the two weeks in Dubai in 2023 were tense. It took five days for a draft negotiating text on the GGA framework to emerge, due to objections from the G77 and China group of developing countries around the inclusion of adaptation finance.
Within the GGA – as with many negotiating tracks under the UNFCCC – finance to support developing nations is a common sticking point. Other disagreements included the principle of “common but differentiated responsibilities and respective capabilities” (CBDR–RC).
Ultimately, a text containing weakened language around both CBDR-RC and finance was waved through at the end of COP28 and a framework for the GGA was adopted.
Speaking to Carbon Brief, Ana Mulio Alvarez, a researcher on adaptation at thinktank E3G, said that the framework was the “first real step to fulfilling” the adaptation mandate laid out in the Paris Agreement, adding:
“The GGA is the equivalent of the 1.5C commitment for mitigation – a north star to guide efforts. It will be hugely symbolic if the GGA indicators are agreed at COP and the GGA can be implemented.”
The framework agreed at COP28 includes 11 targets to guide progress against the GGA. Of these, four are related to what it describes as an “iterative adaptation cycle” – risk assessment, planning, implementation and learning – and seven to thematic targets.
These “themes” cover water, food, health, ecosystems, infrastructure, poverty eradication and cultural heritage.
Within these, there are subgoals for countries to work towards. For example, within the water theme, there is a subgoal of achieving universal access to clean water.
While this framework was broadly welcomed as a step forward for adaptation work, there remains concern from some experts about the focus of the programme.
Prof Lisa Schipper, a professor of development geography at the University of Bonn, Intergovernmental Panel on Climate Change (IPCC) author and Carbon Brief contributing editor, tells Carbon Brief that without the framework there would likely have been continued delays, but there was still “significant scientific pushback against this approach to adaptation”.
She notes that the IPCC’s sixth assessment report (AR6) “didn’t necessarily provide any concrete inputs that could be useful for the GGA”. Beyond this, there are political challenges that the framework does not address, Schipper adds, continuing:
“There are also political reasons why global-north countries or annex-one countries don’t necessarily want specificity [in adaptation targets], because they also don’t want to be held accountable and to be forced to pay for things, right? So, the science was pathetic in one way, it was just not sufficient. And then you have a political agenda that’s fighting against clarity on this.
“So, even though [the framework] came together, it was still not very concrete, right? It was a framework, but it didn’t have a lot in it.”
As with the language around finance, thematic targets within the GGA were weakened over the course of the negotiations. Additionally, parties ultimately did not agree to set up a specific, recurring agenda item to continue discussing the GGA.
However, a further two-year programme was established at COP28. The UAE-Belém work programme was designed to establish concrete “indicators” that can be used to measure progress on adaptation going forward.
Why is it hard to choose adaptation indicators?
In the two years following COP28, work has been ongoing to narrow down a potential list of more than 9,000 indicators under the GGA to just 100.
At the UNFCCC negotiations in June 2024 in Bonn, parties agreed to ask for a group of technical experts to be convened to help with this process.
This led to a group of 78 experts meeting in September 2024. They were split into eight working groups – one for each of the seven themes and one for the iterative adaptation cycle – to begin work reviewing a list of more than 5,000 indicators, which had already been compiled from submissions to the UNFCCC.
In October 2024, a second workshop was held under the UAE-Belém work programme, at which the experts agreed that they should also consider an additional 5,000 indicators compiled by the Adaptation Committee, another body within the UN climate regime.
One key challenge, Beauchamp tells Carbon Brief, was that the group of experts had very limited time and a lack of resources. She expands:
“They had to finish their work by the end of the summer [of 2025]. This means they’ve not even had a year [and] they have no funding. So of the 78 experts, the number of whom could actually contribute was much lower, and it’s not by lack of desire and expertise. But [because] they have day jobs, they have families…And the lack of clear instructions from parties also didn’t help.”
COP29 formed the mid-way point in the work programme to develop adaptation indicators, with parties stressing it was “critical” to come away with a decision from the summit.
As with previous sessions, finance quickly became a sticking point in negotiations, however, alongside the notion of “transformational adaptation”.
This is a complex concept centred around the idea of driving systemic shifts – in infrastructure, governance or society more broadly – so as to address the root causes of vulnerability to climate change.
Ultimately, COP29 adopted a decision that made reference to finance as “means of implementation” (MOI), recognised transformational adaptation and launched the Baku Adaptation Roadmap (BAR). The BAR is designed to advance progress towards the GGA, however, the details of how it will operate are still unclear.
Going into the Bonn climate negotiations in June 2025, the list of potential indicators had been “miraculously” refined to a list of 490 through further work by the group of experts. While this was a major step forward, it was still a long way off the aim of agreeing to a final set of just 100 indicators at COP30.
Once again, disagreement quickly arose in Bonn around finance and this dominated much of the two weeks of negotiations. As such, a final text did not get uploaded until mid-way through the final plenary meeting of the negotiations.
This was seen as contentious, as some parties complained that they did not have time to fully assess it, before it was gavelled through.
Bethan Laughlin, senior policy specialist at the Zoological Society of London, tells Carbon Brief:
“Adaptation finance has consistently lagged behind mitigation for decades, despite growing recognition of the urgent need to build resilience to climate shocks. The gap between the needs of countries and the funding provided is stark, with an adaptation financing gap in the hundreds of billions annually.
“Within the GGA negotiations, the implications of this finance issue are clear. Disagreements persist over how MoI [finance] should be measured in the indicator set, particularly around whether private finance should count, how support from developed countries is defined, and how national budgets are tracked versus international climate finance.”
The final text produced in Bonn was split into two, with an agreed section capturing the GGA indicators and a separate “informal note” covering the BAR and transformation adaptation.
Importantly, the main text invited the experts to continue working on the indicators and to submit a final technical report with a list of potential indicators by August 2025.
As this work continued, one of the biggest challenges was “balancing technical rigour with political feasibility while ensuring ambition”, says Laughlin, adding:
“The scale and diversity of adaptation action means a diverse menu of indicators per target is needed, but this must not be so vast as to be unfeasible for countries to measure, especially those countries with limited resources and capacity.”
Meetings took place subsequently, within which experts focused on “ensuring adaptation relevance of indicators, reducing redundancy and ensuring coverage across thematic indicators”, according to a technical report.
Beauchamp notes the importance of these themes for continued work on adaptation, saying:
“The themes were really helpful to bring some attention and to communicate about the GGA. They echo more easily what adaptation results can look like, because people find it difficult to talk about processes. But they’re really important. Without the targets on the adaptation cycle, we can too easily forget that you need resilient processes to have resilient outcomes.”
The table below, from the same technical report, shows how nearly 10,000 adaptation indicators have been whittled down to a proposed final list of 100. The table also shows how the indicators are split between the themes (9a-g) and iterative adaptation cycle (10a-d) of the GGA framework.

Source: GGA technical report.
Further consultations took place in September and the final workshop under the UAE-Belém work programme took place on 3-4 October.
Following on from the numerous sessions held under the GGA, negotiators are now able to go into COP30 with a consolidated list of indicators to discuss, agree and bring into use, allowing progress towards the adaptation goal in Paris to be finally measured.
What to expect from COP30?
A final decision on the adaptation indicators is expected at COP30, potentially marking a significant milestone under the GGA.
In his third letter, COP30 president-designate Correa do Lago noted that a “special focus” was to be given to the GGA indicators at the summit.
He wrote that adaptation is “the visible face of the global response to climate change” and a “central pillar for aligning climate action with sustainable development”.
Therefore, he said COP30 should focus on “delivering tangible benefits for societies, ecosystems and economies by advancing and concluding the key mandates in this agenda”. These “key mandates” are the GGA and the related topic of National Adaptation Plans (NAPs).
Correa do Lago’s letter added:
“There is a window of opportunity to define a robust framework to track collective progress on adaptation. This milestone will also lay the groundwork for the future of the adaptation agenda.”
Indeed, adaptation has moved up the political agenda this year, with the topic being discussed during the “climate day” at the UN general assembly in September. This included a “leaders’ dialogue” on the sidelines of the assembly, where Carbon Brief understands that leaders of climate-vulnerable nations pushed for specific adaptation targets.
Elsewhere, nearly three-quarters (73%) of new country climate pledges include adaptation components, further emphasising the increased focus the topic is now receiving.
Despite the increased attention, there are still likely to be challenges at COP30, including the continued fight over finance. This will likely be felt particularly keenly, given that the COP26 commitment to double adaptation finance comes to an end this year.
This was part of the “Glasgow dialogue”, which saw parties commit to “at least double” adaptation finance between 2019 and 2025.
Adade Williams tells Carbon Brief:
“A major expectation [at COP30] is that parties will tackle the gaps in adaptation finance, consider how to link MoI – finance, technology, capacity‐building – with the GGA indicators and possibly set new finance ambitions or roadmaps. The emphasis on MoI means capacity building, data systems, technology transfer and institutional strengthening will gain more traction.”
Adaptation finance was also a key topic during pre-COP meetings in Brasilia in October, with E3G noting that it is a “political litmus test for success in Belém, with vulnerable countries signalling urgency and demanding greater clarity that finance will flow”.
Laughlin tells Carbon Brief that she expects discussions on finance to “dominate in Belém” – in particular, given the legacy of the “new collective quantified goal” (NCQG) for climate finance agreed at COP29, which many developing countries were “starkly disappointed” by.
Additionally, there may be challenges around the process of negotiations on the GGA indicators, notes Beauchamp, adding:
“We’ve not agreed yet if it is acceptable to open up text of some indicators [to negotiation]. We have 100 of them and, as a technical expert, on one hand [it] is quite worrying, because changing one term in an indicator can change its entire methodology, right? But, at the same time, there is definitely more work that can be done on the indicators.
“So, are we only keeping indicators that can work or that everybody is happy with now, and then we review the set later, for example, with the review of the UAE framework in 2028? Or do we open the whole Pandora’s box and then we start hashing out some new indicators? That’s the first big challenge parties need to grapple with at COP30.”
Despite the challenges, Mulio Alvarez says she would expect a final list of indicators to be adopted at COP30, even if some change during the negotiation process. She adds:
“The Brazilian presidency knows that this is the biggest negotiated outcome of COP30 and they want it to go through smoothly. The adoption of the list would officially launch the UAE framework so that it can begin to track and guide efforts.”
While agreement on indicators would be seen as a political win at COP30, several experts highlighted that it is only a step towards enabling further adaptation work, with Beauchamp noting that parties “need to see this as an opportunity”.
Laughlin adds:
“Although finalising the indicator list is a core deliverable, it is also important that COP30 makes progress on the next steps for the GGA following COP30, including the expectations for reporting, and regular updates to the indicator list so it keeps up with the latest science.”
What will the GGA mean for vulnerable communities?
COP30 kicks off on 10 November and negotiators are hoping to hit the ground running with the condensed list of indicators to discuss.
There remain key questions about what the GGA could mean for adaptation around the world – in particular, for those most vulnerable to the impacts of climate change.
Speaking to Carbon Brief, Mulio Alvarez notes:
“In the short term, the GGA metrics [indicators] will likely paint a very challenging picture of the needs for adaptation. In the medium to long term, we hope the GGA will be embedded in policy planning and implementation – supporting risk assessments, helping identify gaps, driving planning and resources and even unlocking investments.”
Others are more cautious about the potential impact of the GGA, the associated framework and its indicators, in terms of driving real progress for adaptation.
Schipper notes that, while the GGA indicators are welcome from a political perspective, “from a scientific perspective, and I think from a development perspective, I think there’s a sort of a high risk that this ends up making people worse off in the end”.
She adds that the incremental approach currently being taken for adaptation is not working and that the indicators can “at best” show us incremental progress.
Schipper notes that there is a risk that the indicators narrow the approach to adaptation to the extent that they are either ineffective or actually produce maladaptive outcomes. She adds:
“I’m not saying that we should abandon the indicators, but I think it’s important to recognise that this is not enough. This is nowhere near enough.”
Others are more optimistic about the long-term potential of the GGA. Laughlin suggests that the indicators could help build systemic resilience, adding that if they were successfully implemented it could mean adaptation is integrated into national development and planning, “making sure that climate resilience becomes a core part of policymaking”. She says:
“For vulnerable populations, this means moving from a reactive approach to a proactive one – embedding resilience into development planning, restoring ecosystems and empowering local communities.
“The success of the GGA in delivering for vulnerable populations hinges on political will, finance and inclusive governance – many of which are currently lacking.”
Beyond COP30, the GGA framework agreed at COP28 includes a number of overarching targets to help guide countries in developing and implementing their NAPs, although these targets are not quantified.
The targets include countries conducting risk assessments to identify the impact of climate change and areas of particular vulnerability, by 2030. The framework says this would inform a country’s NAP and that “by 2030 all parties have in place” adaptation planning processes or strategies, as shown in the image below.

Adade Williams tells Carbon Brief that if the GGA is “effectively implemented” it could help develop systemic resilience in the long term, helping to address “not just climate hazards but also underlying structural vulnerabilities”. She adds:
“However, this long-term potential depends heavily on the extent of political will, sustained finance and capacity support available to developing countries. Without these, the GGA risks becoming a reporting framework rather than a transformative mechanism for resilience.”
The post Q&A: COP30 could – finally – agree how to track the ‘global goal on adaptation’ appeared first on Carbon Brief.
Q&A: COP30 could – finally – agree how to track the ‘global goal on adaptation’
Greenhouse Gases
Western States Brace for a Uranium Boom as the Nation Looks to Recharge its Nuclear Power Industry
After years of federal efforts to revive nuclear power, old mines are stirring again in Wyoming, Texas and Arizona, while new ones line up for permitting expedited by a Trump executive order.
The U.S. says it wants to revive its atomic power industry, but it barely produces any nuclear fuel.
-
Climate Change2 years ago
Spanish-language misinformation on renewable energy spreads online, report shows
-
Climate Change3 months ago
Guest post: Why China is still building new coal – and when it might stop
-
Greenhouse Gases3 months ago
Guest post: Why China is still building new coal – and when it might stop
-
Climate Change Videos2 years ago
The toxic gas flares fuelling Nigeria’s climate change – BBC News
-

 Greenhouse Gases1 year ago
嘉宾来稿:满足中国增长的用电需求 光伏加储能“比新建煤电更实惠”
-

 Climate Change1 year ago
嘉宾来稿:满足中国增长的用电需求 光伏加储能“比新建煤电更实惠”
-

 Carbon Footprint2 years ago
US SEC’s Climate Disclosure Rules Spur Renewed Interest in Carbon Credits
-
Renewable Energy4 months ago
US Grid Strain, Possible Allete Sale

