
The year 2023 saw the coronation at Westminster Abbey of a new king, the mugshot of a former US president and the rebranding of a social media platform to a single letter.
But behind the biggest stories of the year, thousands of studies detailing new research also made the headlines. And climate change and energy were among the topics that received the most attention.
Each year, Altmetric tracks how often research papers from academic journals are mentioned in online news articles as well as on blogs and social media platforms. It then gives each paper a score according to the attention it receives.
Using Altmetric data for 2023, Carbon Brief has compiled its annual list of the 25 most talked-about climate- or energy-related papers that were published the previous year.
(The list focuses on peer-reviewed research papers only – commentaries or other papers that are not formally peer-reviewed are not included.)
The infographic above shows which papers made it into the top 10, while the article includes analysis of the full list of 25, including the diversity of their authors and which journals feature most frequently.
The list covers research into the climate projections of a major oil company, the human cost of global warming and the catastrophic failure of breeding penguins – as well as the curious case of the high-scoring paper that received almost no news coverage at all.
Antarctic ice shelves
The most talked-about journal papers of 2023 are again dominated by research relating to Covid-19, continuing the pattern seen in recent years.
For example, the highest-scoring paper of any published in 2023 is a review into the effectiveness of measures to reduce the spread of respiratory viruses, such as Covid, swine flu and severe acute respiratory syndrome (Sars).
The study’s Altmetric score of 25,730 puts it almost 10,000 points ahead of the second-placed paper, which is also about Covid.
But the top-scoring paper relating to climate is not far behind, landing fourth in the overall list with a score of 13,886.
The study, “Change in Antarctic ice shelf area from 2009 to 2019”, gains the highest score for any climate paper in any of Carbon Brief’s annual reviews by some distance – the previous highest was 7,803 in 2022.
(For Carbon Brief’s previous Altmetric articles, see the links for 2022, 2021, 2020, 2019, 2018, 2017, 2016 and 2015.)

The study, published in the Cryosphere, uses satellite observations to produce a dataset of changes in the “calving front” – that is, where icebergs break off – and area of the ice shelves that surround Antarctica between 2009 and 2019. It shows that, overall, the area of Antarctic ice shelves has grown by around 5,300 square kilometres (km2) since 2009, with 18 ice shelves retreating and 16 larger shelves growing in area.
Specifically, ice-shelf area has decreased on the Antarctic Peninsula (by 6,693km2) and in west Antarctica (by 5,563km2), and increased in east Antarctica (by 3,532km2) and on the large Ross and Ronne-Filchner ice shelves (by 14,028km2), the paper says.
The map from the study below shows the growth (blue) and retreat (red) of ice shelves around Antarctica, where the size of the circles indicates the scale of the change from 2009 to 2019.

While the high scores of climate-related papers in previous years have primarily been driven by news coverage, this paper appears in just seven news stories.
As study author Prof Anna Hogg from the University of Leeds explains to Carbon Brief:
“Somewhat unusually, we didn’t put out a press release for the paper as we assumed the scientific community that needed the dataset would make use of it naturally.”
Instead, the paper’s high Altmetric score is principally a result of a huge number of mentions on Twitter – more than 63,000 posts from around 48,000 accounts. (Altmetric includes weightings in its scoring system, so news articles (with a weighting of eight) are deemed to have more impact than tweets (0.25).)
A closer look suggests that the paper has been widely quoted by the Twitter accounts of a number of prominent climate sceptics in an attempt to push back on concerns around climate change and the loss of Antarctic ice. These posts have then been widely retweeted by other accounts.

To see the paper “being used as evidence to suggest that climate change isn’t happening” was a “real surprise”, says Hogg, because the paper “doesn’t make any such statement”.
Specifically, the gains the study identifies in ice-shelf area in east Antarctica do not detract from the risks of retreating ice shelves on other parts of the continent, says Hogg:
“The decrease in ice shelf area in west Antarctica is particularly important as this ice shelf area actively ‘buttresses’ the flow of ice from the ice sheet behind it, which through ice dynamic processes is one of the reasons why west Antarctica is contributing significantly to present-day sea level rise.”
Indeed, the seventh most-talked about paper in 2023 (see below) is a Nature Climate Change study warning that accelerated melt of west Antarctica’s ice shelves is now locked in, even for the most ambitious emissions reduction scenarios. The authors provide this stark conclusion:
“These results suggest that mitigation of greenhouse gases now has limited power to prevent ocean warming that could lead to the collapse of the west Antarctic ice sheet.”
The misleading way the study has been used by some climate-sceptic social media accounts has been “incredibly challenging”, says Hogg, with the authors unable “to reply to every incorrect tweet” about their work. However, they did find “a fair number” of responses from other accounts “saying that they had read the paper and it didn’t provide evidence against climate change”.
This perhaps shows “open access doing its job”, says Hogg, as the paper was published in an open-access journal and so is freely available for anyone to read. In another high-scoring statistic, the full paper has now been viewed more than 150,000 times on the journal’s website.
ExxonMobil
Landing in second place with an Altmetric score of 8,686 is the review paper, “Assessing ExxonMobil’s global warming projections”. Published in Science, the study analyses the global warming projections documented and modelled by scientists at the oil major ExxonMobil between 1977 and 2003.
(There is a higher-scoring paper, “The 2023 state of the climate report: Entering uncharted territory”, in the journal BioScience, but it is a “special report” and was not formally peer reviewed.)

The results indicate that “in private and academic circles since the late 1970s and early 1980s, ExxonMobil predicted global warming correctly and skillfully”, the paper says, adding:
“ExxonMobil’s average projected warming was 0.20C ±0.04C per decade, which is, within uncertainty, the same as that of independent academic and government projections published between 1970 and 2007.”
The findings reveal that ExxonMobil “knew as much as academic and government scientists knew” about global warming decades ago. But, the paper adds, “whereas those scientists worked to communicate what they knew, ExxonMobil worked to deny it”.
The study was covered by 823 news stories by 555 outlets, including BBC News, the Associated Press, CNN, Vice, CNBC and Inside Climate News. It was also included in 48 blog posts and more than 13,000 tweets. It is the 12th most talked-about paper on any topic in 2023.
Extreme heat
In third place is the Nature Medicine paper, “Heat-related mortality in Europe during the summer of 2022”, with a score of 7,821. The study finds that more than 60,000 deaths in the summer of 2022 – Europe’s hottest season on record – were linked to the heat.

Across 35 countries, the highest numbers of heat-related deaths occurred in Italy (18,010 deaths), Spain (11,324) and Germany (8,173), the study says. It also finds that the “burden of heat-related mortality was higher among women”, with 56% more heat-related deaths in women than men, relative to population.
The study was picked up in 943 news stories from more than 650 outlets – the largest number of any paper in the top 25. It was picked up by outlets across Europe, including Sky News and ITV News in the UK, Agence France-Presse in France and Der Spiegel in Germany. Carbon Brief also covered the article in detail.
The widespread coverage was likely to be in part because Europe was experiencing a heatwave dubbed “Cerberus” when the paper was published in July.
Lead author Dr Joan Ballester Claramunt from the Barcelona Institute for Global Health tells Carbon Brief that the paper also “received so much attention from the media because society is increasingly aware of the health risks of environmental factors, and particularly in a context of rapidly warming temperatures”.
Rest of the top 10
In fourth place is, “Warning of a forthcoming collapse of the Atlantic Meridional Overturning Circulation”, which was published in Nature Communications.
The study uses statistical techniques to detect early warning signs of a shutdown in the Atlantic Meridional Overturning Circulation (AMOC), one of the major current systems in the world’s oceans that plays a crucial role in regulating climate.
While assessments using climate model simulations typically suggest that AMOC is “unlikely” to pass a tipping point within the 21st century, the study says a collapse could occur “around mid-century under the current scenario of future emissions”.
(Another paper that also uses observation-based early warning signals to assess the stability of AMOC featured in second place in Carbon Brief’s leaderboard for 2021.)
The paper’s Altmetric score of 6,216 reflects its widespread news coverage, covering 672 stories from more than 500 outlets, including the Washington Post, Politico, El País, CNN and Der Spiegel.
The papers in fifth and ninth place both set out frameworks for assessing “safe” boundaries for the Earth to be a habitable place for humans.
In fifth place with a score of 5,411 is the Science Advances paper, “Earth beyond six of nine planetary boundaries”. Providing the latest assessment of the boundaries that were first established in 2009, the paper warns that “Earth is now well outside of the safe operating space for humanity”.
The ninth-placed paper, “Safe and just Earth system boundaries”, shares a number of the same authors and sets out to quantify limits for “climate, the biosphere, water and nutrient cycles and aerosols at global and subglobal scales”. When the paper was published in May, Carbon Brief reported on the mixed reaction the paper received from other scientists, including concerns that a “self-selected group of scientists” were defining the “safe space” for the planet.
In sixth place is the Science paper, “Global glacier change in the 21st century: Every increase in temperature matters”, which reveals a “strong linear relationship between global mean temperature increase and glacier mass loss”.
The study projects that glaciers outside of Antarctica and Greenland will lose between 26% and 41% of their collective mass by 2100, relative to 2015, under warming of 1.5C to 4C, respectively. Such a loss would cause 49-83% of glaciers to disappear and see 90-154mm added to global sea levels, the study says.
In seventh place is the Nature Climate Change paper, “Unavoidable future increase in West Antarctic ice-shelf melting over the 21st century”, as mentioned above. The findings, the authors say, present a “sobering outlook” for ice shelves in the Amundsen Sea.
The paper made an appearance in the Science round of Carbon Brief’s annual quiz.
The eighth-placed paper is, Quantifying the human cost of global warming, published in Nature Sustainability. It quantifies this cost in terms of the number of people left outside the “climate niche” in which human civilisation has flourished for centuries.
The study shows that climate change has already put around 9% of people outside this niche, and that, by end-of-century, current policies leading to around 2.7C global warming could leave 22-39% of people outside the niche as well.
Finally, rounding out the top 10 is, “Climate extremes likely to drive land mammal extinction during next supercontinent assembly”, in Nature Geoscience.
The study looks at the prospects for humans and other mammals on Earth based on first-ever supercomputer climate modelling of the distant future. The knock-on impacts of all Earth’s continents eventually converging to form the supercontinent “Pangea Ultima” would see huge amounts of CO2 released into the air through volcanic eruptions, it says.
The resulting global temperatures of up to 75C would, as a headline in the i newspaper put it, “one day wipe out humanity – but not for another 250m years”.
Elsewhere in the top 25
The rest of the top 25 includes a mix of research, including a paper on the impacts of El Niño on economic growth, a study on the environmental impacts of different types of diets and analysis of the amount of global warming still “in the pipeline” by former Nasa scientist Dr James Hansen.
In 14th place is the Nature paper, “Assessing the size and uncertainty of remaining carbon budgets”, which presents an updated estimate of the remaining carbon budget for limiting warming to 1.5C and 2C.
In a 2022 Carbon Brief guest post, some of the study authors present a similar analysis, concluding that the remaining carbon budget to limit warming to 1.5C could be just 260bn tonnes of CO2 (GtCO2) – the equivalent of around six years of emissions. They add:
“Cutting global CO2 emissions to zero by 2050, in line with limiting warming to 1.5C, would require them to fall by about 1.4GtCO2 every year, comparable to the drop in 2020 as a result of Covid-19 lockdowns around the world, but this time driven by a long-term, structural change of the economy.
“This highlights that the scale of the challenge is immense, no matter the precise figure of the rapidly shrinking carbon budget.”
Antarctic sea ice made headlines around the world both in 2022 and 2023, by setting two consecutive years of record low sea ice extent. In August 2023, researchers published a sobering study in Communications Earth and Environment under the title, “Record low 2022 Antarctic sea ice led to catastrophic breeding failure of emperor penguins”.
The study finds that melting ice led to widespread “breeding failure” across Antarctic emperor penguin colonies and received widespread media attention. It has been mentioned in 537 news articles, generating headlines such as, “Thousands of penguins die in Antarctic ice breakup”, from BBC News and, “Thousands of penguin chicks killed by early sea ice breakup, study says”, in the Washington Post.
The Guardian, New Scientist and Daily Telegraph were among the other publications that reported on the study. This surge of attention pushed the paper to 15th in the Carbon Brief ranking, with an Altmetric score of 3,551.
Meanwhile, the Lancet Countdown on health and climate change slipped down the rankings this year. After three years in the Carbon Brief’s top 10, this year’s report lands in 20th place with an Altmetric score of 3,191.
The report is an epic annual publication, which reviews vast swathes of literature and has more than 100 authors this year. This year’s report introduced some key new indicators of the links between climate change and human health. It was also the first to include projections on how the indicators might worsen in a warmer world.
The report finds that loss of labour due to heat exposure resulted in a $863bn loss of “potential income” in 2022. The agriculture sector was hit the hardest by the loss of labour, accounting for 82% of losses in least developed countries, the authors add.
Carbon Brief’s coverage of the report highlights this loss of income due to heat stress. The graph below shows effective income losses in 2022 due to heat stress in agriculture (blue) and other sectors (red), as a percentage of GDP, by continent.

One spot below the Lancet report is a Geophysical Research Letters study which warns that climate change is making air turbulence stronger and more frequent. The findings, which were picked up in more than 500 news articles, have worrying implications for aircraft passengers.
Back in 2017, study author Dr Paul Williams wrote a Carbon Brief guest post warning that “the most severe [type of turbulence] – the kind that can launch passengers out of their seats and cause serious injuries – is set to become twice or even three times as common by the latter half of the century”. And a recent Carbon Brief guest post on the fastest jet stream winds – known as “jet streaks” – also forecasts an increase in clear-air turbulence for aircraft passengers.
And in 24th place is the Nature paper, “Glacial lake outburst floods threaten millions globally”, with an Altmetric of 2,991. The study warns that 15 million people globally are exposed to impacts of potential “glacial lake outburst floods” (GLOFs). (For more on GLOFs, see Carbon Brief’s guest post from 2020, which explains how lakes formed by melting glaciers around the world have increased in size by 50% over the past 30 years.)
Top journals
This year there is a clear winner for the journal with the most papers featuring in Carbon Brief’s top 25: Science takes top spot with five papers.
Following Science are the three journals of Nature Climate Change, Nature Communications and the Lancet, each with two papers in the top 25.
For the rest of the top 25, the remaining 14 journals appear once each.
All the final scores for 2023 can be found in this spreadsheet.

Diversity of the top 25
The top 25 climate papers of 2023 cover a huge range of topics and scope. However, despite the variety in the climate research the papers present, analysis of their authors reveals a distinct lack of diversity.
In total, the top 25 climate papers of 2023 have more than 440 authors. Carbon Brief recorded the gender and country of affiliation for each of these authors. (The methodology used was developed by Carbon Brief for analysis presented in a special 2021 series on climate justice.)
The analysis reveals that the authors of the climate papers most featured in the media in 2023 are predominantly men from the global north.
The chart below shows the institutional affiliations of all authors in this analysis, broken down by continent – Europe, North America, Oceania, Asia, South America and Africa.

The analysis shows that nine out of every 10 authors are affiliated with institutions from the global north – defined as North America, Europe and Oceania. Meanwhile, only six authors are from Africa and South America.
Further data analysis shows that there are also inequalities within continents. The map below shows the percentage of authors from each country in the analysis, where dark blue indicates a higher percentage. Countries that are not represented by any authors in the analysis are shown in white.

The top-ranking countries on this map are the UK and the US, which together account for almost half of all authors in this analysis (25% and 18%, respectively).
More than half of all researchers from the global south are from China – which accounts for around 6% of all researchers in the analysis.
Meanwhile, only one-third of authors from the top 25 climate papers of 2022 are women. Similarly, only seven of the 25 papers have a female lead author.
The plot below shows the number of male (purple) and female (orange) authors in this analysis from each continent.

The full spreadsheet showing the results of this data analysis can be found here. For more on the biases in climate publishing, see Carbon Brief’s article on the lack of diversity in climate-science research.


The post Analysis: The climate papers most featured in the media in 2023 appeared first on Carbon Brief.
Analysis: The climate papers most featured in the media in 2023
Tropical cyclones that rapidly intensify when passing over marine heatwaves can become “supercharged”, increasing the likelihood of high economic losses, a new study finds.
Such storms also have higher rates of rainfall and higher maximum windspeeds, according to the research.
The study, published in Science Advances, looks at the economic damages caused by nearly 800 tropical cyclones that occurred around the world between 1981 and 2023.
It finds that rapidly intensifying tropical cyclones that pass near abnormally warm parts of the ocean produce nearly double – 93% – the economic damages as storms that do not, even when levels of coastal development are taken into account.
One researcher, who was not involved in the study, tells Carbon Brief that the new analysis is a “step forward in understanding how we can better refine our predictions of what might happen in the future” in an increasingly warm world.
As marine heatwaves are projected to become more frequent under future climate change, the authors say that the interactions between storms and these heatwaves “should be given greater consideration in future strategies for climate adaptation and climate preparedness”.
‘Rapid intensification’
Tropical cyclones are rapidly rotating storm systems that form over warm ocean waters, characterised by low pressure at their cores and sustained winds that can reach more than 120 kilometres per hour.
The term “tropical cyclones” encompasses hurricanes, cyclones and typhoons, which are named as such depending on which ocean basin they occur in.
When they make landfall, these storms can cause major damage. They accounted for six of the top 10 disasters between 1900 and 2024 in terms of economic loss, according to the insurance company Aon’s 2025 climate catastrophe insight report.
These economic losses are largely caused by high wind speeds, large amounts of rainfall and damaging storm surges.
Storms can become particularly dangerous through a process called “rapid intensification”.
Rapid intensification is when a storm strengthens considerably in a short period of time. It is defined as an increase in sustained wind speed of at least 30 knots (around 55 kilometres per hour) in a 24-hour period.
There are several factors that can lead to rapid intensification, including warm ocean temperatures, high humidity and low vertical “wind shear” – meaning that the wind speeds higher up in the atmosphere are very similar to the wind speeds near the surface.
Rapid intensification has become more common since the 1980s and is projected to become even more frequent in the future with continued warming. (Although there is uncertainty as to how climate change will impact the frequency of tropical cyclones, the increase in strength and intensification is more clear.)
Marine heatwaves are another type of extreme event that are becoming more frequent due to recent warming. Like their atmospheric counterparts, marine heatwaves are periods of abnormally high ocean temperatures.
Previous research has shown that these marine heatwaves can contribute to a cyclone undergoing rapid intensification. This is because the warm ocean water acts as a “fuel” for a storm, says Dr Hamed Moftakhari, an associate professor of civil engineering at the University of Alabama who was one of the authors of the new study. He explains:
“The entire strength of the tropical cyclone [depends on] how hot the [ocean] surface is. Marine heatwave means we have an abundance of hot water that is like a gas [petrol] station. As you move over that, it’s going to supercharge you.”
However, the authors say, there is no global assessment of how rapid intensification and marine heatwaves interact – or how they contribute to economic damages.
Using the International Best Track Archive for Climate Stewardship (IBTrACS) – a database of tropical cyclone paths and intensities – the researchers identify 1,600 storms that made landfall during the 1981-2023 period, out of a total of 3,464 events.
Of these 1,600 storms, they were able to match 789 individual, land-falling cyclones with economic loss data from the Emergency Events Database (EM-DAT) and other official sources.
Then, using the IBTrACS storm data and ocean-temperature data from the European Centre for Medium-Range Weather Forecasts, the researchers classify each cyclone by whether or not it underwent rapid intensification and if it passed near a recent marine heatwave event before making landfall.
The researchers find that there is a “modest” rise in the number of marine heatwave-influenced tropical cyclones globally since 1981, but with significant regional variations. In particular, they say, there are “clear” upward trends in the north Atlantic Ocean, the north Indian Ocean and the northern hemisphere basin of the eastern Pacific Ocean.
‘Storm characteristics’
The researchers find substantial differences in the characteristics of tropical cyclones that experience rapid intensification and those that do not, as well as between rapidly intensifying storms that occur with marine heatwaves and those that occur without them.
For example, tropical cyclones that do not experience rapid intensification have, on average, maximum wind speeds of around 40 knots (74km/hr), whereas storms that rapidly intensify have an average maximum wind speed of nearly 80 knots (148km/hr).
Of the rapidly intensifying storms, those that are influenced by marine heatwaves maintain higher wind speeds during the days leading up to landfall.
Although the wind speeds are very similar between the two groups once the storms make landfall, the pre-landfall difference still has an impact on a storm’s destructiveness, says Dr Soheil Radfar, a hurricane-hazard modeller at Princeton University. Radfar, who is the lead author of the new study, tells Carbon Brief:
“Hurricane damage starts days before the landfall…Four or five days before a hurricane making landfall, we expect to have high wind speeds and, because of that high wind speed, we expect to have storm surges that impact coastal communities.”
They also find that rapidly intensifying storms have higher peak rainfall than non-rapidly intensifying storms, with marine heatwave-influenced, rapidly intensifying storms exhibiting the highest average rainfall at landfall.
The charts below show the mean sustained wind speed in knots (top) and the mean rainfall in millimetres per hour (bottom) for the tropical cyclones analysed in the study in the five days leading up to and two days following a storm making landfall.
The four lines show storms that: rapidly intensified with the influence of marine heatwaves (red); those that rapidly intensified without marine heatwaves (purple); those that experienced marine heatwaves, but did not rapidly intensify (orange); and those that neither rapidly intensified nor experienced a marine heatwave (blue).

Dr Daneeja Mawren, an ocean and climate consultant at the Mauritius-based Mascarene Environmental Consulting who was not involved in the study, tells Carbon Brief that the new study “helps clarify how marine heatwaves amplify storm characteristics”, such as stronger winds and heavier rainfall. She notes that this “has not been done on a global scale before”.
However, Mawren adds that other factors not considered in the analysis can “make a huge difference” in the rapid intensification of tropical cyclones, including subsurface marine heatwaves and eddies – circular, spinning ocean currents that can trap warm water.
Dr Jonathan Lin, an atmospheric scientist at Cornell University who was also not involved in the study, tells Carbon Brief that, while the intensification found by the study “makes physical sense”, it is inherently limited by the relatively small number of storms that occur. He adds:
“There’s not that many storms, to tease out the physical mechanisms and observational data. So being able to reproduce this kind of work in a physical model would be really important.”
Economic costs
Storm intensity is not the only factor that determines how destructive a given cyclone can be – the economic damages also depend strongly on the population density and the amount of infrastructure development where a storm hits. The study explains:
“A high storm surge in a sparsely populated area may cause less economic damage than a smaller surge in a densely populated, economically important region.”
To account for the differences in development, the researchers use a type of data called “built-up volume”, from the Global Human Settlement Layer. Built-up volume is a quantity derived from satellite data and other high-resolution imagery that combines measurements of building area and average building height in a given area. This can be used as a proxy for the level of development, the authors explain.
By comparing different cyclones that impacted areas with similar built-up volumes, the researchers can analyse how rapid intensification and marine heatwaves contribute to the overall economic damages of a storm.
They find that, even when controlling for levels of coastal development, storms that pass through a marine heatwave during their rapid intensification cause 93% higher economic damages than storms that do not.
They identify 71 marine heatwave-influenced storms that cause more than $1bn (inflation-adjusted across the dataset) in damages, compared to 45 storms that cause those levels of damage without the influence of marine heatwaves.
This quantification of the cyclones’ economic impact is one of the study’s most “important contributions”, says Mawren.
The authors also note that the continued development in coastal regions may increase the likelihood of tropical cyclone damages over time.
Towards forecasting
The study notes that the increased damages caused by marine heatwave-influenced tropical cyclones, along with the projected increases in marine heatwaves, means such storms “should be given greater consideration” in planning for future climate change.
For Radfar and Moftakhari, the new study emphasises the importance of understanding the interactions between extreme events, such as tropical cyclones and marine heatwaves.
Moftakhari notes that extreme events in the future are expected to become both more intense and more complex. This becomes a problem for climate resilience because “we basically design in the future based on what we’ve observed in the past”, he says. This may lead to underestimating potential hazards, he adds.
Mawren agrees, telling Carbon Brief that, in order to “fully capture the intensification potential”, future forecasts and risk assessments must account for marine heatwaves and other ocean phenomena, such as subsurface heat.
Lin adds that the actions needed to reduce storm damages “take on the order of decades to do right”. He tells Carbon Brief:
“All these [planning] decisions have to come by understanding the future uncertainty and so this research is a step forward in understanding how we can better refine our predictions of what might happen in the future.”


The post Marine heatwaves ‘nearly double’ the economic damage caused by tropical cyclones appeared first on Carbon Brief.
Marine heatwaves ‘nearly double’ the economic damage caused by tropical cyclones
Rising temperatures and overfishing have seen the U.K.’s iconic cod decline for over a decade. Now, consumers are warned to “completely avoid” eating the fish.
The days of Britain’s fish and chip shops might be numbered.
Climate Change
DeBriefed 10 April 2026: Worst energy crisis ‘ever’ | India withdraws COP33 bid | Drag artists and climate change
Welcome to Carbon Brief’s DeBriefed.
An essential guide to the week’s key developments relating to climate change.
This week
Ceasefire causes oil price drop
CEASEFIRE SLUMP: Following the announcement on Tuesday of a two-week ceasefire agreement between Iran and the US and Israel, oil prices dropped below $96 per barrel, according to the Associated Press. However, price volatility resumed when a Saudi Arabian oil pipeline was hit just hours later, according to Reuters.
CRISIS COMBINED: Reuters and other outlets covered comments made by the International Energy Agency’s Fatih Birol to Le Figaro, where he said that the current energy crisis is worse than those of “1973, 1979 and 2022 combined”. It added that Birol said the “world has never experienced a disruption to energy supply of such magnitude”.
POLLUTERS PROFIT: The Guardian covered how the “worst polluters hold [the] world’s future in their hands as they benefit from higher fossil fuel prices”, but it added “global trends favour renewables”. The South China Morning Post reported that, according to experts, the diversification of energy sources is set to accelerate as the war continues to disrupt the world’s energy supplies.
Around the world
- CLIMATE GOALS PERIL: The UK opening new oil and gas fields in the North Sea “would imperil” international climate goals, experts told the Guardian. The warning came as the government pushed back against the speculation that it is set to approve new drilling projects, according to Sky News.
- COP33 CHANGES: The Indian government has withdrawn its offer to host the COP33 climate summit, “following a review of its commitments for the year 2028”, reported Climate Home News.
- ‘LONG-LASTING’ SHOCK: The Financial Times covered comments by EU energy commissioner Dan Jørgensen that the bloc was bracing for a “long-lasting” energy shock from the Iran war. Reuters reported that five EU countries have called for a windfall tax on energy companies’ profits in response to rising fuel prices.
- US BUDGET CUTS: US president Donald Trump’s 2027 budget proposal included targeting the “green new scam” with substantial cuts to energy and environment programmes, according to the Los Angeles Times.
- AFGHAN FLOODS: Since 26 March, at least 148 people have died and 216 have been injured due to heavy rains, floods, earthquakes and landslides in Afghanistan, reported Reuters.
- PENGUINS ENDANGERED: The “mass drowning” of emperor penguin chicks as sea ice melts due to climate change has led the International Union for Conservation of Nature to declare the species officially in danger of extinction, according to the Guardian.
86,120
The record number of battery electric vehicle sales registered in the UK in March, making up 22.6% of the total car market, according to the Society of Motor Manufacturers and Traders.
Latest climate research
- More than a quarter of the world’s population will face more frequent and severe hot-and-dry extreme events by 2100 under current climate policies | Geophysical Research Letters
- Climate change will increase wildfire exposure for nearly 10,000 species by the end of the century | Nature Climate Change
- A variety of climate hazards critically expose up to 30% of southern Africa to “environmental degradation” | PLOS One
(For more, see Carbon Brief’s in-depth daily summaries of the top climate news stories on Tuesday, Wednesday, Thursday and Friday.)
Captured
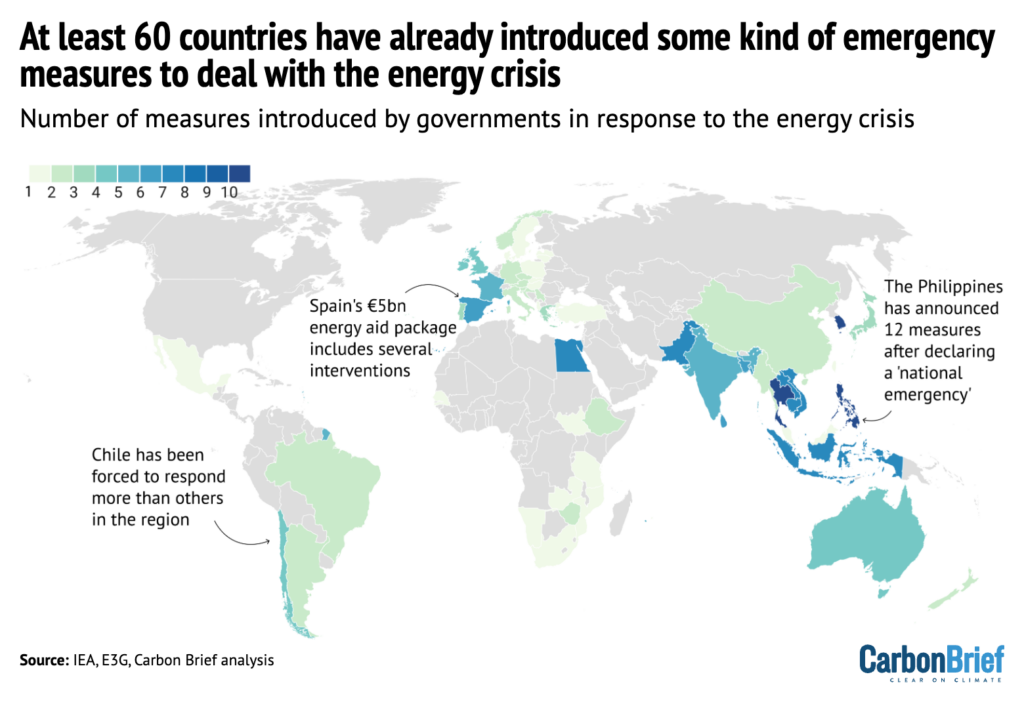
Carbon Brief analysis found that, since the beginning of the Iran war in late February, at least 60 countries have announced nearly 200 emergency energy-saving measures. Around 30 nations, from Norway to Zambia, have cut fuel taxes to help people struggling with rising costs, making this by far the most common domestic policy response to the crisis, said the analysis. Some countries have stressed the need to boost domestic renewable-energy construction, while others – including Japan, Italy and South Korea – have opted to lean more on coal, at least in the short term.
Spotlight
How drag is tackling climate change
This week, Carbon Brief looks at how some drag artists are using their performances to draw attention to climate change
Back in 2005, veteran climate journalist Bill McKibben wrote that “what the warming world needs now is art, sweet art” to help “build a general consciousness about climate change”.
Since then, the topic of climate change has spread to a host of art forms, from literature and music through to comedy and film.
One of the most recent art forms to take up the climate communication baton is drag, with performers using it as a “Trojan horse” to engage with audiences, according to Cheddar Gorgeous, a British drag performer.
‘Joy inspires momentum’
Drag artists around the world have begun to draw attention to the climate movement, using creativity, entertainment and their platforms to engage with their audiences.
In the UK, Cheddar Gorgeous declined a nomination for the British LGBT Awards due to its sponsorship by Shell and has made repeated calls for climate action.
Speaking on the “climate quickie” TEDx podcast, she argued:
“Drag can disrupt the master narratives that dictate our society. I love drag that makes you look at yourself and look at the world in a different way. And that can be deployed in all sorts of exciting ways.”
Drag has a proud history of disruption. As part of a TED talk titled, “Why joy is a serious way to take action”, US drag queen Pattie Gonia provided the audience with some “herstory” about the role of drag within protests. She said:
“Since the birth of the queer rights movement, drag performers and trans people have always been on the forefront of organising and protesting and community building.
“When we had the statistics and the facts on the millions of queer people dying of AIDS, yet no one was joining our fight, drag performers turned pain into joy and, in doing so, welcomed millions more people to fight with us.”

Pattie Gonia is arguably the best-known drag artist to engage with climate change. She is currently touring her environmental drag show “SAVE HER!” and has, according to her website, fundraised more than “$4.7m for LGBTQIA+, BIPOC and environmental non-profits”.
A key part of her message is the need for diversity and inclusion within the climate movement, adding that “our creativity is critical in this climate dilemma”. In her TED talk, she added:
“The problem in the climate movement isn’t just the abundance of carbon; it is the lack of joy. The scientific facts, the doom and gloom, they scare people, they wake them up. But joy is what will get people out of bed every day to take more action.”
Alongside Pattie Gonia, climate conversations are filtering into the wider drag movement, including being a topic repeatedly touched on in the highly successful TV drag contest, RuPaul’s Drag Race.
This ranges from drag artist Asia O’Hara explaining what global warming is in season 10 – telling her fellow contestants: “Bitch, the ice is melting!” – to queens dancing to “97% of scientists and four out of four Drag Race judges agree” that climate change “is real” during a challenge in season 11. (Drag Race host RuPaul Andre Charles has faced criticism for reportedly allowing fracking on his Wyoming ranch.)
Drag is opening up the climate movement to a wider audience, promoting diversity, inclusion and creativity in the space, according to its advocates. For Pattie Gonia, a key part of climate action has to be joy, she added:
“Joy provides an unbelievable opportunity to make the climate movement irresistible. Do not underestimate the power of joy. We deserve more than doom and gloom, because this is the only planet with a Beyoncé on it.”
Watch, read, listen
COOPERATION OVER CHAOS: In the Indian Express, Simon Stiell, the executive secretary of UN Climate Change, argued that “climate cooperation offers a way out of energy price chaos”.
ELECTRIC WORLD ORDER: On the Polycrisis podcast, Mark Blyth, a professor of international economics at Brown University, and Dr Naa Adjekai Adjei, a non-resident fellow, Africa, at the China Global South Project, discussed “what the US dollar has to do” with energy access in Africa.
‘THE RECKONING’: In the Equator, Mona Ali, associate professor of economics at the State University of New York, explored the closure of the Strait of Hormuz and the “end of American hegemony”.
Coming up
- 12 April: Hungarian elections
- 12 April: Peruvian elections
- 13-18 April: World Bank and International Monetary Fund Spring Meetings, Washington, DC, US
- 14 April: IEA Oil Market Report launch
Pick of the jobs
- Global Witness, several climate change jobs | Salary: Varied. Location: London
- London School of Economics, policy fellow – climate, gender and inclusivity | Salary: £53,949-£62,160. Location: London
- Climate Group, senior manager, international policy and advocacy | Salary: £47,160-£49,930. Location: London
- WWF, Nedbank green trust manager | Salary: Unknown. Location: Cape Town or Johannesburg, South Africa
- Greenpeace Australia Pacific, creative producer | Salary: AU$101,272. Location: Australia
- The Fairness Project, climate policy researcher | Salary: $96,000. Location: Remote (US)
DeBriefed is edited by Daisy Dunne. Please send any tips or feedback to debriefed@carbonbrief.org.
This is an online version of Carbon Brief’s weekly DeBriefed email newsletter. Subscribe for free here.
The post DeBriefed 10 April 2026: Worst energy crisis ‘ever’ | India withdraws COP33 bid | Drag artists and climate change appeared first on Carbon Brief.


-
Climate Change8 months ago
Guest post: Why China is still building new coal – and when it might stop
-
Greenhouse Gases8 months ago
Guest post: Why China is still building new coal – and when it might stop
-

 Greenhouse Gases2 years ago
嘉宾来稿:满足中国增长的用电需求 光伏加储能“比新建煤电更实惠”
-
Climate Change2 years ago
Bill Discounting Climate Change in Florida’s Energy Policy Awaits DeSantis’ Approval
-

 Climate Change2 years ago
嘉宾来稿:满足中国增长的用电需求 光伏加储能“比新建煤电更实惠”
-
Climate Change Videos2 years ago
The toxic gas flares fuelling Nigeria’s climate change – BBC News
-

 Renewable Energy6 months ago
Sending Progressive Philanthropist George Soros to Prison?
-

 Carbon Footprint2 years ago
US SEC’s Climate Disclosure Rules Spur Renewed Interest in Carbon Credits