
China’s exports of clean-energy technologies such as solar panels, batteries and electric vehicles are increasingly helping to cut emissions in other countries.
Such exports in 2024 alone are already shaving 1% off global emissions outside of China and, in total, will avoid some 4bn tonnes of carbon dioxide (GtCO2) over the lifetimes of the products.
Moreover, the global CO2 savings from using these products for just one year acts to more than outweigh the emissions from manufacturing them.
This new analysis for Carbon Brief is based on a detailed assessment of clean-technology export flows, the carbon footprint of manufacturing these products and the “carbon intensity” of electricity generation in destination countries.
Other key findings from the analysis include:
- The solar panels, batteries, electric vehicles (EVs) and wind turbines exported from China in 2024 are set to cut annual CO2 emissions in the rest of the world by 1%, some 220m tonnes (MtCO2).
- Manufacturing these products resulted in an estimated 110MtCO2 within China in 2024, implying that the upfront CO2 emissions are offset in much less than a year of operation.
- Over the expected lifetime of these products, their manufacturing emissions will be offset almost 40-fold, with cumulative CO2 savings reaching 4.0GtCO2.
- When factoring in China’s plans to build overseas manufacturing plants for clean-energy products, as well as to construct overseas clean-power projects, the avoided CO2 increases to 350MtCO2 per year. This is 1.5% of global emissions outside China and almost equal to the annual emissions of Australia.
- The largest emission reductions are associated with direct clean-technology equipment exports – particularly solar panels – followed by manufacturing at Chinese factories overseas, with overseas projects financed by Chinese investors a distant third.
- China’s clean-energy footprint almost spans the entire world, with exports to 191 of the 192 other UN member states, as well as manufacturing and project finance investments in dozens of countries.
- Clean-energy exports from China in 2024 alone, along with its overseas investments from 2023 and 2024, are set to cut emissions in sub-Saharan Africa by around 3% per year once completed and in the Middle East and north Africa (MENA) region by 4.5%.
China’s rapid expansion in clean-energy manufacturing and exports is already reshaping emissions trajectories in several key regions.
While China dominates the supply of equipment, however, most of the financing for clean-energy development outside of China is provided by others, with around three-fourths of the value from clean-energy projects and products being captured in other countries.
Nevertheless, Chinese industries stand to benefit from increased exports as global demand for clean-energy technologies grows – and there are signs that this is already starting to shift China’s political and diplomatic stance on climate action.
Clean-energy’s cumulative climate impacts
China’s booming output of clean-energy technologies is enabling rapid deployment both domestically and around the world, but their production is energy- and carbon-intensive.
The new analysis shows Chinese clean-tech exports are nevertheless having immediate global climate benefits. This contradicts many commentators who have linked China’s clean-tech boom to the rapid recent rise in its emissions.
Specifically, the analysis shows that manufacturing clean-energy equipment for export resulted in an estimated 110MtCO2 of emissions in 2024, or just 1.1% of China’s CO2 from fossil fuels.
Yet the solar panels, batteries, EVs and wind turbines exported in 2024 will avoid an estimated 220MtCO2 annually when put into operation overseas.
Moreover, these products will continue to generate emissions savings for as long as they continue operating. The clean-energy products exported in 2024 alone will avoid a cumulative total of 4.0GtCO2 across their lifetimes, as shown in the figure below.
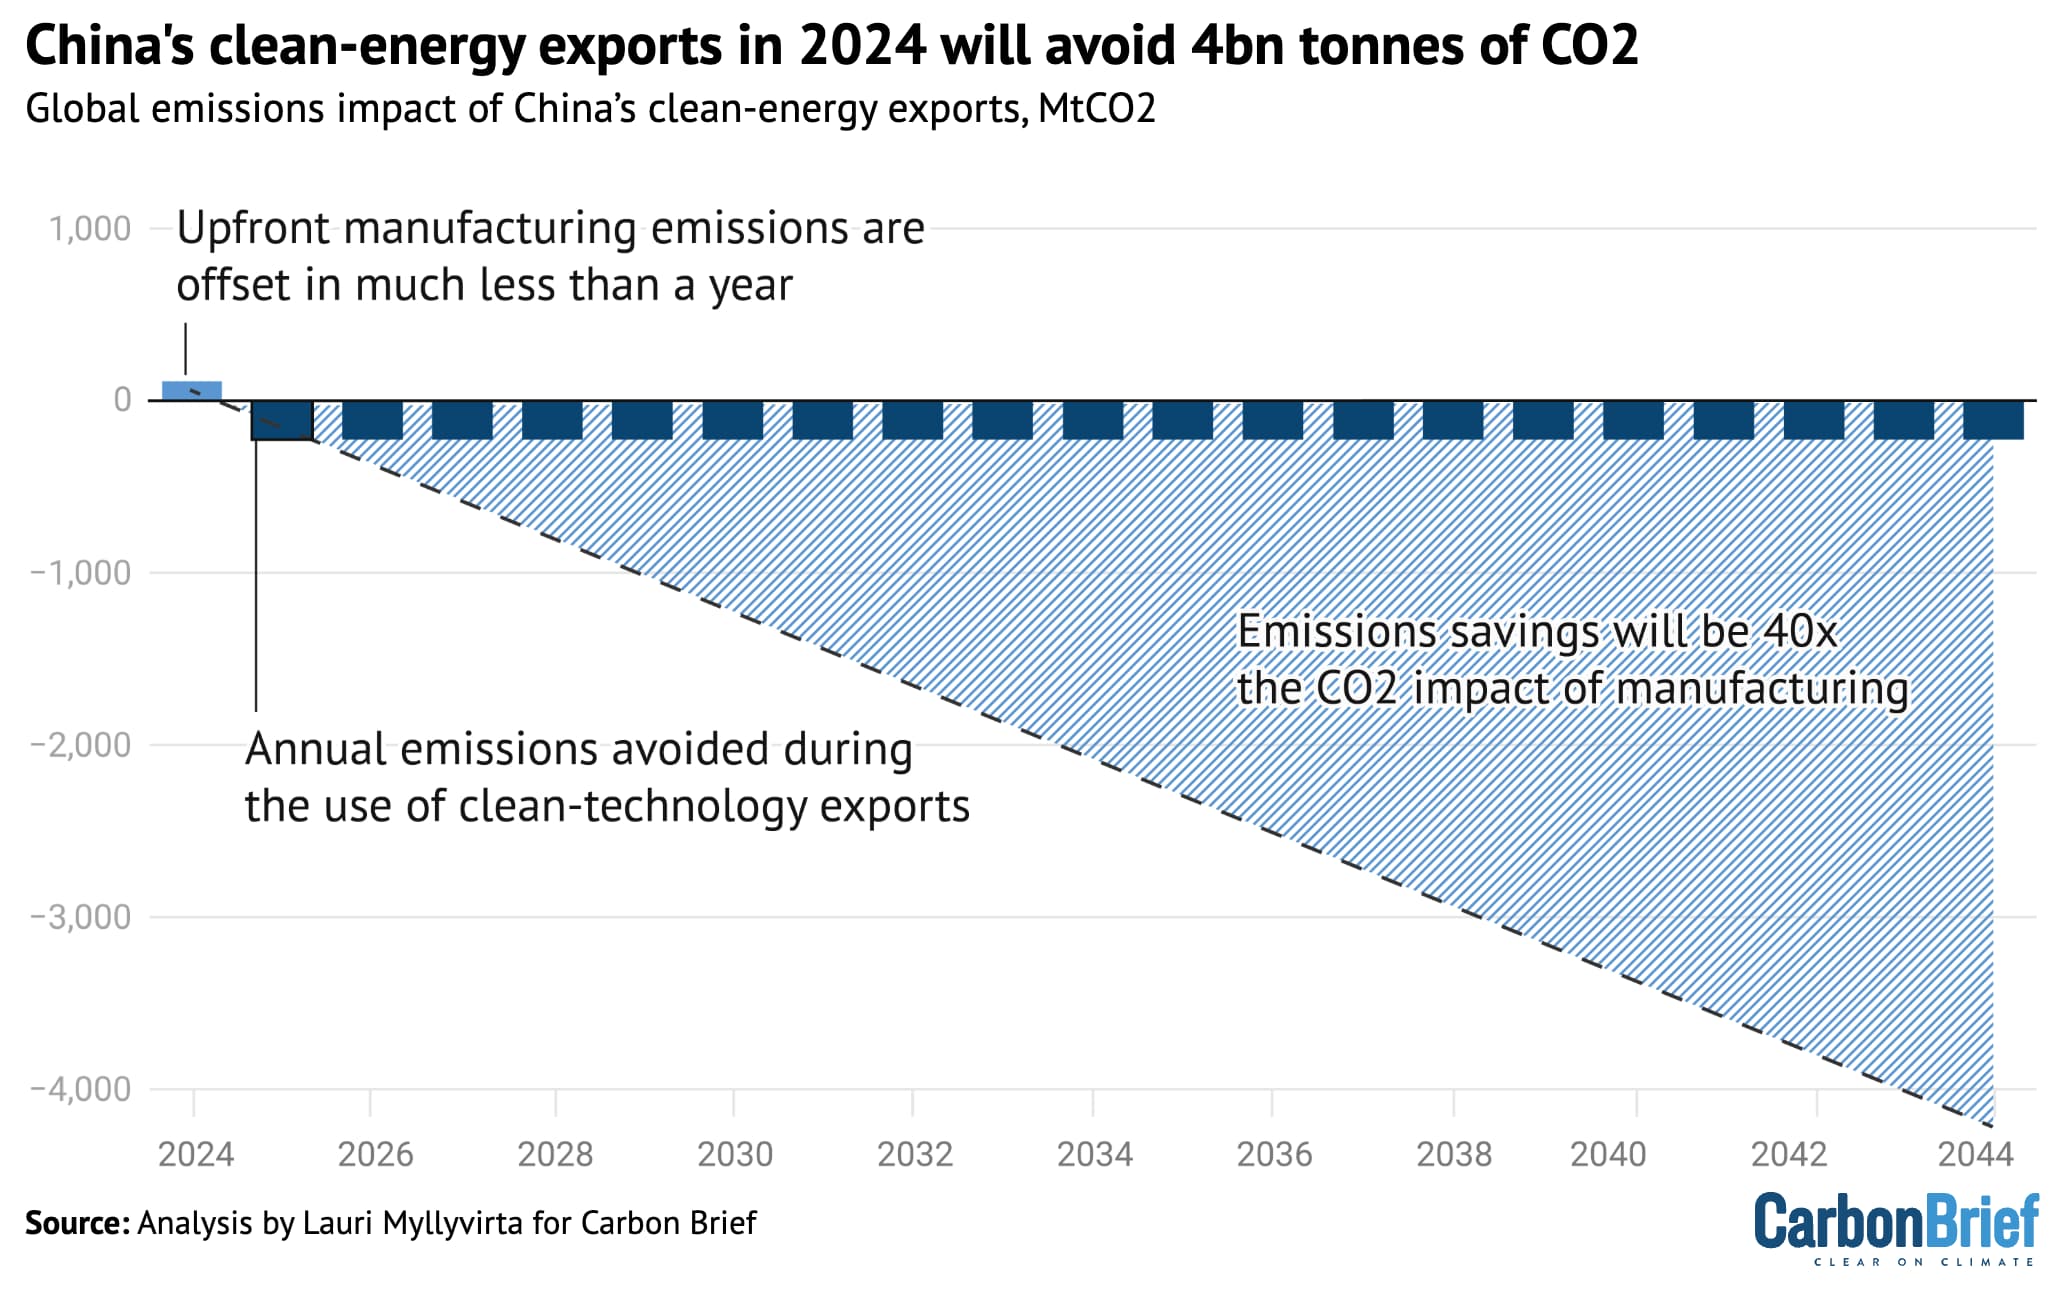
Emissions associated with the production of China’s clean-technology exports in 2024 and the annual emissions avoided during their use (columns), as well as the cumulative impact on global emissions over the lifetime of these products, MtCO2. Source: Analysis by Lauri Myllyvirta for Carbon Brief.
The CO2-saving impact of these exports – from just one year – will compound together with emissions savings from China’s past and future shipments of clean-energy equipment.
For example, its EV exports increased by 33% in the first five months of 2025, compared with the same period in 2024, showing the potential for further growth.
Solar panel exports held steady – despite a massive spike in domestic demand – and are likely to grow in the coming years given projected growth in global capacity installations.
Looking beyond direct equipment exports, overseas clean-energy investments announced by Chinese companies in 2023-24 – building solar panel manufacturing plants, for example – will generate another 90MtCO2 of avoided emissions per year, once the projects have been built.
In addition, overseas clean-power generation projects announced by Chinese investors in 2023-24 would save another 40MtCO2 per year.
In terms of technologies, the largest avoided emissions result from solar, at 280MtCO2, followed by batteries and EVs at 50MtCO2, as shown in the figure below. Wind turbine exports are relatively small, avoiding another 20MtCO2.
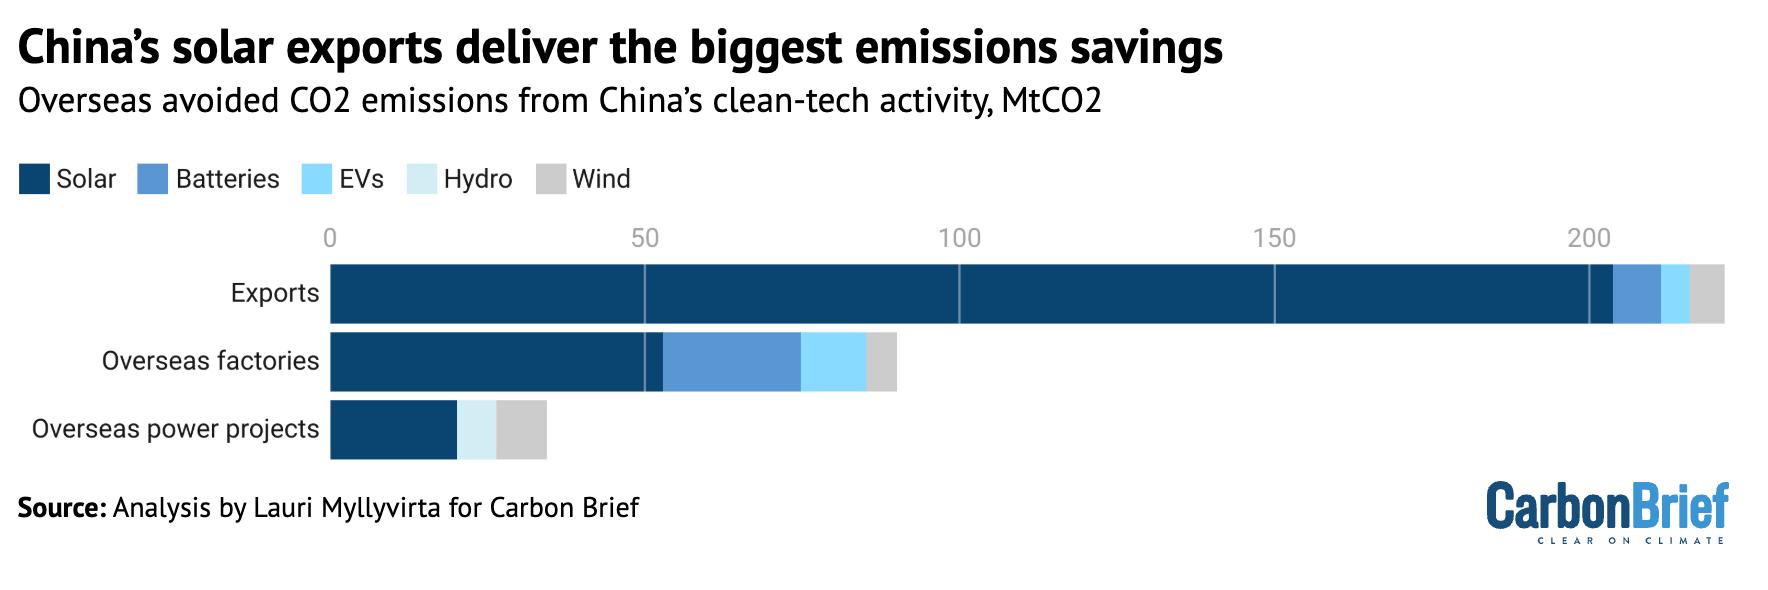
CO2 emissions avoided overseas as a result of China’s clean-technology exports in 2024 and investments in 2023-24, MtCO2, broken down by technology and type of activity. Source: Analysis by Lauri Myllyvirta for Carbon Brief.
China’s overseas clean-energy footprint
Both economically and in terms of emissions reductions, exports of clean-energy equipment dominate China’s overseas footprint.
Equipment exports in 2024 were worth a total of $177bn, whereas across 2023 and 2024, Chinese firms announced overseas clean-energy manufacturing projects worth $58bn, as well as overseas power generation and storage deals worth $24bn.
(Note that these figures do not include Chinese-backed overseas fossil-fuel developments, including coal-fired power plants, which China has pledged to stop supporting.)
Once in operation, the Chinese owned or funded overseas clean-energy developments will help avoid 130MtCO2 of emissions, with 80Mt from solar, 35MtCO2 from EVs and batteries, as well as 13MtCO2 from wind and 6MtCO2 from hydropower.
Looking at this total another way, the avoided CO2 emissions from clean-energy equipment produced in Chinese factories overseas will amount to 90MtCO2, while its financing of clean-power generation will avoid an estimated 40MtCO2.
In contrast, avoided emissions from clean-energy equipment exported from China in 2024 will amount to an estimated 220MtCO2 per year.
China’s clean-energy footprint spans essentially the entire world, with exports to 191 of the 192 UN member states, excluding China, manufacturing plans in 25 countries in 12 of the 17 UN regions and clean-energy project financing in 27 countries in 11 regions.
Some countries and regions do stand out, however, as shown in the map below.
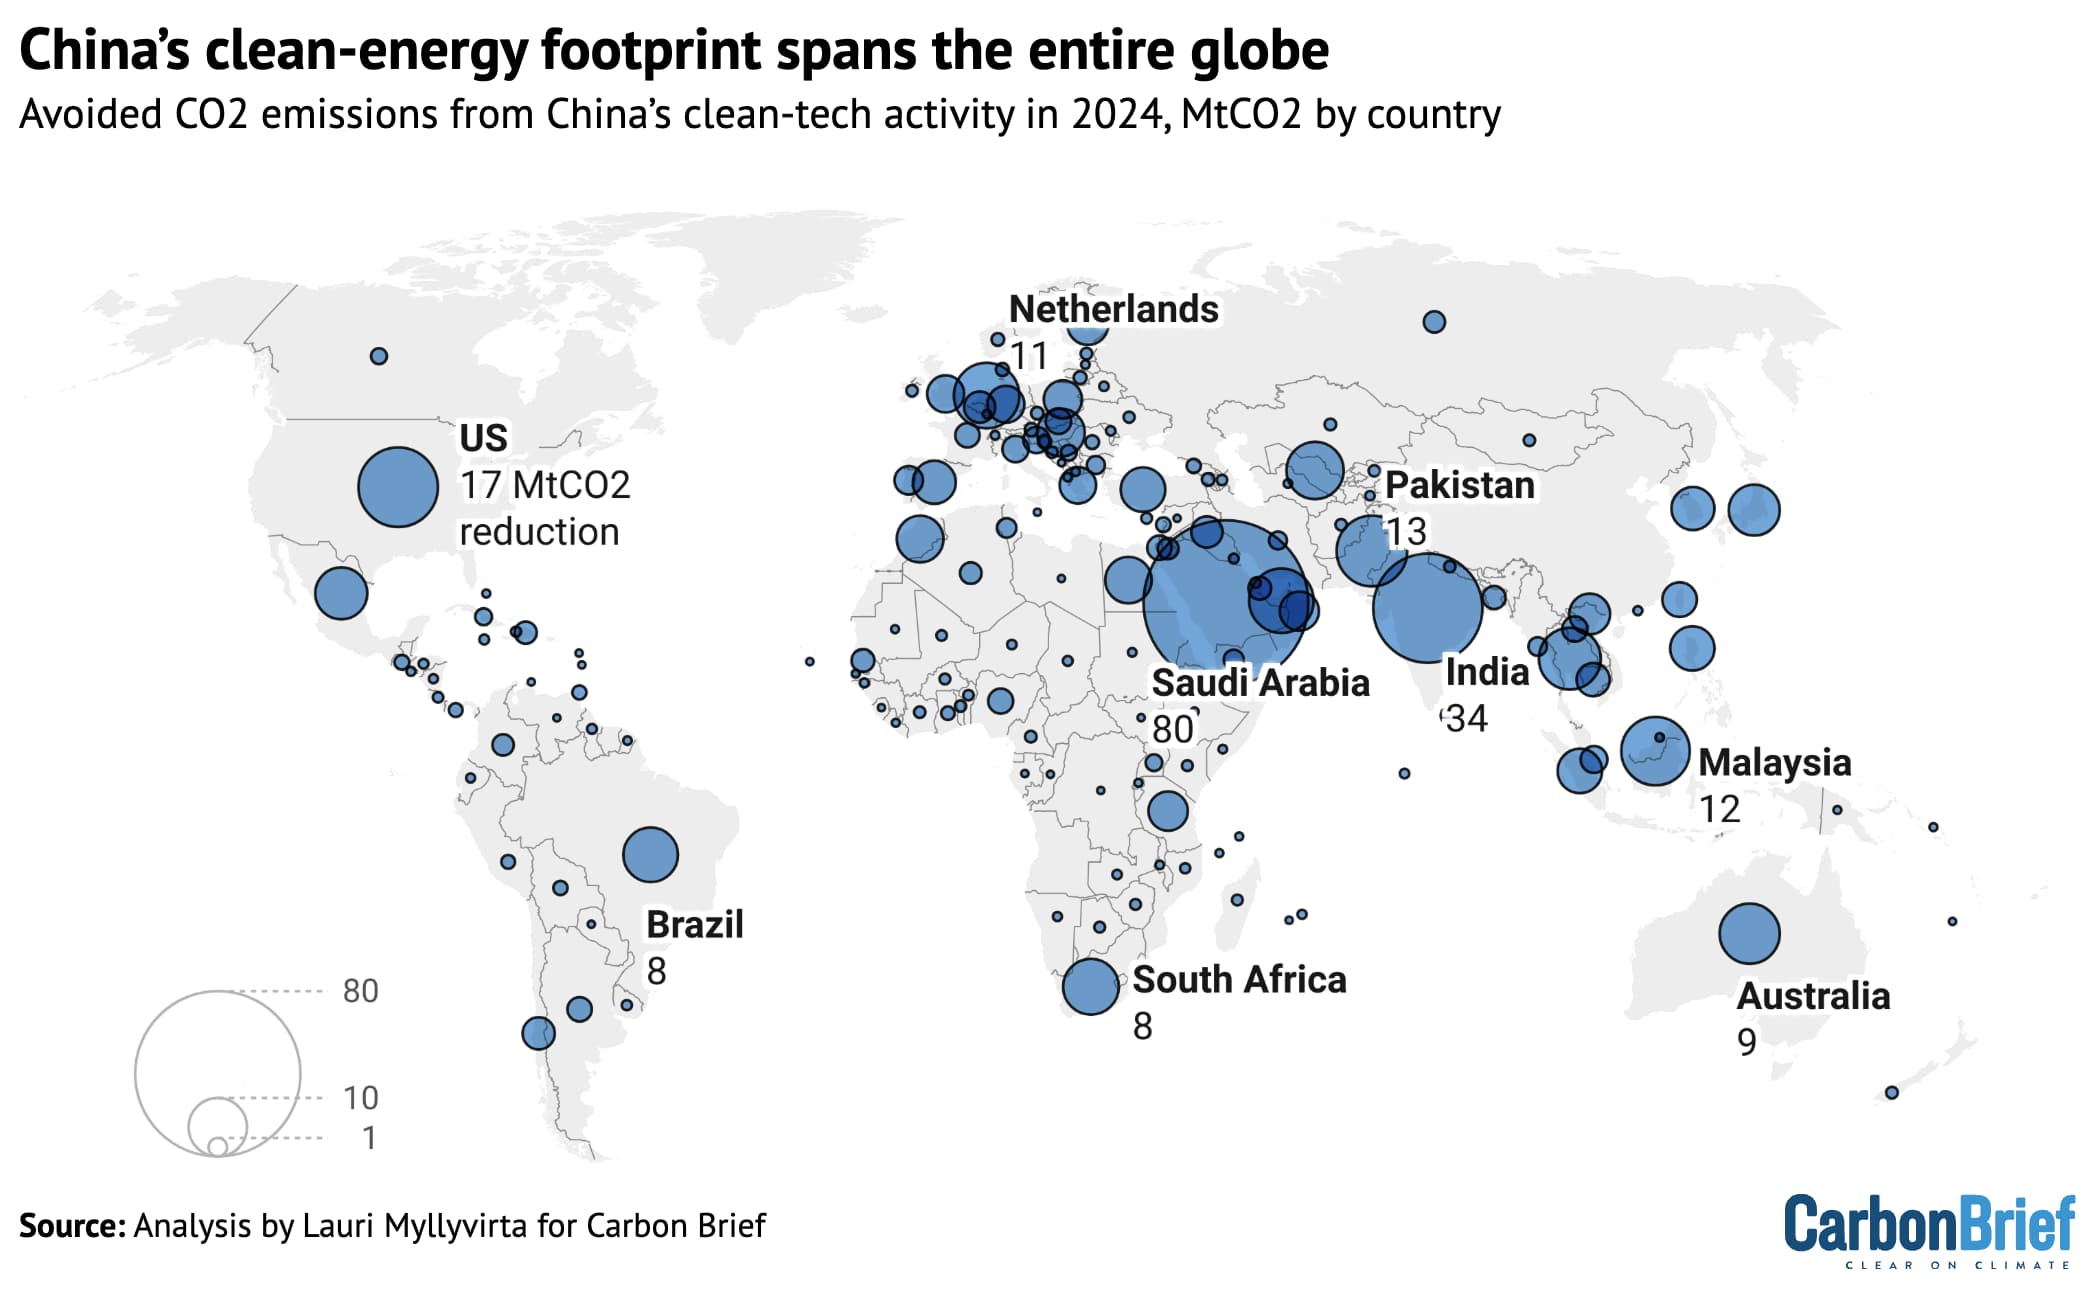
Avoided CO2 emissions from China’s clean-tech activity in 2024, MtCO2 by country. Source: Analysis by Lauri Myllyvirta for Carbon Brief.
In terms of resulting emission reductions, the largest destinations for China’s overseas clean-energy activity are south Asia and the Middle East and north Africa (MENA) region.
This reflects both the large volumes of Chinese clean-technology activity reaching these countries and their highly carbon-intensive power grids, which means that installing new solar panels offsets high-emissions generation, for example.
(By the same logic, driving a Chinese EV in these countries would have smaller climate benefits than with lower-carbon electricity. See: How avoided emissions are calculated.)
Solar exports to South Asia have boomed, with Pakistan the single largest market. Pakistan’s electricity shortages and increasing affordability of solar have prompted consumers to install.
The same dynamic has played out in South Africa, which also features in the top 10 countries where China’s exports are resulting in avoided emissions (left panel in the figure below).
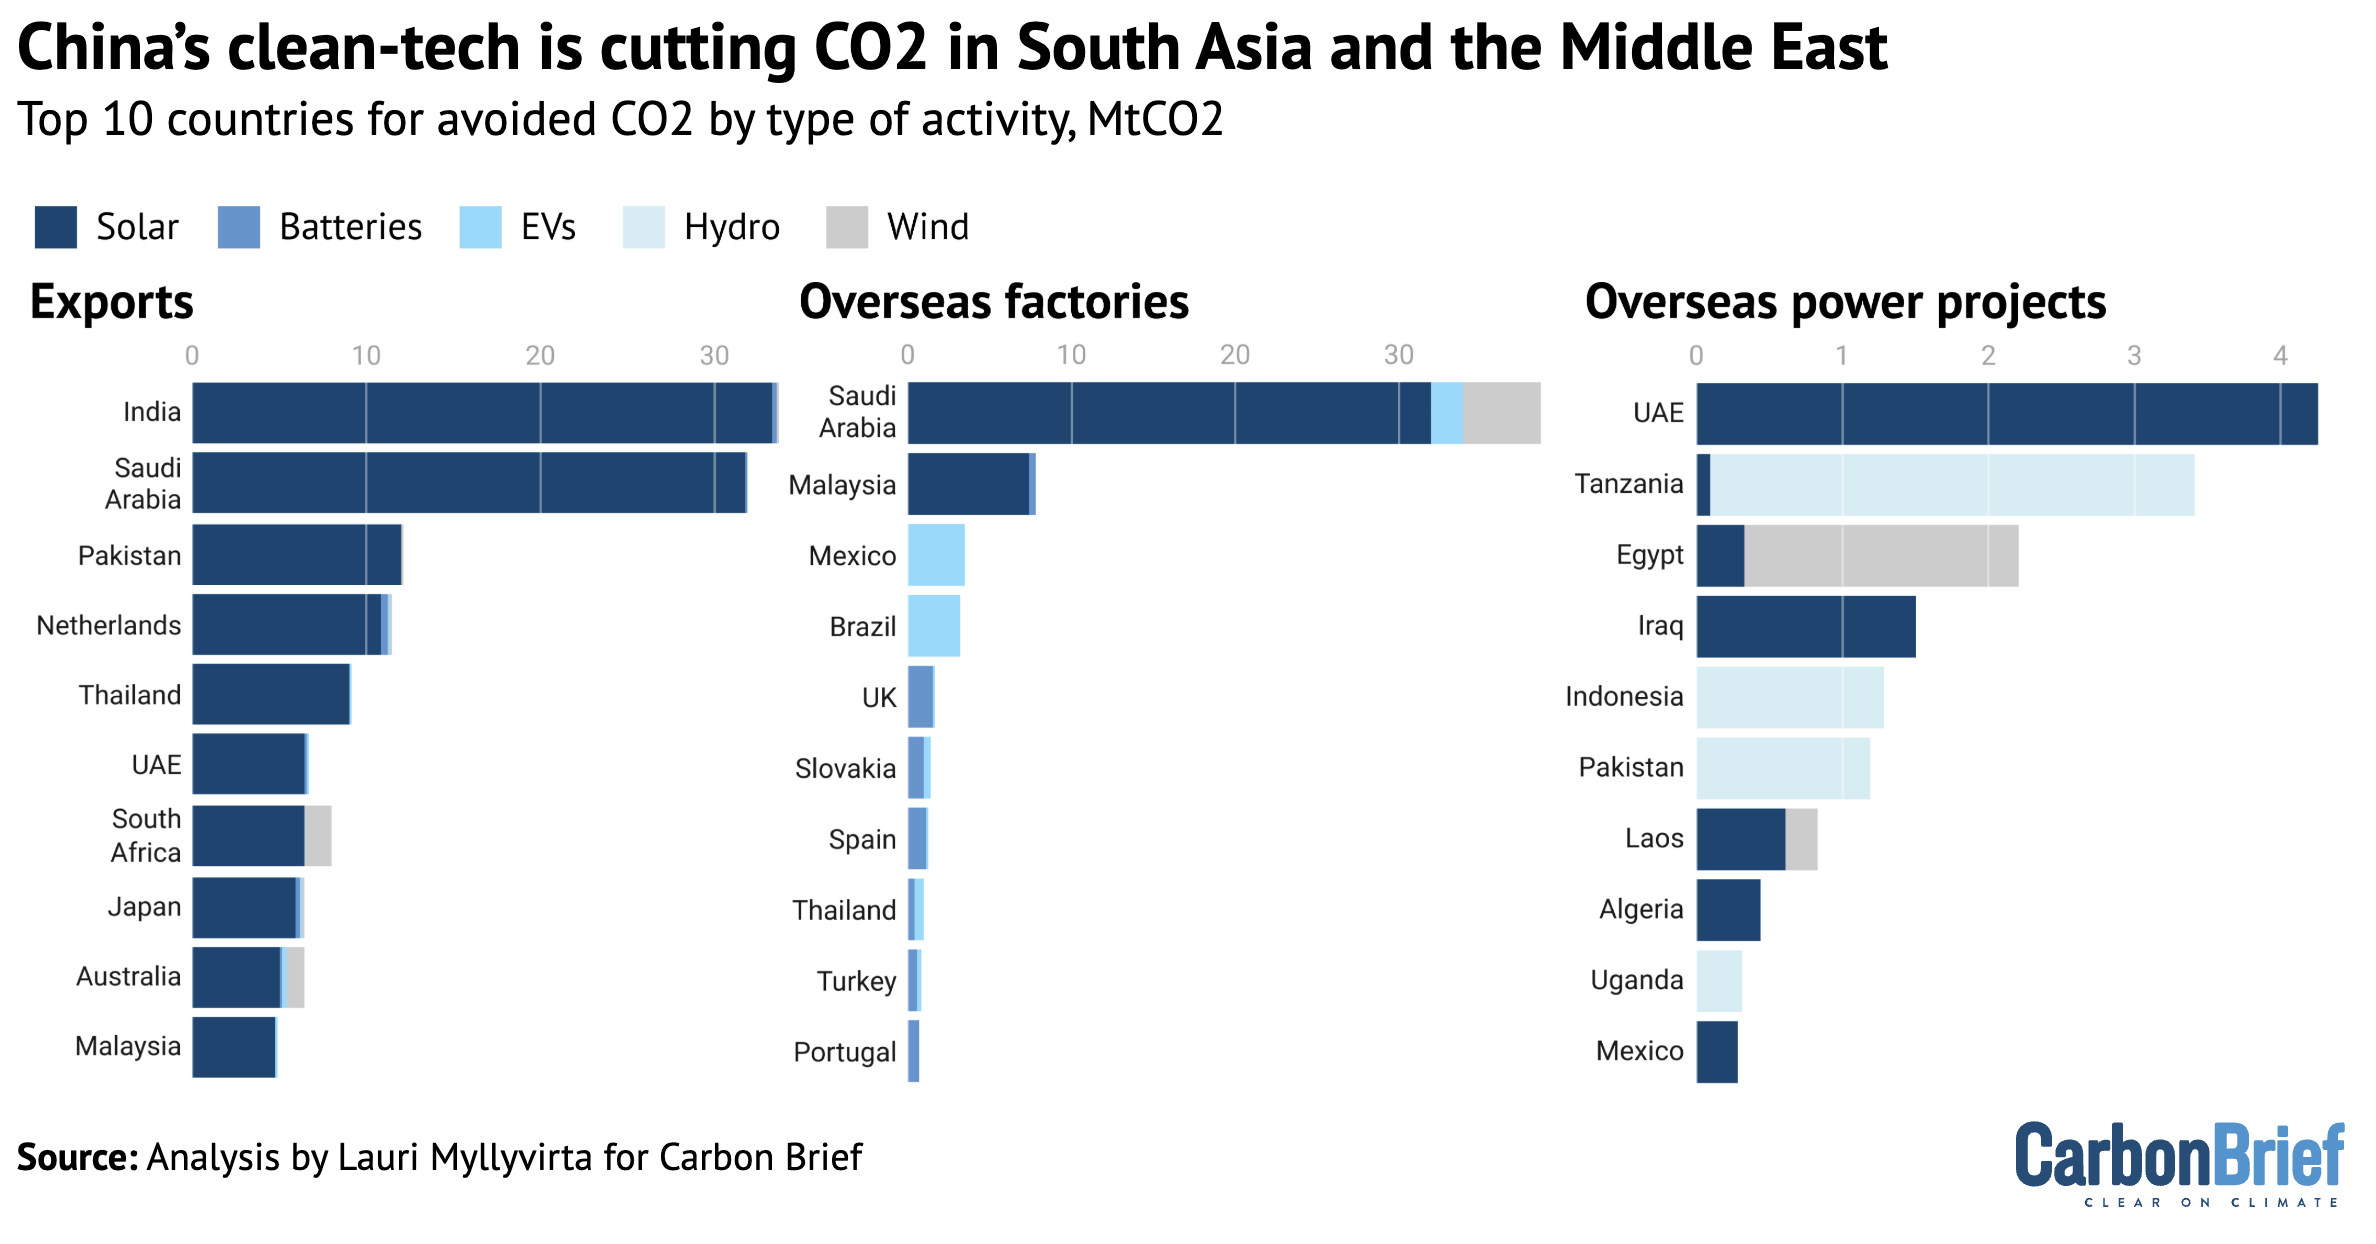
Top 10 countries for avoided CO2 emissions from China’s overseas engagements, by type of activity and technology, MtCO2. Source: Analysis by Lauri Myllyvirta for Carbon Brief.
Assuming that all the overseas financing deals announced in 2023–24 are realised, the MENA region will see the largest avoided emissions due to China’s overseas clean-energy activity, resulting from a combination of solar panel exports, manufacturing and financing deals.
This includes eight solar and two wind power generation projects with a total capacity of 10 gigawatts (GW), in Egypt, Algeria, UAE, Saudi Arabia, Iraq and Tunisia.
On the manufacturing side, Saudi Arabia is the main destination, with a major EV production facility, two solar factories and one for wind turbines. There are also a total of five battery manufacturing projects in Morocco and Oman.
OECD Europe is the largest destination for China’s exports and overseas manufacturing investments by value. However, relative to the volume of exports, the resulting CO2 savings are smaller than in other major destinations, due to lower carbon intensity of power generation.
The countries in the European region with the largest resulting emissions reductions are the Netherlands, Turkey, Spain, the UK, Poland and Germany.
Imports of solar power equipment are the largest category. Germany is an exception, where imports of EVs and batteries are even more significant, as is the UK, where a major battery manufacturing project could deliver larger emission reductions.
Turkey and Spain also have clean-energy manufacturing projects with Chinese involvement, while both Turkey and Germany imported wind power equipment from China in 2024.
In south-east Asia, China’s clean-energy footprint is the largest in Malaysia, Thailand, the Philippines, Indonesia and Vietnam. Solar manufacturing plans play the largest role in Malaysia, while imports of solar power equipment are the largest category in the other countries.
Chinese financing for solar and wind power generation projects, with a total capacity of 3.7GW, plays a significant role in the Philippines and Laos, as does financing for a hydropower project in Indonesia. Vietnam imported batteries and wind turbines in addition to solar power equipment in 2024. Chinese companies also have plans for EV and battery manufacturing in Thailand, Indonesia, Malaysia and Vietnam.
Regional emissions set to be cut by up to 4.5% a year
Another way to look at the impact of China’s clean-energy exports and investments is to consider the avoided CO2 relative to the total emissions in each region. This highlights where China’s overseas clean-energy footprint is having the biggest impact, in relative terms.
The figure below illustrates the distinction. For each region, longer bars indicate larger avoided emissions in absolute terms, whereas the furthest dots point to the biggest relative impacts.
On a relative basis, sub-Saharan Africa stands out, in addition to MENA. Specifically, China’s clean-energy exports in 2024 alone, with investments from 2023 and 2024, are set to cut annual emissions in sub-Saharan Africa by around 3% per year – and by around 4.5% in MENA.
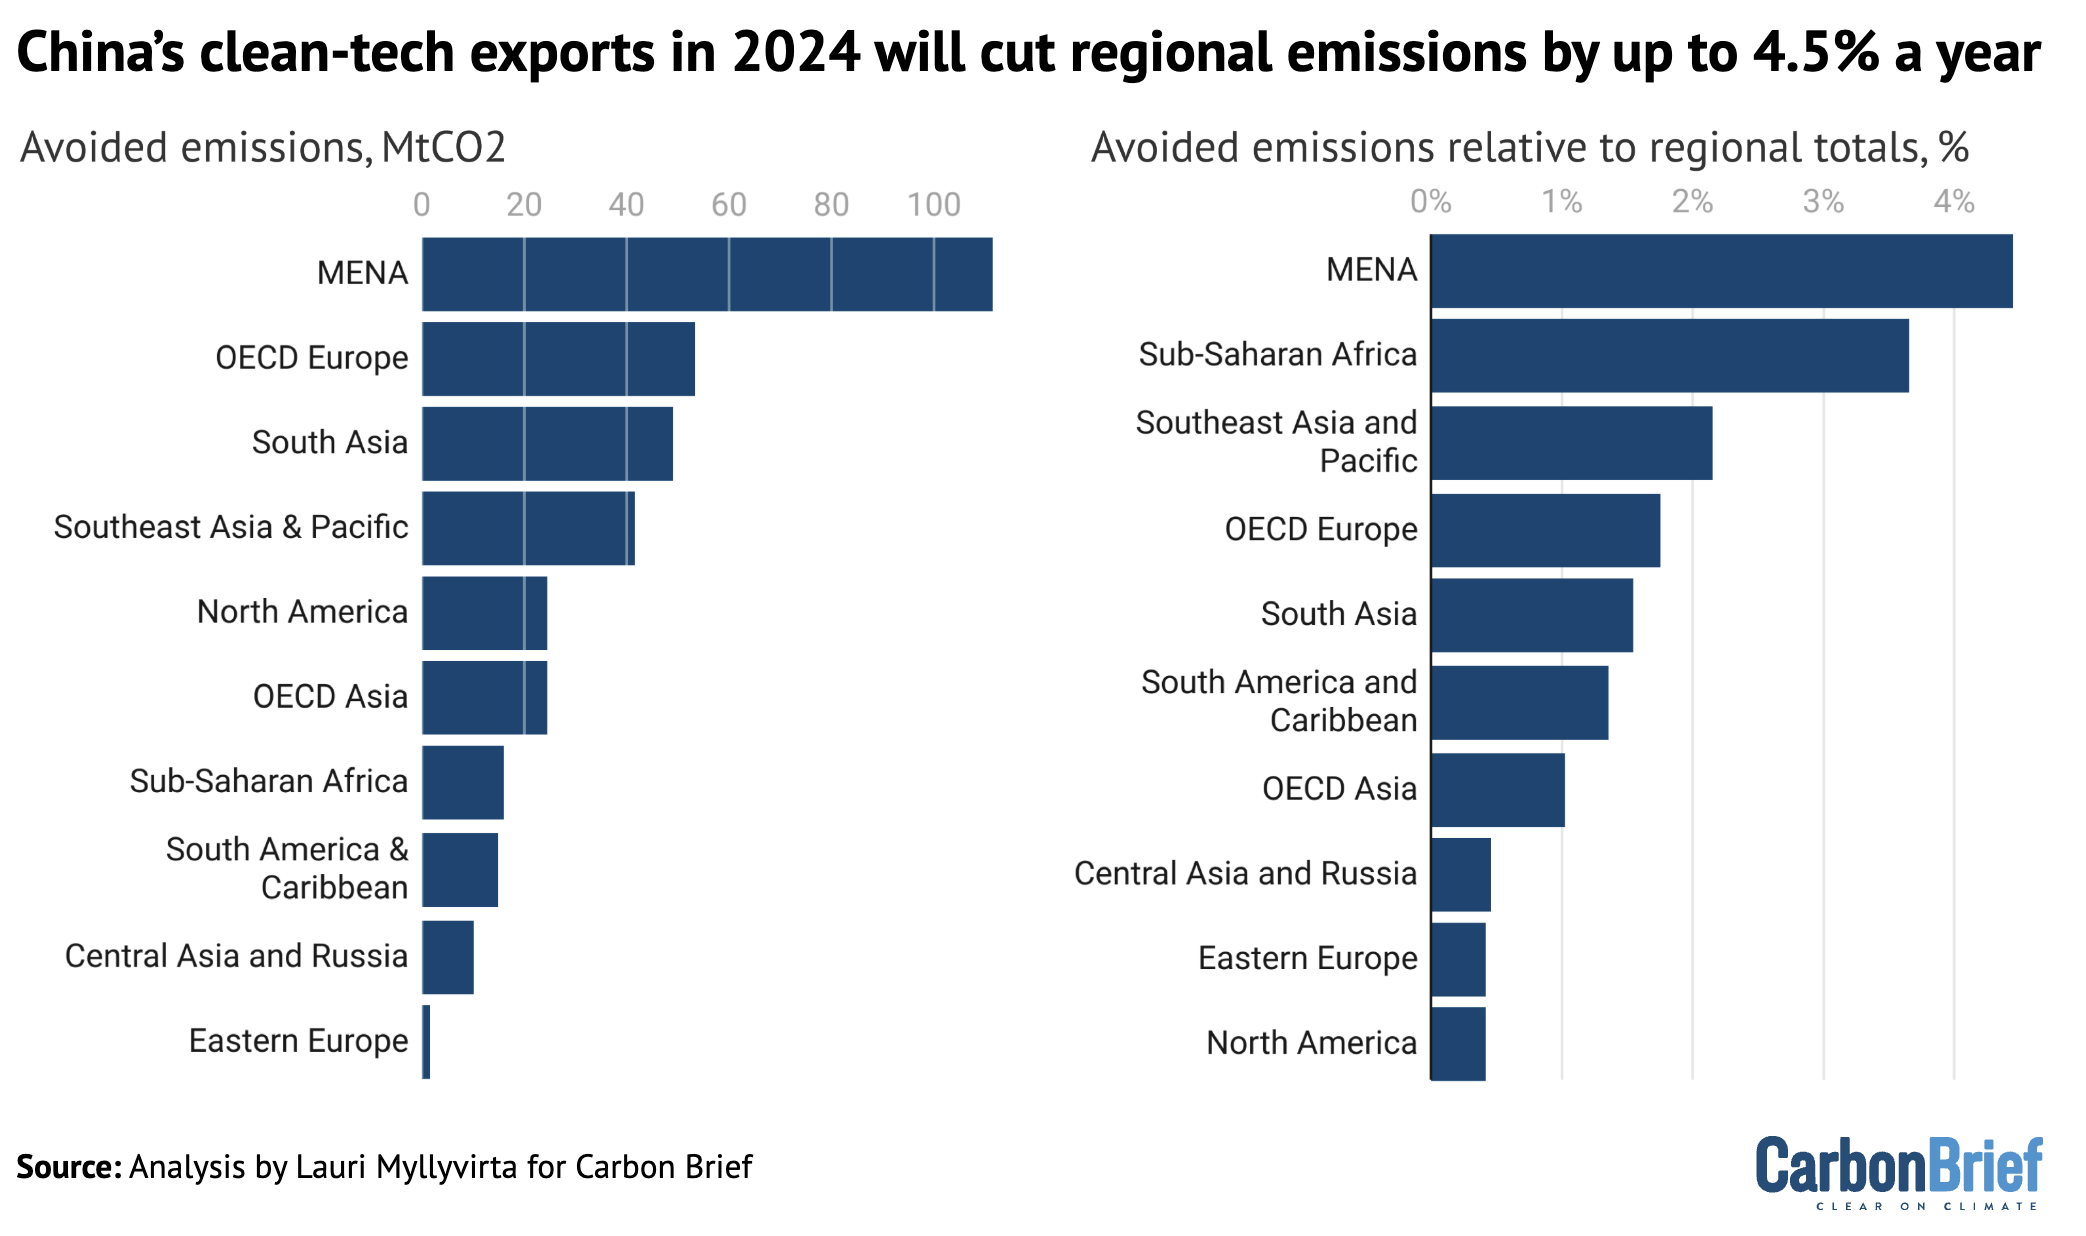
Left: Avoided CO2 emissions from China’s overseas engagements, MtCO2 per year. Right: Avoided emissions per year relative to regional totals, %. Source: Analysis by Lauri Myllyvirta for Carbon Brief.
For sub-Saharan Africa, this relative measure of impact indicates that the solar power uptake in the region is rapid, in relation to the size of the region’s electricity systems.
The largest markets for China’s overseas clean-energy activity in the region are South Africa, Tanzania, Nigeria and Senegal.
China’s footprint in these countries is dominated by solar exports, except for Tanzania, where financing for a hydropower project and a small solar project make up most of the projected emission reduction. There are also significant wind power equipment exports into South Africa.
China’s role in global clean-energy supply chains
In 2024, clean-energy industries contributed more than 10% of China’s GDP for the first time, generating an estimated total economic output of $1.9tn.
This milestone underscores the scale of China’s clean-energy economy and its dominant role in the global manufacturing of solar panels, batteries and EVs.
On the surface, this may suggest that other countries have limited economic opportunities in clean energy. However, a closer examination reveals a more nuanced picture.
China’s involvement in global supply chains is still largely limited to exports and manufacturing, while most of the value is downstream.
For instance, a solar panel now accounts for approximately one-quarter of the total value of a utility-scale solar power plant. IRENA reported a global weighted average investment cost of $758 per kilowatt (kW) of capacity for utility-scale solar and an average module cost of $261/kW in 2023, or 34% of the total.
Module prices fell by 35% in 2024, further reducing the share of modules in total project costs. In the case of rooftop installations, which represented 43% of all newly added solar in 2023, the total investment costs are approximately 80% higher, implying a much lower share of the modules in overall costs.
Similarly, batteries exported at 2024 prices represent only about a quarter of the value of the EVs into which they are integrated. The average export value of a Chinese pure electric passenger vehicle was $22,000, calculated based on values and volumes in China Customs data. At a battery pack cost of $94 per kilowatt hour (kWh) of capacity, an average-sized 63kWh battery pack will cost a quarter of this. Out of the average retail price of an EV in Europe, some €46,000, the battery pack will make up only a sixth of the cost.
These figures highlight a key point: most of the economic value in clean energy lies downstream – in project development, system integration, installation and end-user services – rather than in upstream manufacturing, where China dominates.
In 2024, China exported $177bn worth of solar panels, EVs, batteries and wind turbines, making up roughly 5% of its total exports. If China maintains its current global market share, this figure could rise significantly.
(These exports could reach $1.1tn by 2035, according to a recent analysis by the Centre for Research on Energy and Clean Air (CREA) – driven primarily by a projected 12-fold increase to 2035 in the global EV market outside China – under the International Energy Agency’s 1.5C-compatible net-zero emissions by 2050 scenario.)
Trumping the $177bn value of the exports from 2024, however, the downstream value of overseas clean-energy products and projects relying on Chinese components is an estimated $720bn annually, four times the value of the exported raw components.
This includes the value of solar and wind power plants built using Chinese modules and turbines, as well as the revenue from the sales of EVs using Chinese batteries and battery materials.
Further investment in overseas manufacturing – Chinese companies building solar, battery and EV plants abroad – could lift this downstream value to an estimated $1.2tn annually.
China’s outsized role in upstream clean-energy manufacturing creates potential supply chain vulnerabilities that many countries will want to address, by diversifying supply sources and strengthening domestic capabilities.
However, China’s dominance is not synonymous with capturing the majority of the economic value in global clean-energy development. Rather, it reflects a strategic advantage in segments that other economies have often neglected, due to low value and profitability.
Implications of China’s expanding footprint
China’s rapid expansion in clean-energy manufacturing and exports is already reshaping emissions trajectories in several key regions.
In particular, markets in MENA and sub-Saharan Africa – where domestic clean-energy industries remain nascent – have benefited from lower costs and improved access to technology through Chinese imports. This dynamic has helped accelerate clean-energy deployment and shift emissions outlooks downward in these regions.
At the same time, China’s central role in global supply chains has raised concerns over supply security. Many countries are now taking steps to diversify their sourcing of key components such as solar panels, batteries and EVs.
However, given the scale and cost advantages of China’s clean-energy manufacturing sector, its products are likely to remain a large part of the global clean-energy landscape for the foreseeable future.
Economically, China’s footprint is more narrowly focused on upstream manufacturing. As clean-energy deployment continues to expand globally, there is significant potential for Chinese firms to increase their participation in downstream activities – including infrastructure development, operations and maintenance – capturing a larger share of value-added abroad.
These dynamics also reinforce China’s strategic interest in the continuation and acceleration of the global clean-energy transition.
As global demand for clean-energy technologies grows, Chinese industries stand to benefit from increased export volumes.
This economic incentive is beginning to translate into diplomatic engagement. In recent public remarks, for example, President Xi Jinping emphasised China’s role in advancing the clean-energy sector, suggesting a potential shift toward more proactive international positioning on climate and clean energy.
How avoided emissions are calculated
The manufacturing of solar panels and EV batteries is energy- and carbon-intensive, resulting in upfront carbon emissions from manufacturing.
In the case of exports and overseas manufacturing, the avoided CO2 emissions depend on the CO2 intensity of the power grid in the country where the equipment is used.
The left-most shape in the figure below shows the CO2 intensity of electricity generation in countries taking clean-energy exports from China. The width of the shape indicates the share of exports, by value, going to countries with a given carbon intensity.
The bulge in the shape shows that on average, China exports clean-energy equipment to countries with a lower CO2 intensity of power generation than its own grid (dashed line).
This increases the CO2 emission reductions from battery and EV exports, relative to using these products in China, but reduces them from solar panel and wind turbine exports.
Specifically, the average CO2 intensity of electricity in China’s export markets in 2024, weighted by value, was 395 grams of CO2 per kWh (gCO2/kWh), compared to 580gCO2/kWh in China.
The centre and rightmost shapes in the figure below illustrate the equivalent distributions for countries hosting Chinese overseas manufacturing and project financing.
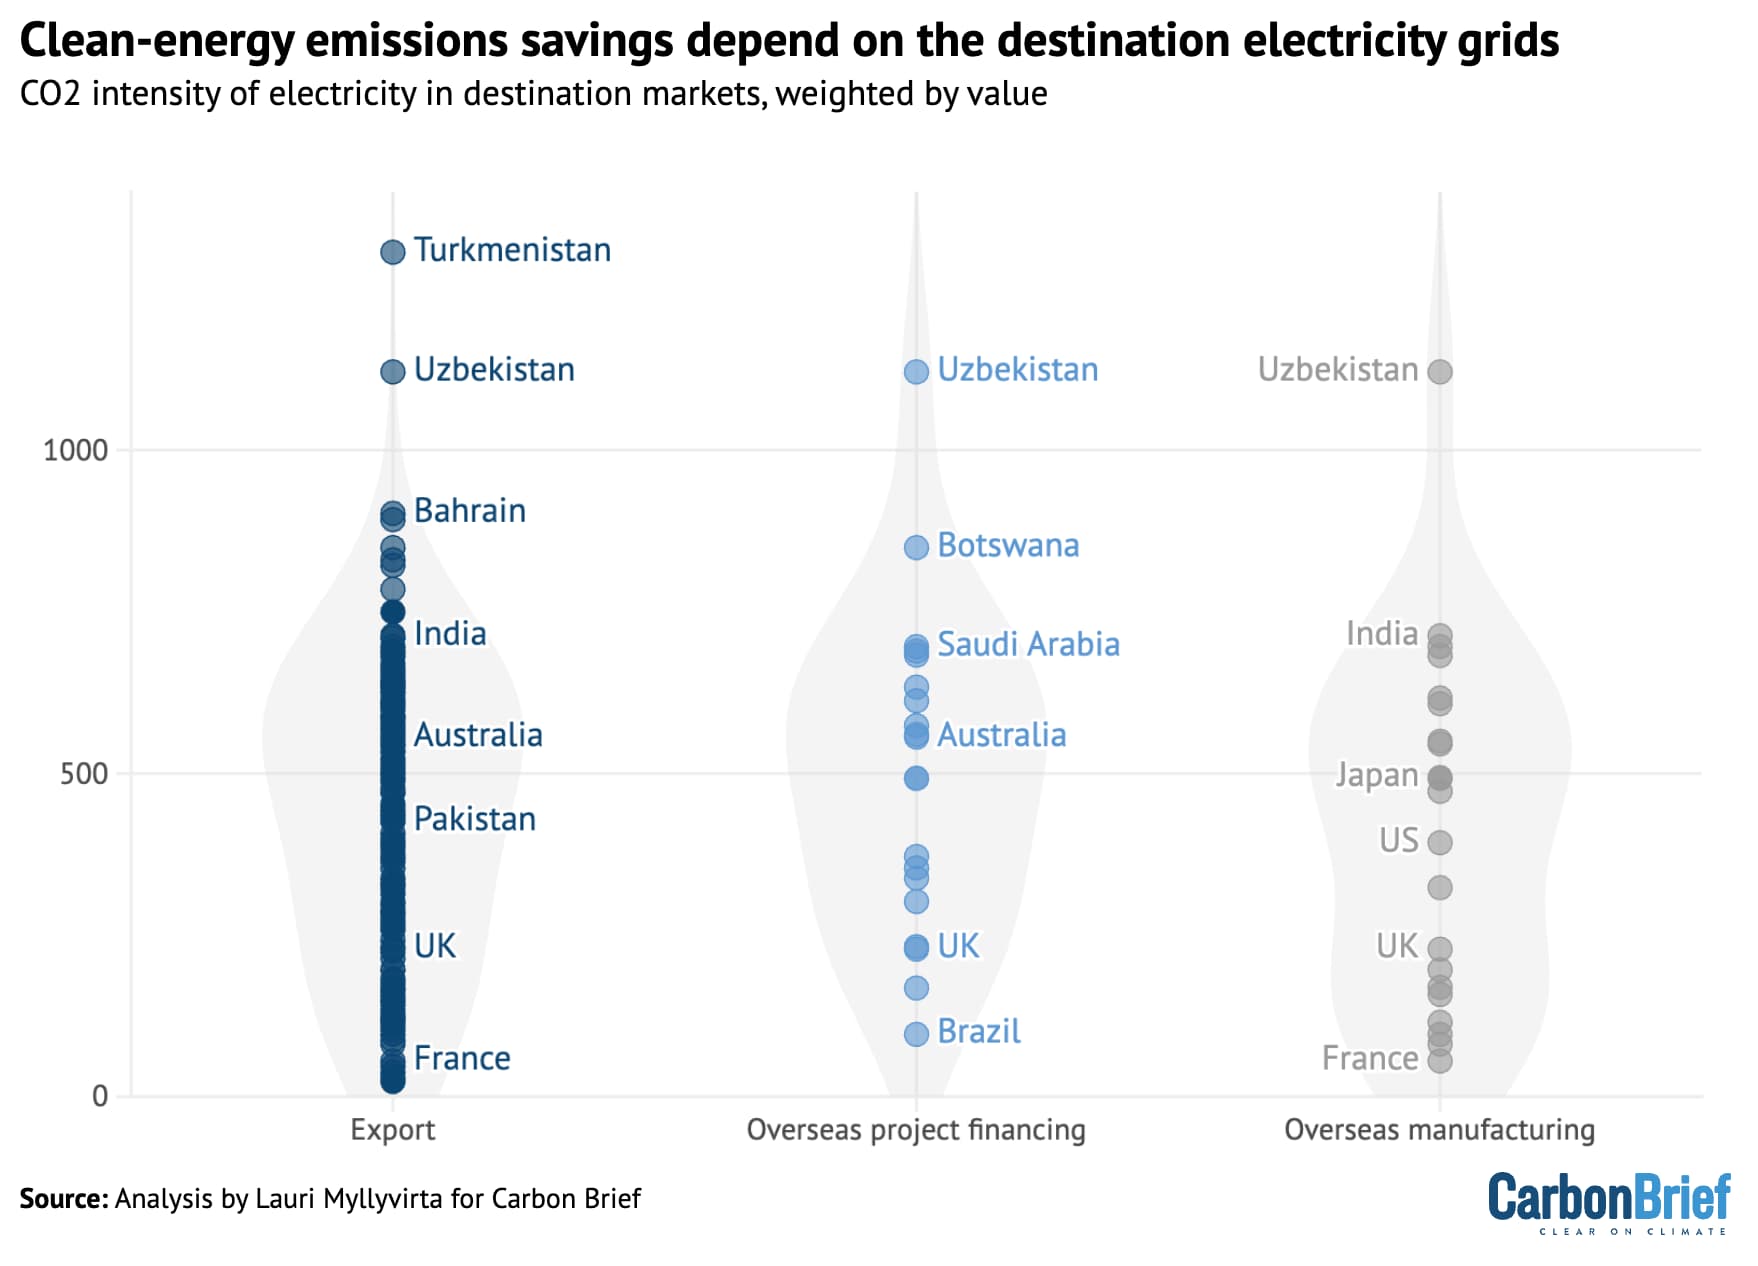
CO2 intensity of electricity generation in destination markets for China’s clean-energy exports, overseas manufacturing and project finance, weighted by the value of the relevant engagements. Dashed line shows China’s CO2 intensity. Source: Analysis by Lauri Myllyvirta for Carbon Brief.
Based on the country-by-country CO2 intensities and the volume of different clean-energy exports from China, the emissions associated with manufacturing these products are, on average, offset in less than a year of operation.
Chinese solar panels pay back their upfront manufacturing emissions in four months, on average, while wind turbines take two years and EVs and batteries three years.
There is, however, wide variance between different destinations.
For example, EVs exported to the countries with the most carbon-intensive power generation, such as Uzbekistan or Botswana, result in no reduction in CO2 emissions from their operation under current conditions. These countries would need to achieve substantial reductions in the carbon intensity of their power system to realise emissions reductions from the use of EVs.
On the other hand, EVs exported to countries with very clean grids can pay back their upfront CO2 emissions in less than a year.
Similarly, solar panels and wind turbines exported to countries where power generation is already almost fully decarbonised, such as Sweden or Ethiopia, result in no emission reductions, when assessed using the average carbon intensity of power generation.
However, this does not tell the whole story because solar and wind exports to such countries could prevent increases in power generation from fossil fuels in response to growth in demand.
Much of China’s overseas manufacturing investment, though not all, is in markets with a lower average CO2 intensity of power generation than in China itself, which shortens the CO2 payback time from clean-energy equipment produced by those overseas manufacturing plants.
In the case of calculating avoided emissions from plug-in hybrid vehicles (PHEVs), a major question is how much they are driven with electricity and how much with fuel.
PHEVs are likely to be driven more on fuel in markets with weaker charging infrastructure and weaker incentives for using electricity. For simplicity, this analysis assumes a 50-50 split in all markets. Improving infrastructure and incentives would increase the emissions savings from existing and new PHEVs, as well as likely increasing the share of full EVs in new sales.
About the data
Data on China’s exports by country are taken from China Customs. Trans-shipments from the mainland through Hong Kong are treated as exports from China, with data on Hong Kong’s international trade – which is reported separately – taken from UN COMTRADE.
The product categories used in the analysis are as follows:
EVs: electric and hybrid motor vehicles, including freight, public transport and tractors (HS codes 870122, 870123, 870124, 870220, 870230, 870240, 870340, 870350, 870360, 870370, 870380, 870441, 870451, 870460).
Battery: Lithium-ion accumulators and primary lithium cells (850760, 850650).
Solar: PV generators, photovoltaic cells, solar panels, solar-grade silicon and inverters (850171, 850172, 854140, 854142, 854143, 854149, 854150, 850440, 280461, 381800).
Wind: Wind-powered electric generators (850231).
Data on overseas manufacturing and power generation deals is taken from a mapping project by Climate Energy Finance.
Emission reductions from solar panels and wind turbines were calculated using the average utilisation – sometimes referred to as the “capacity factor” – of each technology in the destination country, along with its average CO2 intensity of power generation in 2024, both taken from Ember data.
This is a conservative assumption, as new solar and wind will mainly replace fossil-fuelled power generation, resulting in higher emission reductions in countries where fossil fuels make up a small share of total power generation.
Emission reductions from EVs and plug-in hybrids were calculated using the following assumptions for the size of the battery pack in kilowatt hours (kWh), the mileage, the emissions of an internal combustion-engine (ICE) alternative and the fuel use per 100km:
| BEV | PHEV | Heavy-duty vehicle (buses and trucks) | |
|---|---|---|---|
| Battery pack, kWh | 63 | 15 | 350 |
| Mileage, km/year | 15,000 | 15,000 | 80,000 |
| ICE emissions, g/km | 230 | 230 | 800 |
| EV electricity and fuel use, per 100km | 21kWh | 15kWh + 4 litres | 150kWh |
Emission reductions from battery exports are calculated assuming that the batteries are installed in BEV and PHEV passenger vehicles, with an equal split.
Combustion-engine vehicle CO2 emissions are estimated based on average real-world fuel efficiency and CO2 emissions from petrol and biofuel production, as well as from combustion.
Annual mileage for passenger vehicles is based on data for China, the EU and the US, while it is based on US data for heavy duty vehicles. Upfront manufacturing emissions from EVs are the additional emissions compared with building a fuel-burning vehicle.
The value of solar projects using Chinese equipment is based on averages for total investment costs in 2023 from IRENA, adjusted for the reported 35% fall in module costs in 2024.
As the IRENA cost data is for utility-scale solar, the average across the utility-scale and distributed segments, such as rooftops, is estimated assuming that rooftop installations have 80% higher costs and make up a share of 43% of all newly added solar, based on data for 2023.
The total volume of solar equipment and materials exports from China in 2024 is conservatively calculated based on the reported value of solar module exports from China Customs and module export volume, as well as estimating the volume of the exports of polysilicon, wafers and solar cells using the same average value per GW as for solar modules.
The value of EVs sold overseas using Chinese batteries is estimated based on the total value of the EV market by region and market share of Chinese batteries and battery materials globally.
The market share in the overseas market is calculated based on 2024 power battery installations in China and globally, assuming that the market share of Chinese battery materials is 100% in China. The value of EVs exported from China is subtracted from this value to avoid double counting.
CO2 emissions from overseas manufacturing were calculated using the above estimates for emissions from production in China, adjusted to the average intensity of power generation in the host country.


The post Analysis: China’s clean-energy exports in 2024 alone will cut overseas CO2 by 1% appeared first on Carbon Brief.
Analysis: China’s clean-energy exports in 2024 alone will cut overseas CO2 by 1%
Climate Change
A Hunger Strike Ends, but an ‘Unreasonable’ Woman’s Battle Against Corporate Polluters Marches On
Four decades into her crusade against Texas petrochemical plants, a retired shrimper remains determined to fight Dow, the largest chemical company in America.
The Resistance, Part 1: With an army of lawyers, an activist legend squares off against polluting industries along the Texas coast she calls home.
A Hunger Strike Ends, but an ‘Unreasonable’ Woman’s Battle Against Corporate Polluters Marches On
Climate Change
Cancer Rates Are Higher Near Large Livestock Feeding Operations in 3 States, a New Study Finds
Researchers comparing maps of CAFOs with county-level disease data from California, Texas and Iowa found increased rates of all types of cancer, but said more research is needed to determine the cause.
People in three states living near large livestock feeding operations experience higher rates of cancer, a new analysis found.
Cancer Rates Are Higher Near Large Livestock Feeding Operations in 3 States, a New Study Finds
An interview with author Ed Yong.
Watch as Ed Yong, Pulitzer-winning science journalist and author of An Immense World, speaks with ICN executive editor Vernon Loeb about the extraordinary sensory worlds of animals, and the concept of the Umwelt, or the parts of an animal’s surroundings that it can uniquely perceive, sense and experience.

A Hunger Strike Ends, but an ‘Unreasonable’ Woman’s Battle Against Corporate Polluters Marches On
Cancer Rates Are Higher Near Large Livestock Feeding Operations in 3 States, a New Study Finds
The Extraordinary Sensory Worlds of Animals
-
Climate Change8 months ago
Guest post: Why China is still building new coal – and when it might stop
-
Greenhouse Gases8 months ago
Guest post: Why China is still building new coal – and when it might stop
-

 Greenhouse Gases2 years ago
嘉宾来稿:满足中国增长的用电需求 光伏加储能“比新建煤电更实惠”
-
Climate Change2 years ago
Bill Discounting Climate Change in Florida’s Energy Policy Awaits DeSantis’ Approval
-

 Climate Change2 years ago
嘉宾来稿:满足中国增长的用电需求 光伏加储能“比新建煤电更实惠”
-
Climate Change Videos2 years ago
The toxic gas flares fuelling Nigeria’s climate change – BBC News
-

 Renewable Energy6 months ago
Sending Progressive Philanthropist George Soros to Prison?
-

 Carbon Footprint2 years ago
US SEC’s Climate Disclosure Rules Spur Renewed Interest in Carbon Credits