
Artificial intelligence (AI) has undergone a rapid expansion in recent years.
Tech leaders have hailed an “AI revolution” – predicting “transformative” effects for humanity – while some governments have set their sights on AI-driven economic growth.
Yet, the industry is also facing scrutiny on many fronts, from inaccuracies in AI outputs through to the threat it poses to democracy.
One major critique concerns the environmental impact of AI, particularly the intensive energy use and carbon dioxide (CO2) emissions of the data centres that power it.
Campaigners, journalists and researchers have warned that the rapid expansion of data centres could slow down or even reverse the global shift towards net-zero.
The topic is complex, not least because the future of AI – and the role it could play in increasing or potentially helping to reduce emissions – remains highly uncertain.
Below, Carbon Brief takes a look at some of the best available figures, largely from the International Energy Agency (IEA), to explore the energy and emissions impact of AI.
- Data centres currently account for a small share of global emissions and electricity use
- Around a tenth of the electricity demand growth by 2030 is set to be driven by data centres
- Data centres could account for half of electricity demand growth in some countries
- Fossil-fuel use will likely expand to power data centres, but clean-energy supplies are set to grow faster
- There is a lot of uncertainty about how much data centres will expand
1. Data centres currently account for a small share of global emissions and electricity use
The process of training and deploying AI models relies on data centres – large, energy-intensive facilities that house computing infrastructure.
Data centres already underpin the internet, among other things, making them essential for modern life. But as hype around AI has grown in recent years, investment in new data centres has ballooned.
The global electricity consumption of expanding data centres has grown by around 12% each year since 2017, according to the IEA’s recent “energy and AI” report.
Concerns about “skyrocketing” electricity demand have also prompted warnings of data centres driving up CO2 emissions, as fossil fuels still generate much of the world’s power.
Indeed, companies, such as Google, Meta and Microsoft, have reported large emissions spikes over the past few years due to data-centre expansion, despite their net-zero pledges.
One research paper concludes that the electricity demand of AI “runs counter to the massive efficiency gains that are needed to achieve net-zero”. Others have voiced concerns that data centres will “overwhelm” and “undermine” both national and company-level climate targets.
Reporting often mentions the electricity demand of data centres – or their emissions – “doubling”, “tripling” or increasing by some other large percentage in the coming years.
But these increases, while potentially dramatic in relative terms, are starting from a low baseline. As shown in the chart below, data centres are currently responsible for just over 1% of global electricity demand and 0.5% of CO2 emissions, according to IEA data.

Given this starting point, even as data centres expand, the IEA suggests that they will make a relatively small contribution to climate change, in the short term.
The agency estimates that data-centre emissions will reach 1% of CO2 emissions by 2030 in its central scenario, or 1.4% in a faster-growth scenario.
Nevertheless, it notes that this is one of the few sectors where emissions are set to grow – alongside road transport and aviation – as most will likely decarbonise in the coming years.
2. Around a tenth of the electricity demand growth by 2030 is set to be driven by data centres
The world is entering what the IEA describes as a “new age of electricity”, in which the electrification of transport, buildings and industry drives a surge in demand for power.
Along with electric cars and factories, data centres are frequently highlighted by analysts as a key “emerging driver” of this demand.
Under the IEA’s central scenario for data-centre growth, the sector’s global electricity consumption would more than double between 2024 and 2030, reaching 945 terawatt-hours (TWh) by the end of the decade. This is equivalent to the current electricity demand of Japan.
The IEA describes AI as “the most important driver of this growth”.
As it stands, AI has been responsible for around 5-15% of data-centre power use in recent years, but this could increase to 35-50% by 2030, according to another report prepared for the IEA.
However, the 530TWh rise in electricity demand in data centres by 2030 would only be 8% of the overall increase in demand that the IEA projects, as shown in the chart below.
This is less than electric vehicles (838TWh) or air conditioning (651TWh). It is considerably less than the 1,936TWh growth expected in industrial sectors by 2030.
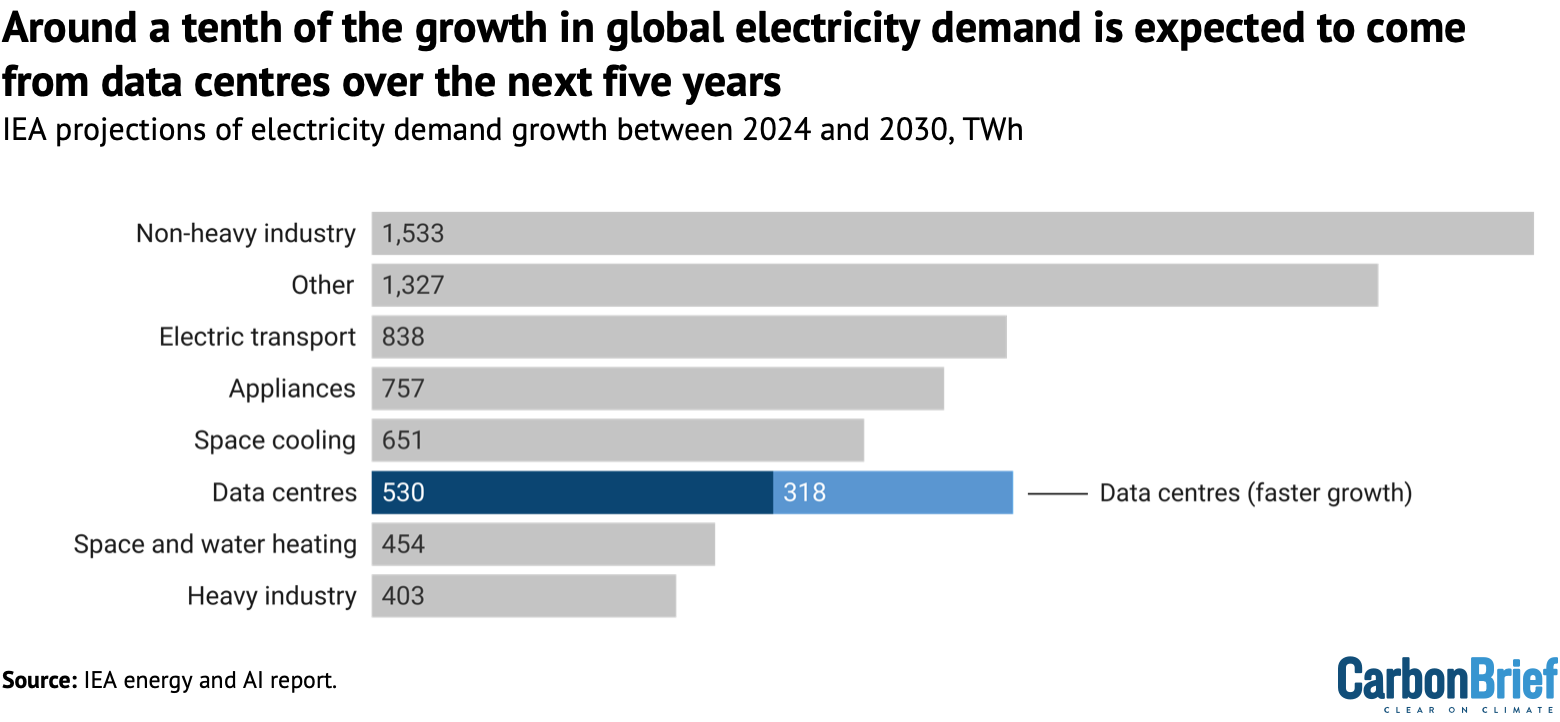
If data-centre electricity use rose in line with the IEA’s faster-growth scenario, the facilities would be responsible for around 12% of global demand growth overall.
While the IEA says “uncertainties widen” when considering electricity demand growth beyond 2030, it expects a continued – albeit slower – increase to 1,193TWh by 2035.
This would mean annual demand growth roughly halving, from around 90TWh per year out to 2030, down to less than 50TWh a year out to 2035.
3. Data centres could account for half of electricity demand growth in some countries
While the global picture suggests a relatively modest role for data centres in driving near-future electricity demand growth, it could be far more pronounced in some countries.
Data centres are very geographically concentrated, both in terms of their global distribution and within leading countries. Today, nearly half of their electricity consumption takes place in the US, 25% in China and 15% in Europe, according to the IEA.
US data centres used around 4% of the nation’s electricity in 2023 and this is set to rise to 7-12% by 2028, according to analysis by the Lawrence Berkeley National Laboratory.
In Ireland – regarded as a European “tech hub” – around 21% of the nation’s electricity is used for data centres. The IEA estimates that this share could rise to 32% by 2026.
Data-centre electricity demand tends to be further localised in certain regions. In the US state of Virginia, these facilities already consume 26% of electricity, while in the Irish capital, Dublin, the figure is 79%, according to analysis by Oeko-Institute.
Much of the commentary on AI threatening climate goals comes from “advanced economies” in the global north, where the IEA estimates that, on average, a quarter of electricity demand growth by 2030 will be driven by data centres.
(In many of these countries, electricity demand has previously been flat or falling for years.)
Roughly half of the power demand growth in the US and Japan over the next five years is expected to come from data centres, according to the IEA, as shown in the figure below.
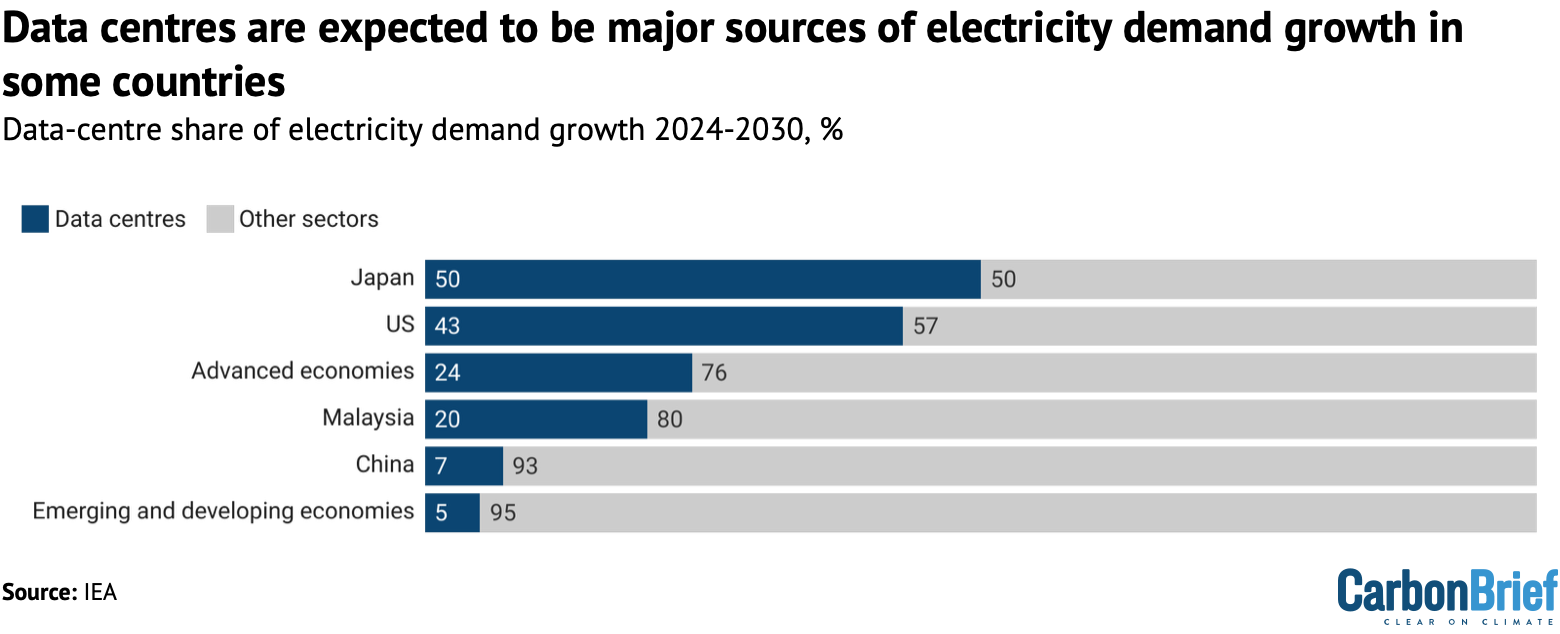
While there are some notable exceptions, such as Malaysia, data centres are set to be a relatively small portion of electricity demand growth in developing and emerging markets.
Around the world, electricity grids are under strain, with many developed countries, in particular, seeing long wait times for grid connections and new transmission lines. Data-centre growth is raising this pressure.
There are also growing concerns, notably in the US, about the impact data-centre growth could have on energy bills.
The IEA says that demand growth presents “advanced economies” with a “wake-up call” for the electricity sector to invest in infrastructure, otherwise “there is a risk that meeting data-centre load growth could entail trade-offs with other goals, such as electrification”.
4. Fossil-fuel use will likely expand to power data centres, but clean-energy supplies are set to grow faster
The extent to which data-centre growth increases emissions depends on which energy sources power those data centres.
Data centres can use power from the grid, in which case their electricity mix will reflect that of the region they are in and could therefore become cleaner as nations decarbonise.
They can also be powered by “captive” sources, built to supply specific facilities, such as solar panels, small nuclear reactors or gas turbines.
There are concerns that data-centre expansion will be used to justify the prolonged use of fossil fuels, “locking in” a future of elevated emissions.
Indeed, the likes of Shell have framed AI in such terms and some data-centre operators have been explicitly seeking gas connections to meet their electricity needs.
Currently, coal is the biggest single electricity source for data centres globally, largely due to the numerous facilities in China.
Overall, fossil fuels provide nearly 60% of power to data centres, according to the IEA. Renewables meet 27% of their electricity demand and nuclear another 15%.
(These figures are based on the electricity these facilities consume, rather than any contracts they have to buy clean energy credits.)
In the IEA’s central scenario, by 2035 the ratio of the data-centre electricity mix switches from around 60% fossil fuels and 40% clean power to 60% clean power and 40% fossil fuels, as shown in the chart below.
This is expected to be driven primarily by the wider global expansion of renewables, although some projects will be funded directly by data-centre companies.
However, the IEA says significantly more gas and coal power would likely still be required to meet data-centre demand, both from ramping up existing plants and building new ones.
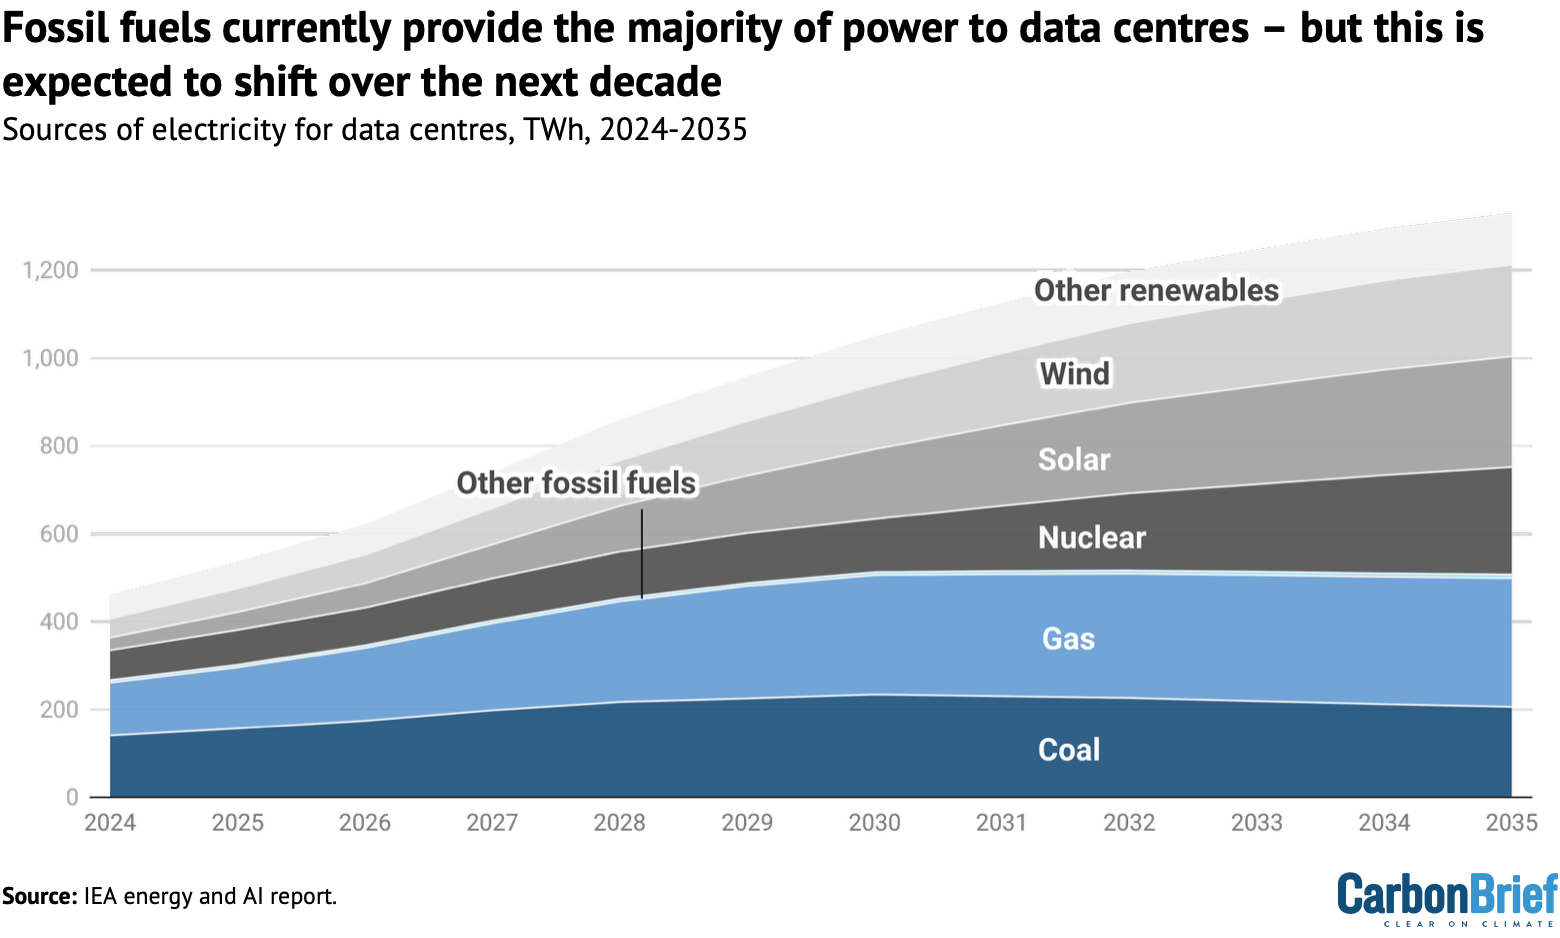
Gas-power generation for data centres is expected to more than double from 120TWh in 2024 to 293TWh in 2035, with much of this growth in the US, according to the IEA.
About 38GW of captive gas plants currently “in development” – roughly a quarter of all such projects – are planned to power data centres, according to Global Energy Monitor (GEM).
The US has doubled the amount of gas- and oil-fired capacity it has in development over the past year, driven partly by the energy demand of the “burgeoning AI industry”, according to GEM.
However, these projects are facing long lead times and “sharply” rising costs, with GEM noting, as a result, that many may never materialise.
5. There is a lot of uncertainty about how much data centres will expand
Currently, there are no comprehensive global datasets available on data-centre electricity consumption or emissions, with few governments mandating any reporting of such numbers.
All figures concerning the energy and climate impact of AI are therefore estimates.
The IEA has assessed hundreds of available estimates and forecasts, noting that even historical data can be “widely divergent”, due in part to a lack of common definitions.
On top of this, there are major uncertainties, including over how quickly AI will be adopted. Despite the enthusiastic uptake of generative AI by individuals and companies, some argue that the business case for continued, rapid growth may be weaker than suggested.
Another uncertainty is how energy-efficient AI will be. Experts have already identified efficiency improvements resulting from better chips, more efficient training algorithms and larger data centres, all of which could continue curbing electricity demand.
(Google has also reported a substantial drop in the electricity use required for individual AI search queries, which is already small compared to the power needed to train AI models.)
A final uncertainty is over how many proposed data centres will actually get built, with some speculative requests for grid capacity relating to plans that may never materialise.
As a result of these knowledge gaps, there have been numerous estimates of short-term electricity demand growth from data centres, which have produced very different results, as shown in the chart below.
Some estimates – such as one from the Gas Exporting Countries Forum arguing that more gas exports will be needed to fuel meteoric rises in electricity demand for AI – have been deemed less credible in reviews by independent experts.

Another area of great uncertainty concerns the impact that the application of AI could have on electricity use and emissions.
Some researchers have attempted to calculate how much AI could curb emissions, by helping to identify efficiency gains in other parts of the energy system, or by making technological breakthroughs.
In some “exploratory” analysis, the IEA says such gains could cancel out any extra data-centre emissions due to the growth of AI.
However, it adds that despite the AI hype, “there is currently no existing momentum of AI adoption that would unlock these emissions reductions”.


The post AI: Five charts that put data-centre energy use – and emissions – into context appeared first on Carbon Brief.
AI: Five charts that put data-centre energy use – and emissions – into context
N.C. Gov. Josh Stein wants state lawmakers to rethink tax breaks for data centers. The industry’s opacity makes it difficult to evaluate costs and benefits.
Tax breaks for data centers in North Carolina keep as much as $57 million each year into from state and local government coffers, state figures show, an amount that could balloon to billions of dollars if all the proposed projects are built.
The Global Environment Facility (GEF), a multilateral fund that provides climate and nature finance to developing countries, has raised $3.9 billion from donor governments in its last pledging session ahead of a key fundraising deadline at the end of May.
The amount, which is meant to cover the fund’s activities for the next four years (July 2026-June 2030), falls significantly short of the previous four-year cycle for which the GEF managed to raise $5.3bn from governments. Since then, military and other political priorities have squeezed rich nations’ budgets for climate and development aid.
The facility said in a statement that it expects more pledges ahead of the final replenishment package, which is set for approval at the next GEF Council meeting from May 31 to June 3.
Claude Gascon, interim CEO of the GEF, said that “donor countries have risen to the challenge and made bold commitments towards a more positive future for the planet”. He added that the pledges send a message that “the world is not giving up on nature even in a time of competing priorities”.
-
UK imports of “green” jet fuel linked to Amazon deforestation
A Texas refinery shipping sustainable aviation fuel to Europe has sourced beef tallow with links to a meatpacking firm fined over illegal cattle purchases -
Italy pushes coal exit back after gas prices rise
Analysts say the move sends a negative signal, but its impact will be limited given coal’s marginal role in Italy’s energy mix


Donors under pressure
But Brian O’Donnell, director of the environmental non-profit Campaign for Nature, said the announcement shows “an alarming trend” of donor governments cutting public finance for climate and nature.
“Wealthy nations pledged to increase international nature finance, and yet we are seeing cuts and lower contributions. Investing in nature prevents extinctions and supports livelihoods, security, health, food, clean water and climate,” he said. “Failing to safeguard nature now will result in much larger costs later.”
At COP29 in Baku, developed countries pledged to mobilise $300bn a year in public climate finance by 2035, while at UN biodiversity talks they have also pledged to raise $30bn per year by 2030. Yet several wealthy governments have announced cuts to green finance to increase defense spending, among them most recently the UK.
As for the US, despite Trump’s cuts to international climate finance, Congress approved a $150 million increase in its contribution to the GEF after what was described as the organisation’s “refocus on non-climate priorities like biodiversity, plastics and ocean ecosystems, per US Treasury guidance”.
The facility will only reveal how much each country has pledged when its assembly of 186 member countries meets in early June. The last period’s largest donors were Germany ($575 million), Japan ($451 million), and the US ($425 million).
The GEF has also gone through a change in leadership halfway through its fundraising cycle. Last December, the GEF Council asked former CEO Carlos Manuel Rodriguez to step down effective immediately and appointed Gascon as interim CEO.
Santa Marta conference: fossil fuel transition in an unstable world
New guidelines
As part of the upcoming funding cycle, the GEF has approved a set of guidelines for spending the $3.9bn raised so far, which include allocating 35% of resources for least developed countries and small island states, as well as 20% of the money going to Indigenous people and communities.
Its programs will help countries shift five key systems – nature, food, urban, energy and health – from models that drive degradation to alternatives that protect the planet and support human well-being by integrating the value of nature into production and consumption systems.
The new priorities also include a target to allocate 25% of the GEF’s budget for mobilising private funds through blended finance. This aligns with efforts by wealthy countries to increase contributions from the private sector to international climate finance.
Niels Annen, Germany’s State Secretary for Economic Cooperation and Development, said in a statement that the country’s priorities are “very well reflected” in the GEF’s new spending guidelines, including on “innovative finance for nature and people, better cooperation with the private sector, and stable resources for the most vulnerable countries”.
Aliou Mustafa, of the GEF Indigenous Peoples Advisory Group (IPAG), also welcomed the announcement, adding that “the GEF is strengthening trust and meaningful partnerships with Indigenous Peoples and local communities” by placing them at the “centre of decision-making”.
The post GEF raises $3.9bn ahead of funding deadline, $1bn below previous budget appeared first on Climate Home News.
GEF raises $3.9bn ahead of funding deadline, $1bn below previous budget
Tropical cyclones that rapidly intensify when passing over marine heatwaves can become “supercharged”, increasing the likelihood of high economic losses, a new study finds.
Such storms also have higher rates of rainfall and higher maximum windspeeds, according to the research.
The study, published in Science Advances, looks at the economic damages caused by nearly 800 tropical cyclones that occurred around the world between 1981 and 2023.
It finds that rapidly intensifying tropical cyclones that pass near abnormally warm parts of the ocean produce nearly double – 93% – the economic damages as storms that do not, even when levels of coastal development are taken into account.
One researcher, who was not involved in the study, tells Carbon Brief that the new analysis is a “step forward in understanding how we can better refine our predictions of what might happen in the future” in an increasingly warm world.
As marine heatwaves are projected to become more frequent under future climate change, the authors say that the interactions between storms and these heatwaves “should be given greater consideration in future strategies for climate adaptation and climate preparedness”.
‘Rapid intensification’
Tropical cyclones are rapidly rotating storm systems that form over warm ocean waters, characterised by low pressure at their cores and sustained winds that can reach more than 120 kilometres per hour.
The term “tropical cyclones” encompasses hurricanes, cyclones and typhoons, which are named as such depending on which ocean basin they occur in.
When they make landfall, these storms can cause major damage. They accounted for six of the top 10 disasters between 1900 and 2024 in terms of economic loss, according to the insurance company Aon’s 2025 climate catastrophe insight report.
These economic losses are largely caused by high wind speeds, large amounts of rainfall and damaging storm surges.
Storms can become particularly dangerous through a process called “rapid intensification”.
Rapid intensification is when a storm strengthens considerably in a short period of time. It is defined as an increase in sustained wind speed of at least 30 knots (around 55 kilometres per hour) in a 24-hour period.
There are several factors that can lead to rapid intensification, including warm ocean temperatures, high humidity and low vertical “wind shear” – meaning that the wind speeds higher up in the atmosphere are very similar to the wind speeds near the surface.
Rapid intensification has become more common since the 1980s and is projected to become even more frequent in the future with continued warming. (Although there is uncertainty as to how climate change will impact the frequency of tropical cyclones, the increase in strength and intensification is more clear.)
Marine heatwaves are another type of extreme event that are becoming more frequent due to recent warming. Like their atmospheric counterparts, marine heatwaves are periods of abnormally high ocean temperatures.
Previous research has shown that these marine heatwaves can contribute to a cyclone undergoing rapid intensification. This is because the warm ocean water acts as a “fuel” for a storm, says Dr Hamed Moftakhari, an associate professor of civil engineering at the University of Alabama who was one of the authors of the new study. He explains:
“The entire strength of the tropical cyclone [depends on] how hot the [ocean] surface is. Marine heatwave means we have an abundance of hot water that is like a gas [petrol] station. As you move over that, it’s going to supercharge you.”
However, the authors say, there is no global assessment of how rapid intensification and marine heatwaves interact – or how they contribute to economic damages.
Using the International Best Track Archive for Climate Stewardship (IBTrACS) – a database of tropical cyclone paths and intensities – the researchers identify 1,600 storms that made landfall during the 1981-2023 period, out of a total of 3,464 events.
Of these 1,600 storms, they were able to match 789 individual, land-falling cyclones with economic loss data from the Emergency Events Database (EM-DAT) and other official sources.
Then, using the IBTrACS storm data and ocean-temperature data from the European Centre for Medium-Range Weather Forecasts, the researchers classify each cyclone by whether or not it underwent rapid intensification and if it passed near a recent marine heatwave event before making landfall.
The researchers find that there is a “modest” rise in the number of marine heatwave-influenced tropical cyclones globally since 1981, but with significant regional variations. In particular, they say, there are “clear” upward trends in the north Atlantic Ocean, the north Indian Ocean and the northern hemisphere basin of the eastern Pacific Ocean.
‘Storm characteristics’
The researchers find substantial differences in the characteristics of tropical cyclones that experience rapid intensification and those that do not, as well as between rapidly intensifying storms that occur with marine heatwaves and those that occur without them.
For example, tropical cyclones that do not experience rapid intensification have, on average, maximum wind speeds of around 40 knots (74km/hr), whereas storms that rapidly intensify have an average maximum wind speed of nearly 80 knots (148km/hr).
Of the rapidly intensifying storms, those that are influenced by marine heatwaves maintain higher wind speeds during the days leading up to landfall.
Although the wind speeds are very similar between the two groups once the storms make landfall, the pre-landfall difference still has an impact on a storm’s destructiveness, says Dr Soheil Radfar, a hurricane-hazard modeller at Princeton University. Radfar, who is the lead author of the new study, tells Carbon Brief:
“Hurricane damage starts days before the landfall…Four or five days before a hurricane making landfall, we expect to have high wind speeds and, because of that high wind speed, we expect to have storm surges that impact coastal communities.”
They also find that rapidly intensifying storms have higher peak rainfall than non-rapidly intensifying storms, with marine heatwave-influenced, rapidly intensifying storms exhibiting the highest average rainfall at landfall.
The charts below show the mean sustained wind speed in knots (top) and the mean rainfall in millimetres per hour (bottom) for the tropical cyclones analysed in the study in the five days leading up to and two days following a storm making landfall.
The four lines show storms that: rapidly intensified with the influence of marine heatwaves (red); those that rapidly intensified without marine heatwaves (purple); those that experienced marine heatwaves, but did not rapidly intensify (orange); and those that neither rapidly intensified nor experienced a marine heatwave (blue).

Dr Daneeja Mawren, an ocean and climate consultant at the Mauritius-based Mascarene Environmental Consulting who was not involved in the study, tells Carbon Brief that the new study “helps clarify how marine heatwaves amplify storm characteristics”, such as stronger winds and heavier rainfall. She notes that this “has not been done on a global scale before”.
However, Mawren adds that other factors not considered in the analysis can “make a huge difference” in the rapid intensification of tropical cyclones, including subsurface marine heatwaves and eddies – circular, spinning ocean currents that can trap warm water.
Dr Jonathan Lin, an atmospheric scientist at Cornell University who was also not involved in the study, tells Carbon Brief that, while the intensification found by the study “makes physical sense”, it is inherently limited by the relatively small number of storms that occur. He adds:
“There’s not that many storms, to tease out the physical mechanisms and observational data. So being able to reproduce this kind of work in a physical model would be really important.”
Economic costs
Storm intensity is not the only factor that determines how destructive a given cyclone can be – the economic damages also depend strongly on the population density and the amount of infrastructure development where a storm hits. The study explains:
“A high storm surge in a sparsely populated area may cause less economic damage than a smaller surge in a densely populated, economically important region.”
To account for the differences in development, the researchers use a type of data called “built-up volume”, from the Global Human Settlement Layer. Built-up volume is a quantity derived from satellite data and other high-resolution imagery that combines measurements of building area and average building height in a given area. This can be used as a proxy for the level of development, the authors explain.
By comparing different cyclones that impacted areas with similar built-up volumes, the researchers can analyse how rapid intensification and marine heatwaves contribute to the overall economic damages of a storm.
They find that, even when controlling for levels of coastal development, storms that pass through a marine heatwave during their rapid intensification cause 93% higher economic damages than storms that do not.
They identify 71 marine heatwave-influenced storms that cause more than $1bn (inflation-adjusted across the dataset) in damages, compared to 45 storms that cause those levels of damage without the influence of marine heatwaves.
This quantification of the cyclones’ economic impact is one of the study’s most “important contributions”, says Mawren.
The authors also note that the continued development in coastal regions may increase the likelihood of tropical cyclone damages over time.
Towards forecasting
The study notes that the increased damages caused by marine heatwave-influenced tropical cyclones, along with the projected increases in marine heatwaves, means such storms “should be given greater consideration” in planning for future climate change.
For Radfar and Moftakhari, the new study emphasises the importance of understanding the interactions between extreme events, such as tropical cyclones and marine heatwaves.
Moftakhari notes that extreme events in the future are expected to become both more intense and more complex. This becomes a problem for climate resilience because “we basically design in the future based on what we’ve observed in the past”, he says. This may lead to underestimating potential hazards, he adds.
Mawren agrees, telling Carbon Brief that, in order to “fully capture the intensification potential”, future forecasts and risk assessments must account for marine heatwaves and other ocean phenomena, such as subsurface heat.
Lin adds that the actions needed to reduce storm damages “take on the order of decades to do right”. He tells Carbon Brief:
“All these [planning] decisions have to come by understanding the future uncertainty and so this research is a step forward in understanding how we can better refine our predictions of what might happen in the future.”


The post Marine heatwaves ‘nearly double’ the economic damage caused by tropical cyclones appeared first on Carbon Brief.
Marine heatwaves ‘nearly double’ the economic damage caused by tropical cyclones


-
Climate Change8 months ago
Guest post: Why China is still building new coal – and when it might stop
-
Greenhouse Gases8 months ago
Guest post: Why China is still building new coal – and when it might stop
-

 Greenhouse Gases2 years ago
嘉宾来稿:满足中国增长的用电需求 光伏加储能“比新建煤电更实惠”
-
Climate Change2 years ago
Bill Discounting Climate Change in Florida’s Energy Policy Awaits DeSantis’ Approval
-

 Climate Change2 years ago
嘉宾来稿:满足中国增长的用电需求 光伏加储能“比新建煤电更实惠”
-
Climate Change Videos2 years ago
The toxic gas flares fuelling Nigeria’s climate change – BBC News
-

 Renewable Energy6 months ago
Sending Progressive Philanthropist George Soros to Prison?
-

 Carbon Footprint2 years ago
US SEC’s Climate Disclosure Rules Spur Renewed Interest in Carbon Credits