
The season might reveal its healing powers and generosity if you look up.
PLEASANT VALLEY, Mass.—Two visits to this wildlife sanctuary. One week apart. I came to report the arrival of spring, an under-covered story. In the hope, too, that the new season might extinguish the fire in my brain, ablaze in the Anthropocene: The accelerating heat with its cascading catastrophes; the barbaric wars with their crimes against humanity; scorching hatreds shared instantly everywhere. Our raging modern inferno.
All answers will need to be submitted via the Google form by the end of the half-time break
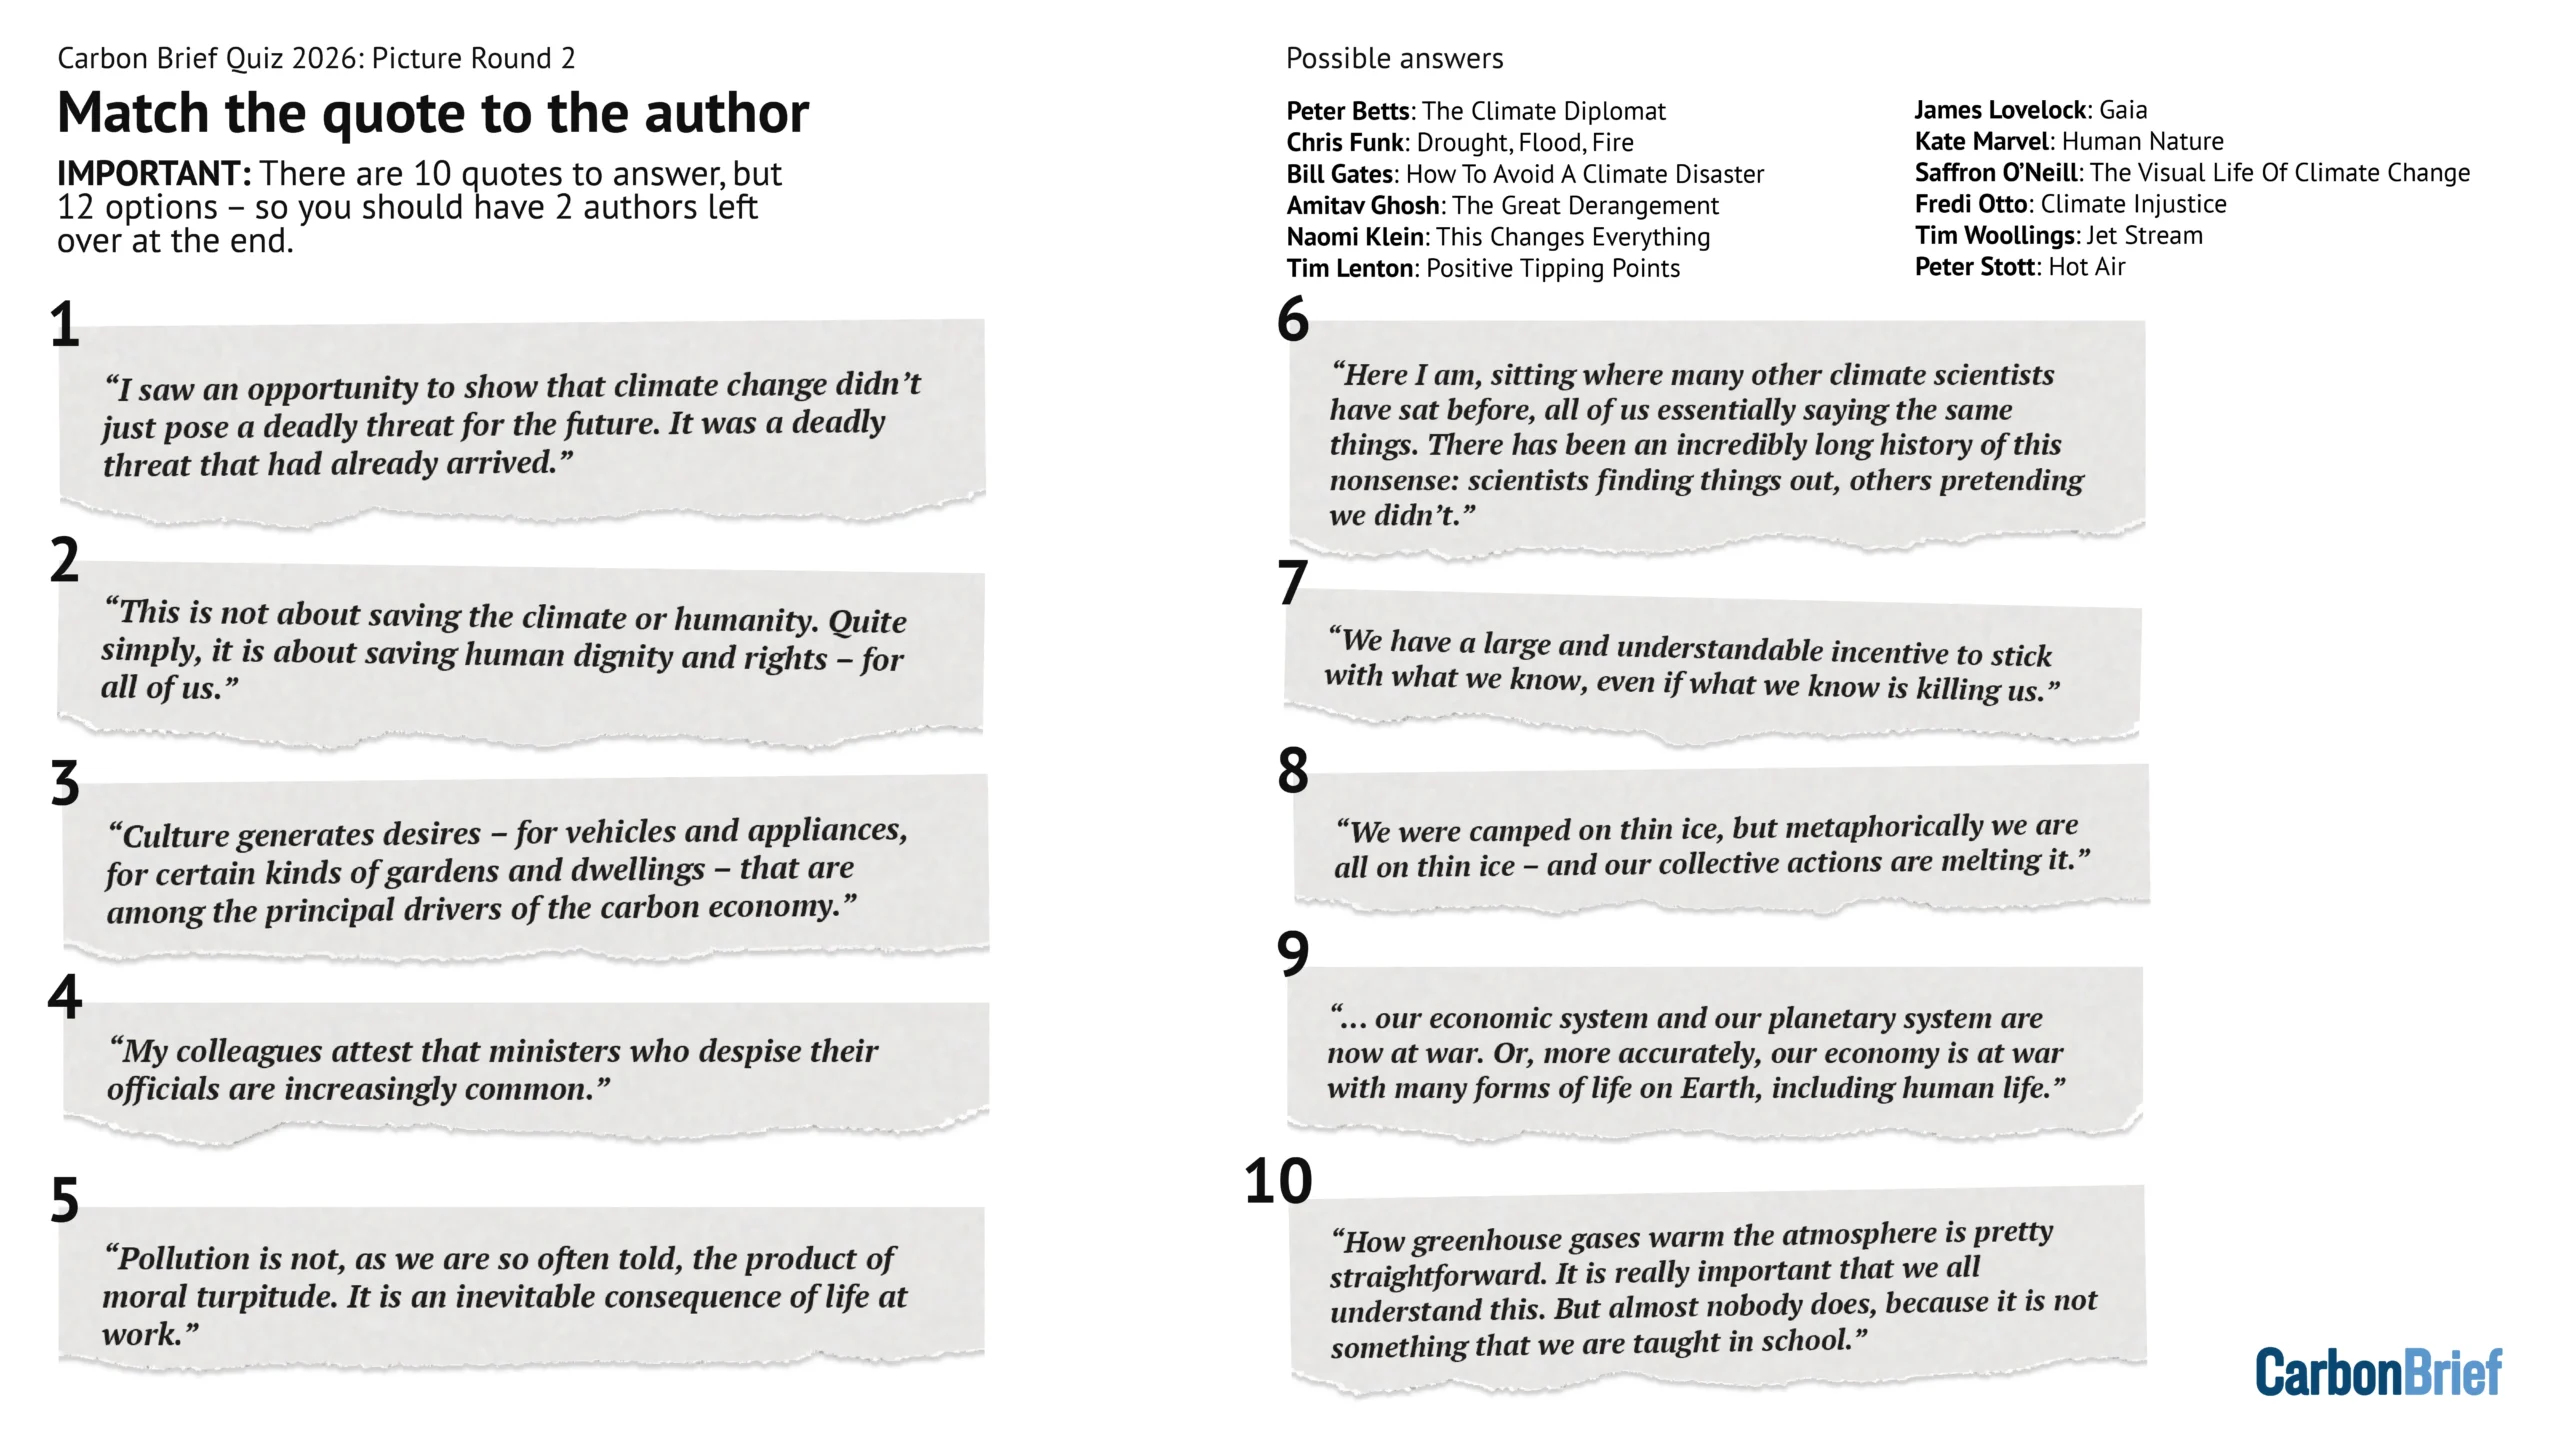
The post Carbon Brief Quiz 2026: Picture Round 1 and 2 appeared first on Carbon Brief.
Rudecindo Espíndola’s family has been growing corn, figs and other crops for generations in the Soncor Valley in northern Chile, an oasis of green orchards in one of the driest places on Earth – the Atacama desert.
Perched nearly 2,500 metres above sea level, his village, Toconao, means “lost corner” in the Kunza language of the Indigenous people who have lived and farmed the land in this remote spot for millennia.
“Our deep connection to this place is based on what we have inherited from our ancestors: our culture, our language,” said Espíndola, a member of a local research team that found evidence that people have inhabited the desert for more than 12,000 years.
This distant outpost is at the heart of the global rush for lithium, a silvery-white metal used to make batteries for electric vehicles (EV) and renewable energy storage that are vital to the world’s clean energy transition. The Atacama salt flat is home to about 25% of the world’s known lithium reserves, turning Chile into the world’s second-largest lithium producer after Australia.
For decades, the Atacama’s Indigenous Lickanantay people have protested against the expansion of the lithium industry, warning that the large evaporation ponds used to extract lithium from the brine beneath the salt flats are depleting scarce and sacred water supplies and destroying fragile desert ecosystems.
Espíndola joined the protests, fearing that competition for water could pose an existential threat to his community.
But last year, he was among dozens of Indigenous representatives who sat across the table from executives representing two Chilean mining giants to hammer out a governance model that gives Indigenous communities living close to lithium sites a bigger say over operations, and a greater share of the economic benefits.

A pioneering deal
The agreement is part of a landmark deal between state-owned copper miner Codelco and lithium producer the Sociedad Química y Minera de Chile (SQM) to extract lithium from the salt flats until 2060 through a joint venture called NovaAndino Litio.
The governance model that promises people living in Toconao and other villages around the salt flats millions of dollars in benefits and greater environmental oversight is the first of its kind in mineral-rich Chile, and has been hailed by industry experts as the start of a potential model for more responsible mining for energy transition metals.
NovaAndino told Climate Home News the negotiations with local communities represented an “unprecedented process that has allowed us to incorporate the territory’s vision early in the project’s design” and creates “a system of permanent engagement” with local communities.
The company added it will contribute to sustainable development in the area and help “the safeguarding of [the Lickanantay people’s] culture and environmental values”.
-
West Africa’s first lithium mine awaits go-ahead as Ghana seeks better deal
Ghana wants to benefit from the scramble for lithium but its reliance on mining firms for revenue and expertise weakens its ability to negotiate preferential terms, experts say -
Campaigners sue Chilean government over copper mining pollution
The case comes after Climate Home News revealed that uncontrolled air pollution has put people’s health at risk in Chile’s copper mining heartland -
Argentina’s pioneering glacier law on the line as Milei bets on copper rush
President Javier Milei wants Congress to relax groundbreaking glacier protection legislation to boost mining, but opponents say the environmental risks are too great


For mining companies, such agreements could help reduce social conflicts and protests, which have delayed and stalled extraction in other parts of South America’s lithium-rich region, known as the lithium triangle.
“Argentina and Bolivia could learn a lot from what we’re doing [here],” said Rodrigo Guerrero, a researcher at the Santiago-based Espacio Público think-tank, adding that adopting participatory frameworks early on could prevent them from “going through the entire cycle of disputes” that Chile has experienced.
Justice at last?
As part of the governance deal, NovaAndino has pledged to adopt technologies that will reduce water use and mitigate the environmental impacts of lithium extraction.
It has also committed to hold more than 100 annual meetings with community representatives to build a “good faith” relationship, and an Indigenous Advisory Council will meet twice a year with the company’s sustainability committee to discuss its environmental strategy, company sources said. The meetings are due to begin next month.
To oversee the agreement’s implementation, an assembly – composed of representatives from all 25 signatory communities – will track the project’s progress. In addition, NovaAndino will hold one-on-one meetings with each community to address issues such as the hiring of local people and the protection of Indigenous employees.

Espíndola said the deal, while far from perfect, was an important step forward.
“Previously, Indigenous participation was ambiguous. Now we talk about participation at [every] hierarchical level of this process, a very strong empowerment for Indigenous communities,” said Espíndola, adding that it did not give local communities everything they had asked for. For instance, they will not hold veto power over NovaAndino’s decisions or have a formal shareholder role.
But after years of conflict with mining companies, a form of “participatory justice is being done”, he said.
Not everyone is convinced that the accord, pushed by Chile’s former leftist government, marks progress, however.
“Not in our name”
The negotiations have caused deep divisions among the Lickanantay, some of whom say greater engagement with mining companies will not stop irreparable damage to the salt flats on which their traditional way of life depends. Others fear the promise of more money will further erode community bonds.
In January 2024, Indigenous communities from five villages closest to the mining operations, including Toconao, blocked the main access roads to the lithium extraction sites. They said the Council of Atacameño Peoples, which represents 18 Lickanantay communities and was leading discussions with the company, no longer spoke for them.
Official transcripts of consultations on the extension of the lithium contracts and how to share the promised benefits reveal deep divisions. Tensions peaked when communities around the mining operations clashed over how to distribute the multimillion-dollar windfall, with villages closest to the mining sites demanding the largest share.
Eventually, separate deals establishing a new governance framework over mining activities were reached between Codelco and SQM with 25 local communities, including a specific agreement for the five villages closest to the extraction sites.

The division caused by the separate deal for the five villages “will cause historic damage” to the unity of the Atacama desert’s Indigenous peoples, said Hugo Flores, president of the Council of Atacameño Associations, a separate group representing farmers, herders and local workers who oppose the mining expansion.
Sonia Ramos, 83, a renowned Lickanantay healer and well-known anti-mining activist, lamented the fracturing of social bonds over money, and for the sake of meeting government objectives.
“There is fragmentation among the communities themselves. Everything has transformed into disequilibrium,” said the 83-year-old.
“[NovaAndino] supposedly has economic significance for the country, but for us, it is the opposite,” she said.
The company told Climate Home News it has “acted consistently” to promote “transparent, voluntary, and good-faith dialogue with the communities in the territory, recognising their diversity and autonomy, and always respecting their timelines and forms of participation”.
A one-off deal or a model for others?
The NovaAndino joint venture is a pillar of Chile’s strategy to double lithium production by 2031 and consolidate the copper-producing nation’s role in the clean energy transition as demand for battery minerals accelerates.
Chile’s new far-right president, José Antonio Kast, who was sworn in last week, promised to respect the lithium contracts signed by his predecessor’s administration – including the governance model.
Still, some experts say the splits over the new model highlight the need for legislation that mandates direct engagement and minimum community benefits for all large mining projects.
“In the past, this has lent itself to clientelism, communities who negotiate best or arrive first get the better deal,” said Pedro Zapata, a programme officer in Chile for the Natural Resource Governance Institute.
“This can be to the detriment of other communities with less strength. We cannot have first- and second-class citizens subject to the same industry,” he added.
The government is already negotiating two more public-private partnerships to extract lithium with mining giant Rio Tinto, which it said would include a framework to engage with Indigenous communities and share some of the revenues. The details will need to be negotiated between local people, the government and the company.
Sharing the benefits of mining
Under the deal in the Atacama, NovaAndino will run SQM’s current lithium concessions until they expire in 2030 before seeking new permits to expand mining in the region under a vast project known as “Salar Futuro” – a process which will require further mandatory consultations with communities.
Besides the participatory mechanism, the new agreement promises more money than ever before for salt flat communities.

Depending on the global price of lithium and their proximity to the mining operations, Indigenous communities could collectively receive roughly $30 million annually in funding – about double what SQM currently disburses under existing contracts.
When taking into account the company’s payments to local and regional authorities, contributions could reach $150 million annually, according to the government.
To access these resources, each community will need to submit a pipeline of projects they would like funding for under a complex arrangement that includes five separate financial streams:
- A general investment fund will distribute funding based on each village’s size and proximity to the mining sites
- A development fund will support projects specifically in the five communities closest to the extraction sites
- Contributions to farmers and livestock associations
- Contributions to local governments
- A groundbreaking “intergenerational fund” held in trust for the Lickanantay until 2060
For many isolated communities in the Atacama desert, financial contributions from mining firms have funded essential public services, such as healthcare and facilities like football pitches and swimming pools.
In the past, communities have used some of the benefits they received from mining to build their own environmental monitoring units, hiring teams of hydrogeologists and lawyers to scrutinise miners’ activities.
Espíndola said the new model could pave the way for more ambitious development projects such as water treatment plants and community solar energy projects.

Competition for water
The depletion of water resources is one of local people’s biggest environmental concerns.
To extract lithium from the salt flats, miners pump lithium-rich brine accumulated over millions of years in underground reservoirs into gigantic pools, where the water is left to evaporate under the sun and leaves behind lithium carbonate.
One study has shown that the practice is causing the salt flat to sink by up to two centimetres a year. SQM recently said its current operations consume approximately 11,500 to 12,500 litres of industrial freshwater for every metric ton of lithium produced.
NovaAndino has committed to significantly reduce the company’s water use by returning at least 30% of the water it extracts from the brine and eliminating the use of all freshwater in its operations within five years of obtaining an environmental permit.
-
Bolivia’s shift to the right renews ambition to mine vast lithium reserves
The election of a centre-right president after 20 years of socialist rule could open up the nation’s lithium reserves to foreign investment – the US is paying attention -
‘The state doesn’t want to know’: Doctors raise alarm on children’s health crisis in Chile’s copper heartland
Autism and cancer cases are soaring in Chile linked to pollution from copper mining critical for the energy transition, doctors say -
Lithium tug of war: the US-China rivalry for Argentina’s white gold
As global competition hots up to secure lithium supplies for batteries, China is boosting its investments in Argentina while the US courts President Javier Milei


Cristina Dorador, a microbiologist at the University of Antofagasta, told Climate Home News that reinjecting the water underground is untested at a large scale and could impact the chemical composition of the salt flats.
Continuing to extract lithium from the flats until 2060 could be the “final blow” for this fragile ecosystem, she said.
Asked to comment on such concerns, NovaAndino said any new technology will be “subject to the highest regulatory standards”, and pledged to ensure transparency through “an updated monitoring system with the participation of Indigenous communities”.
High price for hard-won gains
For the five communities living on the doorstep of the lithium pools, one of the biggest gains is being granted physical access to the mining sites to monitor the lithium extraction and its impact on the salt flats.
That is a first and will strengthen communities’ ability to call out environmental harms, said Sergio Cubillos, the community president of Peine, the village closest to the evaporation ponds. It could also give them the means to seek remediation through the courts if necessary, Espíndola said.
Gaining such rights represents long-overdue progress, Cubillos said, but it has come at a high price for the Lickanantay people.
“Communities receiving money today is what has ultimately led to this division, because we haven’t been able to figure out what we want, how we want it, and how we envision our future as a people,” he said.
Main image: A truck loads concentrated brine at SQM’s lithium mine at the Atacama salt flat in Chile (Photo: REUTERS/Ivan Alvarado)
The post Landmark deal to share Chile’s lithium windfall fractures Indigenous communities appeared first on Climate Home News.
Landmark deal to share Chile’s lithium windfall fractures Indigenous communities
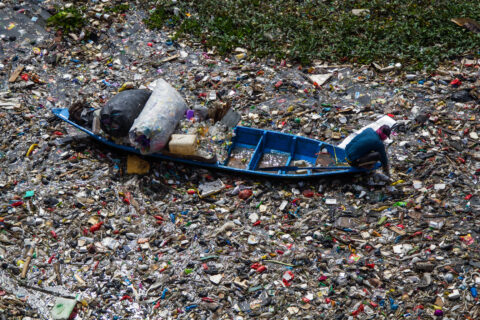
Diplomats will hold a series of informal meetings this year in a bid to revive stalled talks over a global treaty to curb plastic pollution, before aiming to reconvene for the next round of official negotiations at the end of 2026 or early 2027.
Hoping to find a long-awaited breakthrough in the deeply divided UN process, the chair of the talks, Chilean ambassador Julio Cordano, released a roadmap on Monday to inject momentum into the discussions after negotiations collapsed at a chaotic session in Geneva last August.
Cordano wrote in a letter that countries would meet in Nairobi from June 30 to July 3 for informal discussions to review all the components of the negotiations, including thorny issues such as efforts to limit soaring plastic production.
-
Deep divisions persist as plastics treaty talks restart at informal meeting
The US hits out at EU and Pacific island states over efforts to reduce soaring plastic production, highlighting the challenges ahead for troubled negotiations -
Why we couldn’t agree on a plastics treaty in Geneva – and what might happen next
Switzerland’s lead negotiator at INC-5.2 reflects on why the talks didn’t succeed – and the options now for getting an effective agreement

The gathering should result in the drafting of a new document laying the foundations of a future treaty text with options on elements with divergent views, but “no surprises” such as new ideas or compromise proposals. This plan aims to address the fact that countries left Geneva without a draft text to work on – something Cordano called a “significant limitation” in his letter.
“Predictable pathway”
The meeting in the Kenyan capital will follow a series of virtual consultations every four to six weeks, where heads of country delegations will exchange views on specific topics. A second in-person meeting aimed at finding solutions might take place in early October, depending on the availability of funding.
Cordano said the roadmap should offer “a predictable pathway” in the lead-up to the next formal negotiating session, which is expected to take place over 10 days at the end of 2026 or early 2027. A host country has yet to be selected, but Climate Home News understands that Brazil, Azerbaijan or Kenya – the home of the UN Environment Programme – have been put forward as options.
Countries have twice failed to agree on a global plastics treaty at what were meant to be final rounds of negotiations in December 2024 and August 2025.
Divisions on plastic production
One of the most divisive elements of the discussions remains what the pact should do about plastic production, which, according to the UN, is set to triple by 2060 without intervention.
A majority, which includes most European, Latin American, African and Pacific island nations, wants to limit the manufacturing of plastic to “sustainable levels”. But large fossil fuel and petrochemical producers, led by Saudi Arabia, the United States, Russia and India, say the treaty should only focus on managing plastic waste.
As nearly all plastic is made from planet-heating oil, gas and coal, the sector’s trajectory will have a significant impact on global efforts to reduce greenhouse gas emissions.
Countries still far apart
After an eight-month hiatus, informal discussions restarted in early March at an informal meeting of about 20 countries hosted by Japan.
A participant told Climate Home News that, while the gathering had been helpful to test ideas, progress remained “challenging”, with national stances largely unchanged.
The source added that countries would need to achieve a significant shift in positions in the coming months to make reconvening formal negotiations worthwhile.
Deep divisions persist as plastics treaty talks restart at informal meeting
Jacob Kean-Hammerson, global plastics policy lead at Greenpeace USA, said the new roadmap offers an opportunity for countries to “defend and protect the most critical provisions on the table”.
He said that the document expected after the Nairobi meeting “must include and revisit proposals backed by a large number of countries, especially on plastic production, that have previously been disregarded”.
“These measures are essential to addressing the crisis at its source and must be reinstated as a key part of the negotiations,” he added.
The post Roadmap launched to restart deadlocked UN plastics treaty talks appeared first on Climate Home News.
Roadmap launched to restart deadlocked UN plastics treaty talks


-
Greenhouse Gases7 months ago
Guest post: Why China is still building new coal – and when it might stop
-
Climate Change7 months ago
Guest post: Why China is still building new coal – and when it might stop
-

 Greenhouse Gases2 years ago
嘉宾来稿:满足中国增长的用电需求 光伏加储能“比新建煤电更实惠”
-
Climate Change2 years ago
Bill Discounting Climate Change in Florida’s Energy Policy Awaits DeSantis’ Approval
-

 Climate Change2 years ago
嘉宾来稿:满足中国增长的用电需求 光伏加储能“比新建煤电更实惠”
-
Climate Change Videos2 years ago
The toxic gas flares fuelling Nigeria’s climate change – BBC News
-

 Carbon Footprint2 years ago
US SEC’s Climate Disclosure Rules Spur Renewed Interest in Carbon Credits
-
Renewable Energy2 years ago
GAF Energy Completes Construction of Second Manufacturing Facility