
As it passes its midway point, 2025 is on track to be the second or third warmest year on record, Carbon Brief analysis shows.
However, it is very unlikely to beat 2024 as the hottest year.
This is not surprising, as 2024’s record temperatures were boosted by a strong El Niño event that has now faded.
The analysis also finds there is a less than 10% chance that average temperatures in 2025 will be more than 1.5C above pre-industrial levels.
However, with long-term warming trending strongly upward and, potentially, accelerating, the world is expected to firmly pass the Paris Agreement 1.5C target – which refers to long-term warming, rather than annual temperatures – in the next five years.
In this latest state of the climate quarterly update, Carbon Brief finds:
- So far, 2025 has seen record warm temperatures in January, the third warmest February and June and the second warmest monthly temperatures for March through May on record.
- The world, as a whole, has warmed approximately 1.1C since 1970 – and around 1.4C since the mid-1800s.
- Neutral El Niño Southern Oscillation (ENSO) conditions are expected to persist for the remainder of the year and into 2025.
- Arctic sea ice extent hit record low levels for much of June and into early July – and remains well below the historical range (1979-2010).
Second-warmest first six months of the year
In this assessment, Carbon Brief analyses records from five different research groups that report global surface temperature records: NASA, NOAA, Met Office Hadley Centre/UEA, Berkeley Earth and Copernicus/ECMWF.
These records are combined into an aggregate that reflects a single best-estimate, following the approach used by the World Meteorological Organization (WMO).
The first six months of 2025 have been very warm, each of them coming in the top-three warmest on record across all the different scientific groups that report on global surface temperatures. This is despite the presence of moderate La Niña conditions in the tropical Pacific at the start of the year, which typically suppress global temperatures.
The table below shows the rank of each month in 2025 relative to all the months since the dataset began (1850 for NOAA, Hadley/UAE and Berkeley Earth, 1880 for NASA, and 1940 for Copernicus/ECMWF). Hadley/UAE has been unusually slow in reporting data in 2025 and currently only has global mean surface temperature value available up to February.
It demonstrates how January 2025 was the warmest January on record in the WMO aggregate, March, April and May the second warmest and February and June the third warmest.
| Monthly rank | NASA | NOAA | Hadley/UAE | Berkeley Earth | Copernicus / ECMWF | WMO avg |
|---|---|---|---|---|---|---|
| Jan | 1st | 1st | 1st | 1st | 1st | 1st |
| Feb | 3rd | 3rd | 3rd | 3rd | 3rd | 3rd |
| Mar | 2nd | 1st | 1st | 2nd | 2nd | |
| Apr | 2nd | 2nd | 2nd | 2nd | 2nd | |
| May | 2nd | 2nd | 2nd | 2nd | 2nd | |
| Jun | 3rd | 3rd | 3rd | 3rd | 3rd |
When combined, the first six months of the year in 2025 were the second warmest first half of the year in the historical record. Temperatures averaged at just 0.08C below the record set in 2024 after the peak of a strong El Niño event, as shown in the figure below.

When combined, the first six months of the year in 2025 were the second warmest first half of the year in the historical record. Temperatures averaged at just 0.08C below the record set in 2024 after the peak of a strong El Niño event, as shown in the figure below.
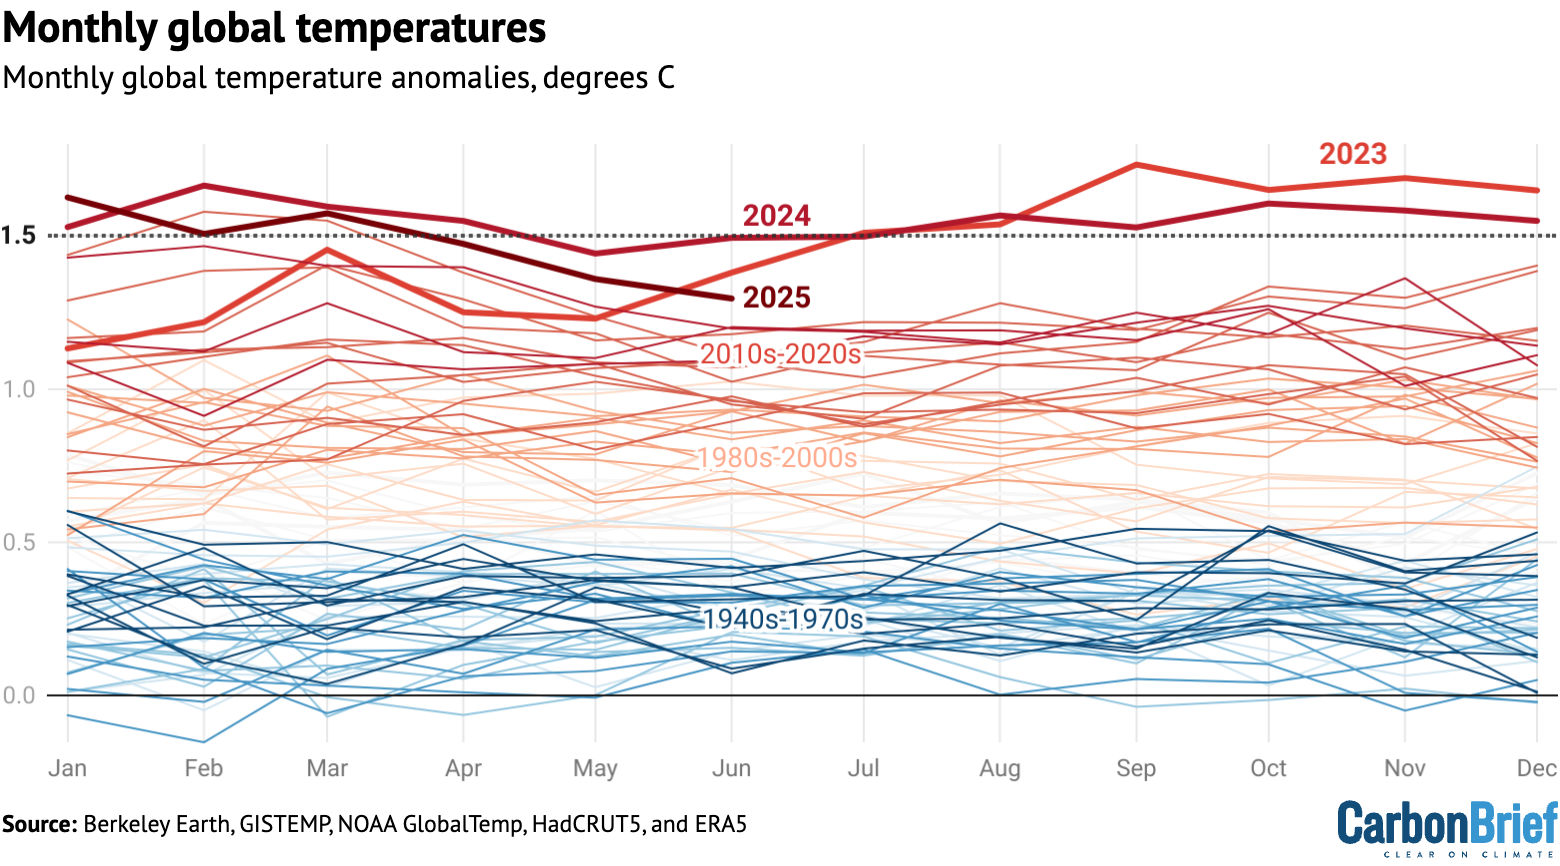
Global surface temperature is currently around 1.4C above preindustrial levels – in-line with the best estimate of the human contribution to global warming. Most of this warming – around 1.1C – has happened just since 1970.
However, global surface temperatures have been declining in May, April and June from highs at the beginning of 2025. This is driven in part by continued cooling of sea surface temperatures after an El Niño-driven peak in early 2024, as well as a contribution from short-lived weak La Niña conditions at the start of the year.
The figure below shows a range of different forecast models for ENSO conditions for the rest of this year, produced by different scientific groups. The values shown are sea surface temperature variations in the tropical Pacific – known as the El Niño 3.4 region – for overlapping three-month periods.

Neutral ENSO conditions are expected to persist through the start of 2026 in most models, with a handful of models showing a return to weak La Niña conditions (defined as El Niño 3.4 region sea surface temperatures under-0.5C) in the autumn and winter months. No models expect the development of El Niño conditions in 2025 and early 2026.
On track to be the second or third warmest year
Carbon Brief has created a projection of what the final global average temperature for 2025 will likely be by looking at the relationship between January-June temperatures and the annual average for each year since 1970. The projection also takes into account ENSO conditions in the first six months of the year and their projected development.
The analysis includes the estimated uncertainty in 2025 outcomes, given that temperature averages from only the first quarter of the year are available so far.
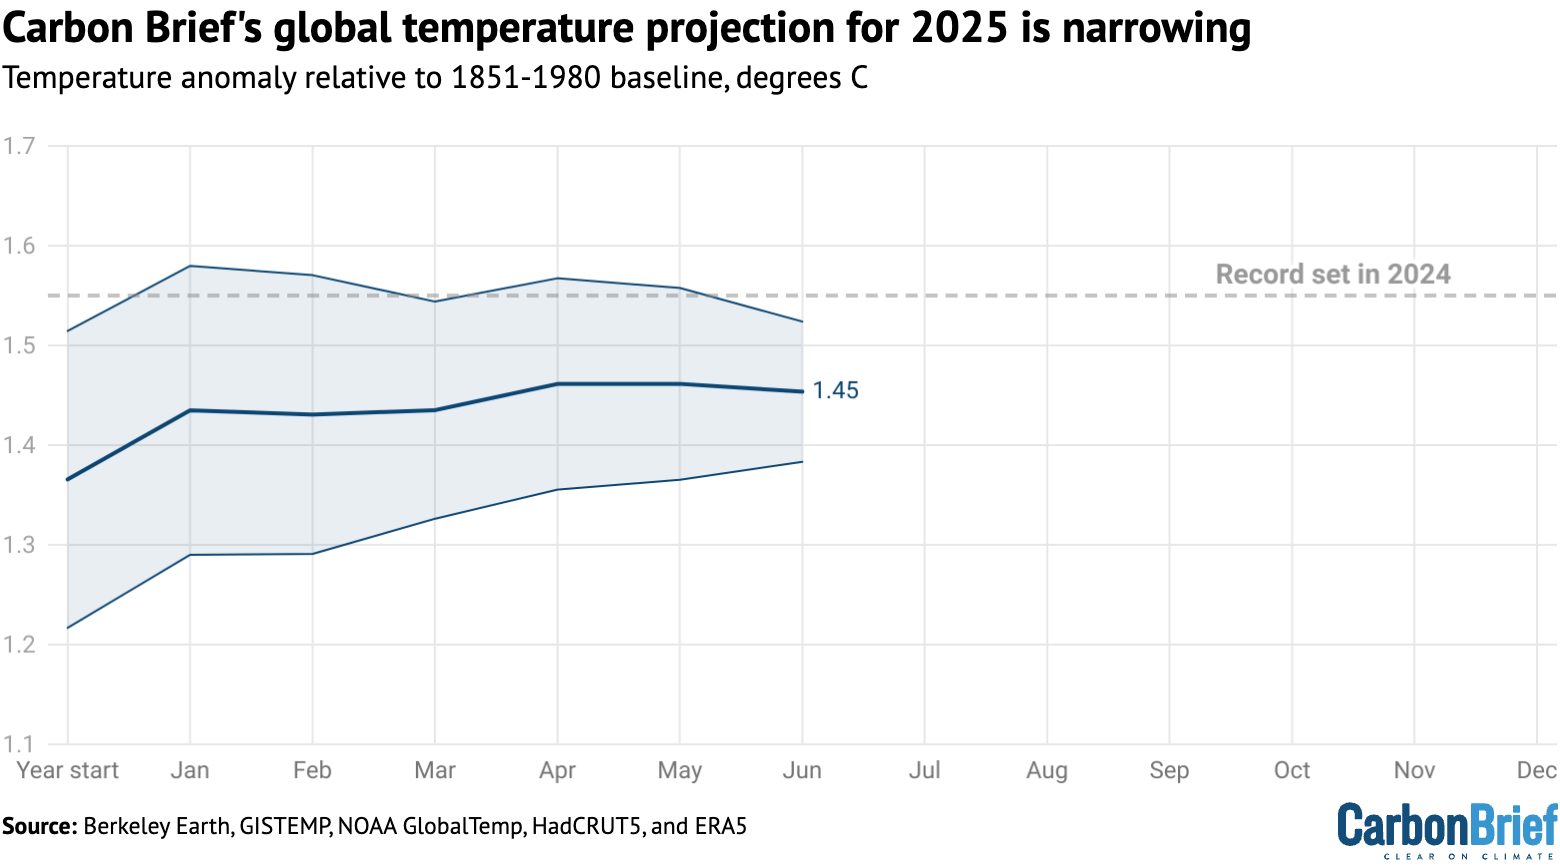
The chart below shows the expected range of 2025 temperatures using the WMO aggregate – including a best-estimate (red) and year-to-date value (yellow). Temperatures are shown with respect to the pre-industrial baseline period (1850-1900).

Carbon Brief’s projection suggests that 2025 is virtually certain to be one of the top-three warmest years on record, with a best-estimate suggesting that global average temperatures will be approximately equal to 2023.
Currently, there is a less than 1% chance of 2025 being the warmest year on record, a 51% chance of it being the second warmest and a 49% chance of it being the third warmest. There is a roughly 9% chance that 2025 annual temperatures will exceed 1.5C above pre-industrial levels.
(A single year exceeding 1.5C is not equivalent to a breach of the Paris Agreement goal to limit temperature increases to 1.5C, which has been widely interpreted to mean temperature averages over 20 years.)
The figure below shows Carbon Brief’s estimate of 2025 temperatures using the WMO aggregate, both at the beginning of the year and once each month’s data has come in. The estimate jumped notably after 2025 saw the warmest January on record, but has been relatively stable over the past six months.
Record or near-record warmth in many regions
While global average temperatures are an important indicator of changes to the broader climate system over time as a result of human activities, these impacts will differ as some regions experience more rapid warming or extreme heat events than is reflected in the global average.
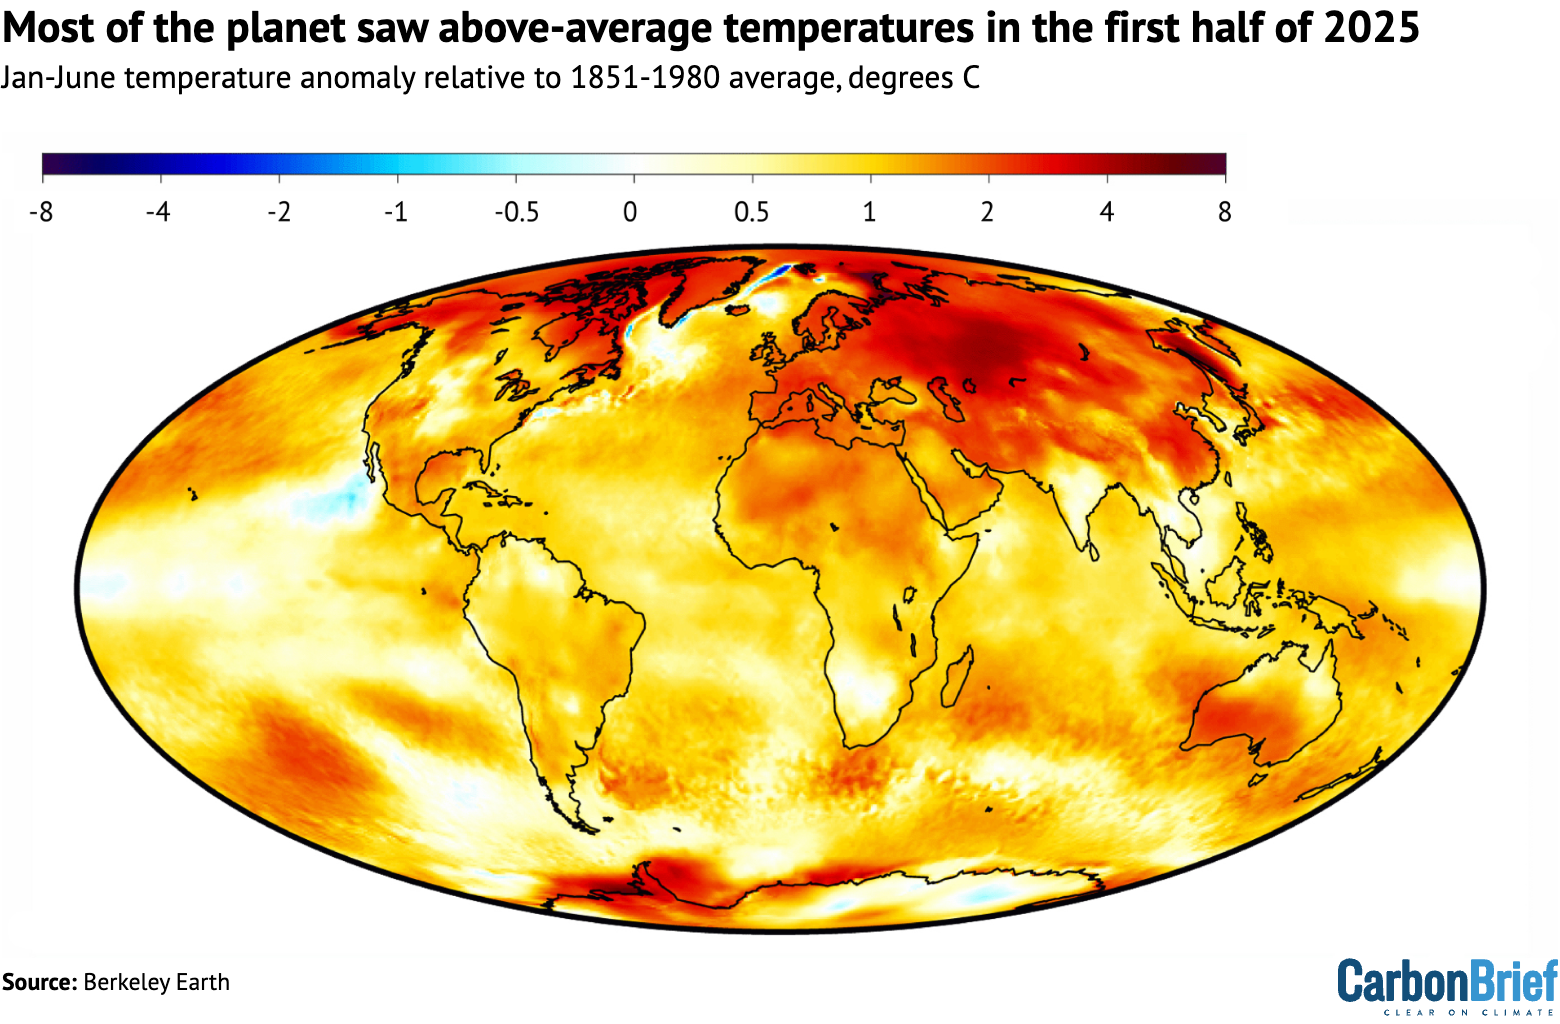
The figure below shows the temperature anomalies for the first six months of the year relative to the 1951-1980 baseline period used by Berkeley Earth. Virtually the whole planet except a small area off the coast of Baja Mexico and in Antarctica saw temperatures warmer than that baseline, with much of Europe and Asia around 2C warmer than the 1951-1980 period.
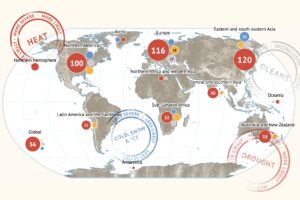
A number of areas saw record warm temperatures over January through to June in the Berkeley Earth dataset, compared to all prior years since the global temperature record began in 1850.
The figure below shows areas of record warm temperatures in dark red; there were no areas with record – or even top-five – cool temperatures. (For more, read Carbon Brief’s factcheck on how climate change is not making extreme cold more common).

Notable areas of record warmth include much of China, south-west Australia and the Mediterranean region. Western Europe, in general, was quite warm, though most land areas did not see a new record set. Overall, approximately 7% of the surface saw record warming in the first six months of the year.
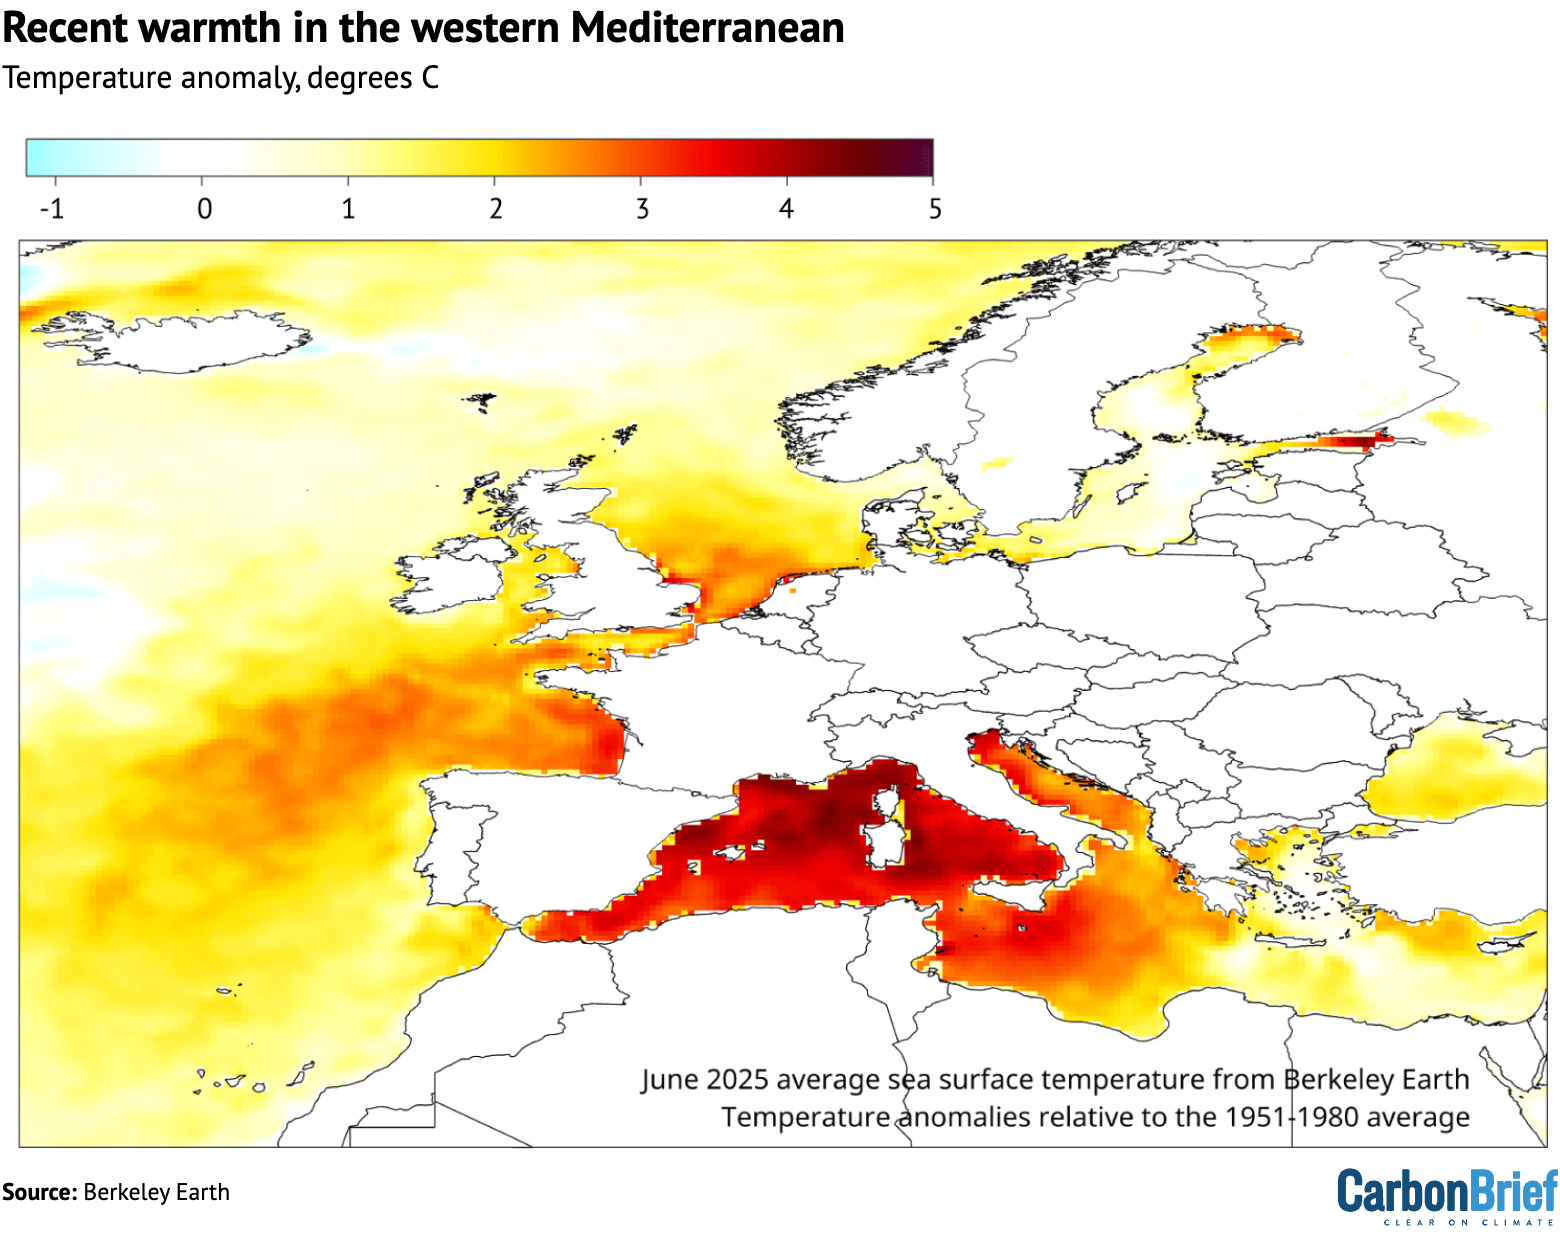
In June, the western Mediterranean saw particularly exceptional warmth, as shown in the figure below. This marine heatwave was driven by a combination of short-term natural variability on top of the long-term warming trend in the region.
The temperature increase in the western Mediterranean region in July – relative to the long-term warming trend – represents the largest short-term increase in temperatures for the region since June 2003, which was a precursor to a devastating heatwave that is believed to have killed 70,000 people.
Record-low Arctic sea ice extent in June
Arctic sea ice extent saw record lows for much of June 2025 and early July, moving out of record territory in mid-July, but remaining far below the historical range (1979-2010).
Antarctic sea ice extent has been at the low end of the historical range for much of the year, but has not set new records aside from a brief period in late February and early March.
The figure below shows both Arctic and Antarctic sea ice extent in 2025 (solid red and blue lines), the historical range in the record between 1979 and 2010 (shaded areas) and the record lows (dotted black line).
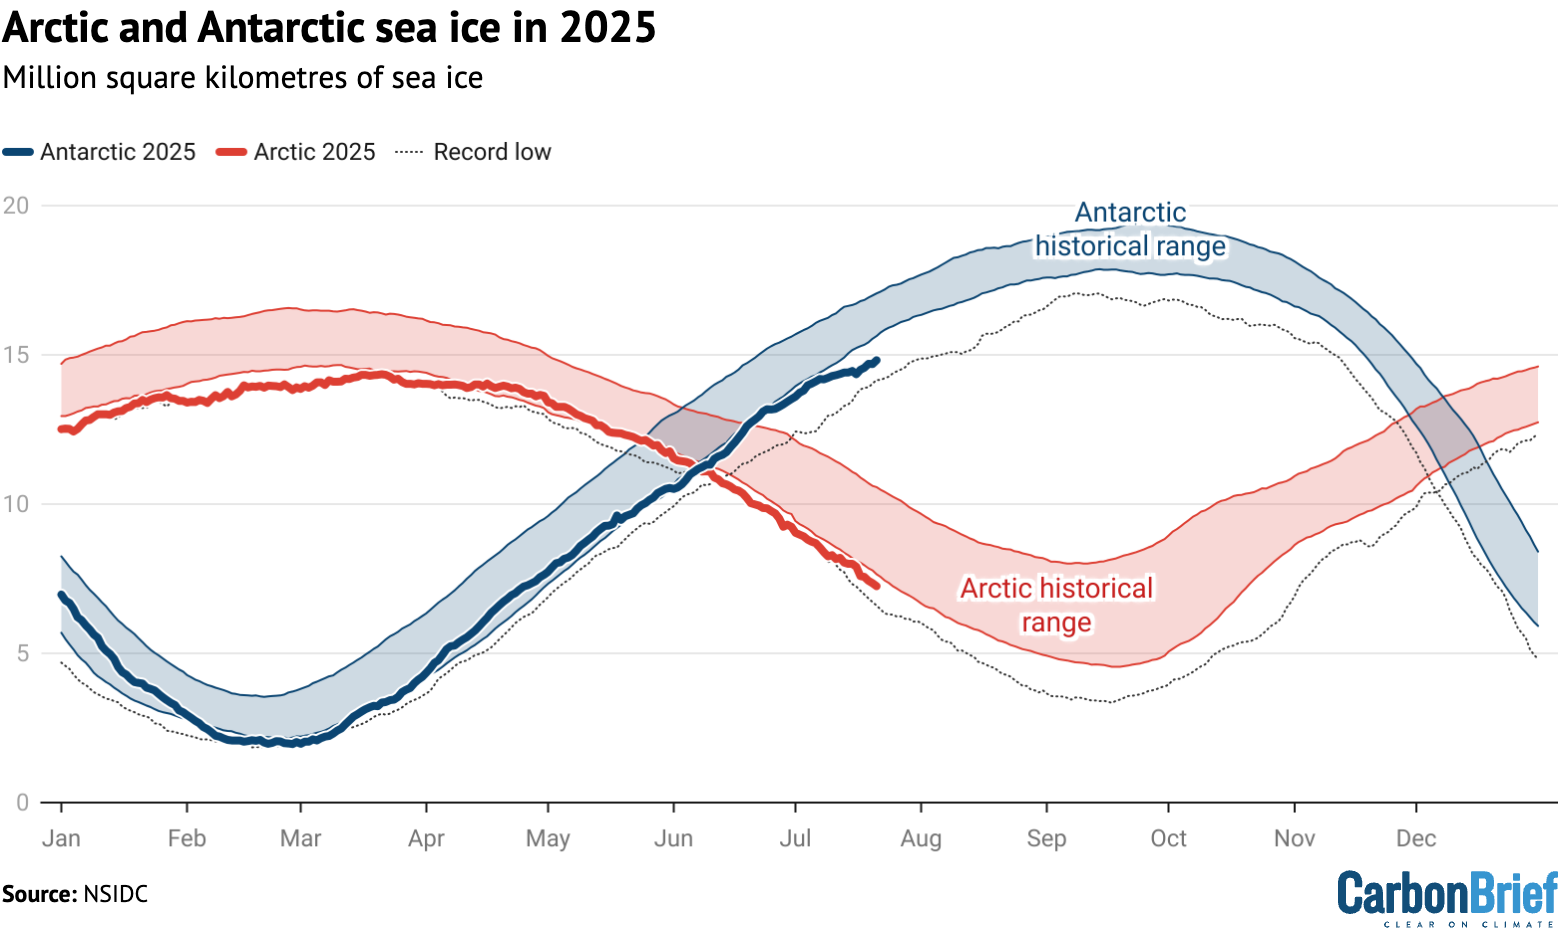
Unlike global temperature records, which only report monthly averages, sea ice data is collected and updated on a daily basis, allowing sea ice extent to be viewed up to the present.
However, this dataset – which has been continuously measured by satellites and assembled by the US National Snow and Ice Data Center (NSIDC) since 1979 – may soon be less available.
The US Department of Defence is planning to cease provision of satellite sea ice extent data to the NSIDC at the end of July. While some other satellite instruments can be used to help fill in the gaps, the change will degrade the scientific ability to effectively track this key climate variable.


The post State of the climate: 2025 on track to be second or third warmest year on record appeared first on Carbon Brief.
State of the climate: 2025 on track to be second or third warmest year on record
Four Ugandan farmers filed a case with London’s High Court on Tuesday, aiming to stop the East African Crude Oil Pipeline (EACOP) from starting to operate by asking the court to apply Uganda’s laws against the project’s UK-registered company.
The controversial 1,443-kilometre (897-mile) pipeline, majority-owned by French energy company TotalEnergies, aims to carry crude from Ugandan fields for export through neighbouring Tanzania. About 80% has been built so far, according to its developers.
The pipeline’s first oil exports are expected as soon as October, according to its developers, and the campaign group Avaaz, which is backing the farmers’ crowdfunded lawsuit, called it “one final chance to stop one of the worst oil pipelines on the planet”.
The claim, filed by London law firm Leigh Day, argues that EACOP Ltd’s role in developing and operating the pipeline breaches Ugandan laws that protect citizens’ right to a clean and healthy environment.
-
Ugandan farmers use British court to try to stop East Africa oil pipeline
The farmers and their lawyers will argue that a UK-based entity linked to the East African Crude Oil Pipeline has breached Ugandan law and construction should halt -
French court rules Total must revise climate plan to account for all emissions
Oil and gas giant TotalEnergies has been given six months by a court to publish a more robust climate plan -
Uganda cites contentious IEA fossil fuel scenario backed by Trump administration
Critics of the African nation’s oil ambitions say referencing the International Energy Agency’s most pessimistic scenario for climate action is a risky policy


One of the claimants, Racheal Tugume, told a press conference she had been displaced from her land due to the pipeline’s construction, which she said had damaged local rivers, wildlife and ecosystems that communities depend on for their livelihoods just as erratic weather linked to climate change takes an increasing toll.
“I am very happy that there are people in countries like the UK who are listening to us, who are behind us and who have come to support us,” Tugume said, adding that she hoped the case would bring justice to communities affected by the pipeline.
Ugandan law in UK court
While the pipeline is a joint venture led by TotalEnergies, with smaller stakes owned by Ugandan, Tanzanian and Chinese national oil firms, it is operated by EACOP Ltd, a company registered to an office in London’s Canary Wharf financial district.
EACOP Ltd did not respond to a request for comment.
The claim appears to be the first attempt to have Uganda’s climate and environmental protections enforced in a foreign court, partly reflecting concerns over whether cases challenging the multibillion-dollar pipeline would get a fair trial in Uganda.
Ugandans living near new oil pipeline let down by compensation programmes
Concerns about access to a fair hearing are among the issues the court will consider when deciding if it should take on the case, said Matthew Renshaw, partner at Leigh Day.
Renshaw said that precedents including the Nigerian oil pollution case against Shell have shown that claims against British-registered companies for harms overseas can be successfully fought in UK courts.
“We are proud to represent the four brave principled individuals,” Renshaw said.
Constitutional protections
The pipeline project has already been subject to repeated lawsuits in several countries, none of which have succeeded. A climate lawsuit filed in Uganda more than a decade ago by a group of young people has yet to conclude. Another at the East African Court of Justice, brought by campaign groups against Uganda and Tanzania, was rejected on procedural grounds last November.
A separate ongoing lawsuit in TotalEnergies’ home country of France – a refiled version of an earlier failed claim – cannot stop EACOP going ahead, but it does seek damages from TotalEnergies for affected communities.
With the newly launched case, Leigh Day’s legal adviser Marc Willers said the claim draws on specific Ugandan laws in a bid to stop EACOP’s operations.
Uganda may see lower oil revenues than expected as costs rise and demand falls
These include the Ugandan constitution, a 2019 environmental law and the National Climate Change Act 2021, which gives Ugandans the right to bring a case before a court in circumstances where anyone or any entity threatens the country’s ability to mitigate climate change.
Stopping a “carbon bomb”
The pipeline, which will link Uganda’s Lake Albert oil fields to Africa’s east coast in Tanzania, has already displaced thousands of people and cuts through the Lake Victoria basin, one of East Africa’s major freshwater systems and a critical water source for around 40 million people.
According to the BankTrack non-profit, when the pipeline is at peak production, it will carry 216,000 barrels of crude oil per day and release over 33 million tonnes of carbon emissions each year. Over its full lifetime of 25 years, it is estimated to release about 379 million tonnes of greenhouse gas emissions across its value chain including construction, refining and product use.
A May 2026 report from Earth Insight also warns that the pipeline and related infrastructure could affect 158 wetlands in Uganda, 11 rivers, 44 protected areas and seven key biodiversity areas while disrupting about 2,000 square km of protected wildlife habitats.
This is why the primary focus of the UK court case is to stop the operation of the pipeline in its tracks, Leigh Day’s Willers said, calling it a “carbon bomb” that would worsen the world’s climate crisis.
Long wait for first hearing
While the purpose of the case is to stop the pipeline from launching operations, Renshaw said it could take about 12 months before the case gets a first hearing and about 18 months before it goes to trial.
Billions unlocked as Green Climate Fund agrees to spend more and save less
The farmers are, however, seeking an injunction to stop EACOP Ltd from proceeding with operations. In the event that shipments begin, the lawsuit will still seek to stop the pipeline from then on, Renshaw said.
“We will be doing what we can to expedite matters but it is possible that EACOP will have started operating the pipeline before the claim is heard. If that is the case, the claim would intend to halt operations from that point. For example, the pipeline may operate for just one year rather than 30-plus, resulting in far less harm,” he said.
The post Ugandan farmers launch UK court case against East African oil pipeline appeared first on Climate Home News.
Ugandan farmers launch UK court case against East African oil pipeline
Climate Change
Cited 7 July 2026: ‘Impossible’ heat | Global ocean record | Climate change and the ozone hole
Welcome to Cited, your essential guide to new climate research.
In the news
‘HEAT ALERT’: At least 25 people died as a “heat dome” smothered the eastern half of the US, reported the Guardian, with more than 20 states under “stifling temperatures more than 100F (38C)”. More than 140 million people were under heat alerts, the outlet said, with dead bodies found in “homes with no air conditioning, outside their residences, on the street and in parked cars”. Analysis by World Weather Attribution (WWA) found that the combined heat and humidity would have been “virtually impossible” without human-caused warming, reported the New York Times.
‘MORTALITY WILL RISE FURTHER’: Meanwhile, extreme heat continued to hit Europe, with Le Monde reporting on temperatures of 40C in France, Portugal and Spain again this past weekend, alongside “devastating” wildfires. Public Health France doubled its preliminary estimate of the “excess deaths” from the extreme heat in late June, from 1,000 to more than 2,000, according to the Guardian. The higher figure was still “probably an underestimate”, the agency said. Analysis published by Carbon Brief put the figure at 2,700 heat-related deaths. A WWA attribution study, covered by Carbon Brief, found that Europe’s June heatwave would have been “virtually impossible” even 50 years ago.
‘BOOST TO GLOBAL TEMPERATURES’: The UN World Meteorological Organization (WMO) “raised its forecast for the rapid emergence of a strong El Niño in the coming months, warning that the phenomenon is likely to drive global temperatures higher”, reported Reuters. A WMO scientist told the newswire that “El Niño conditions have emerged in the equatorial Pacific and there is a remarkable agreement between forecast models that this will be a strong El Niño”.
Research picks
Extremes
- The annual season when “intense” tropical cyclones occur has lengthened by 10-14 days per decade across the world since the 1980s | Nature Communications
- There is an “increasing” and “overlooked” global threat from glacial outburst floods from small lakes | Nature Sustainability
- Female smallholder farmers in sub-Saharan Africa experience crops losses 2-2.5 times greater than male smallholders in periods of extreme heat | Nature Sustainability
Policy
- The summaries for policymakers in Intergovernmental Panel on Climate Change (IPCC) mitigation reports over 2001-22 “have not yet become more solution-oriented while abiding by their policy-neutrality principle” | npj Climate Action
- Two-thirds of countries address inequality in their national pledges under the Paris Agreement – particularly in “countries with lower levels of human development and greater income inequality” | Climate and Development
- To “future proof” the Paris Agreement’s “well-below 2C” limit, it should be interpreted as a median “peak warming” of 1.6-1.8C, rather than a 66-90% chance of staying below 2C | Nature Climate Change
Land sink
- From 2001 to 2015, northern Eurasia absorbed about 0.47bn tonnes of carbon each year – around one-third of the total global land carbon sink | Global Biogeochemical Cycles
- Model simulations of potential land-use carbon emissions out to 2100 show that “deforestation and forest regrowth dominate variability” of emissions, with policy timing and ambition “exerting strong control” | Nature Communications
- Tropical forests are facing an increase in areas that exceed critical temperatures where their “photosynthetic system breaks down” | Proceedings of the National Academy of Sciences
Captured
On 21 June, global average sea surface temperature (SST) reached a record high for the day of the year, according to the Copernicus Climate Change Service (C3S). Daily SST for the global ocean, excluding polar regions, reached 20.86C on 21 June, exceeding the 20.83C reached on the same day in both 2023 and 2024, the C3S said. Global SST has remained at record levels for every day since. The conditions “could indicate the beginning of a new phase, leading, once more, to uncharted territory”, said C3S director Carlo Buontempo.
56 hours and 30 hours
The amount of time that the average lifespan of tropical cyclones in the north-east and north-west Pacific has shortened, respectively, over 1982-2024, according to a study in npj Climate and Atmospheric Science. This shorter lifespan “compresses the time available for weather forecasting and disaster preparedness”, the authors said.
Spotlight
The ozone hole and climate change
As a new “thought experiment” asks whether the hole in the ozone layer could, theoretically, have been identified decades before it was discovered, Carbon Brief explores the interactions between climate change and the ozone hole.
It is now more than 40 years since the discovery of the hole in the ozone layer over Antarctica, detailed in the journal Nature in 1985.
A study more than a decade earlier had predicted that chlorine-based substances – such as chlorofluorocarbons (CFCs) – could lead to the destruction of ozone in the stratosphere.
So, in theory, how early could the ozone hole have been detected?
New research, published in the Proceedings of the National Academy of Sciences, explored this very question.
Study co-author Prof Susan Solomon from the Massachusetts Institute of Technology is a leading atmospheric scientist. In the late 1980s, Solomon and colleagues identified the mechanism behind how CFCs were causing ozone depletion.
The new study is a “thought experiment”, Solomon told Carbon Brief, asking when scientists could have discovered the ozone hole had they had access to modern satellite observations.
“We found that depletion could have been detected as early as 1957 in the tropical upper stratosphere, where natural variability is especially small,” explained Solomon.
This would have been before the use of CFCs became widespread, Solomon added. Instead, early ozone depletion was caused by carbon tetrachloride, a chemical used as a cleaning agent, as well as in fire extinguishers and for producing refrigerants.
For many decades, the ozone hole and global warming have often been confused by the public and the media, Solomon explained:
“It’s common to imagine that because ozone is so important at shielding us from the UV [ultraviolet] light that causes skin cancer, then having less ozone must mean the Earth would warm up.”
For example, in a 1995 editorial, the Los Angeles Times congratulated the Nobel prize-winning chemists who identified the threat of CFCs to the ozone layer. The newspaper noted that these processes “threaten calamitous global warming by damaging the Earth’s protective layer of ozone”.
However, said Solomon, “the Earth is warmed much more by visible light – UV doesn’t really contribute, so ozone depletion doesn’t cause significant warming”.
Regional impacts
The depletion of ozone actually has a very small cooling effect at the Earth’s surface. But this is more than outweighed by the warming impact of CFCs and other ozone-depleting substances.
This warming impact means that efforts to reverse ozone depletion have had a beneficial impact on the climate.
The Montreal Protocol, a 1987 international agreement to phase out CFCs, “has played – and is playing – a very substantial role in safeguarding climate too”, said Solomon:
“It turns out that the CFCs and their replacement gases HCFCs [hydrochlorofluorocarbons] are strong greenhouse gases, so phasing out their production has not only avoided a lot of ozone depletion that would otherwise have occurred, it also had a big influence on global warming.”
HCFCs were considered as “transitional substitutes” for CFCs – they still damaged ozone, but to a lesser extent – until ozone-safe alternatives were commercially available.
Hydrofluorocarbons (HFCs), which are not ozone depleting, began to be used widely in the 1990s. However, HFCs are also potent greenhouse gases. HFCs and similar replacements are now being phased out under the 2016 Kigali Amendment to the Montreal Protocol.
While the ozone hole itself has only a very small impact on global temperatures, it does have a clear impact on the regional climate over Antarctica.
Prof David Thompson from Colorado State University, working with colleagues including Solomon, has published research demonstrating that “changes in southern-hemisphere winds linked to the stratospheric ozone losses extend all the way down to the ground in some seasons”, explained Solomon.
This has “reduc[ed] warming that would have occurred in interior Antarctica and enhanc[ed] warming in the Antarctic Peninsula region”, she said.
The knock-on impacts include “wind changes [that] actually extend beyond Antarctica to the mid-latitudes of the southern hemisphere, where they even affect rainfall”, she added.
Preprints to watch
Carbon Brief’s pick of new papers under review
- The drying impact over Africa from using stratospheric aerosol injections to stabilise global temperatures would only be minimised “when combined with a strong decarbonisation effort” | Earth System Dynamics
- The El Niño-Southern Oscillation and Indian Ocean Dipole could “shape” the playing conditions at the Rugby World Cup 2027 in Australia | Journal of Southern Hemisphere Earth Systems Science
- A “strong” weakening of the Atlantic Meridional Overturning Circulation (AMOC) would “profoundly alter the climate-carbon cycle system”, underscoring the “importance of explicitly accounting for AMOC risks in long-term climate assessments” | Earth System Dynamics
Noticeboard
- 6 July-25 September: Registration open for experts to review the first-order draft of the Intergovernmental Panel on Climate Change’s Working Group I report
- 7-15 July: UN High-level Political Forum on Sustainable Development, New York
- 19 July: Application deadline for a postdoctoral scholar in transdisciplinary climate research at Penn State University, US | Salary: unknown
- 22 July: Application deadline for PhD project on “climate change impacts on the Antarctic coastal ocean carbon sink” at the University of East Anglia, UK
- 26 July: Application deadline for PhD projects on “AI for land-atmosphere feedbacks during hydroclimatic extremes” at the Helmholtz School for Integrated Data Science in Environmental & Life Sciences, Germany
- 29 July: Application deadline for an assistant professor in Earth and environmental geosciences (palaeoclimatology) at Colgate University, US | Salary: $97,500-101,500
- 31 July: Application deadline for PhD project on Arctic Ocean methane oxidation at Stockholm University, Sweden
Cited is researched and written by Cecilia Keating, Robert McSweeney, Ayesha Tandon, Daisy Dunne and Dr Giuliana Viglione.
Please send tips, feedback and upcoming climate research to cited@carbonbrief.org
This is an online version of Carbon Brief’s fortnightly Cited email newsletter. Subscribe for free here.


The post Cited 7 July 2026: ‘Impossible’ heat | Global ocean record | Climate change and the ozone hole appeared first on Carbon Brief.
Cited 7 July 2026: ‘Impossible’ heat | Global ocean record | Climate change and the ozone hole
In June 2026, a record-breaking heatwave swept across Europe, with France among the first and hardest hit countries.
In a new analysis, we estimate that the extreme conditions caused more than 2,700 heat-related deaths in France.
We also show how France’s extreme temperatures in June exceeded projections from climate models.
Our findings illustrate the human toll of extreme weather as the world warms.
We also highlight the challenges in projecting the magnitude of future heatwaves and their impacts on people.
Outpacing projections
For most of this century, Europe has seen summer heat extremes that outpace projections from climate models.
Several different factors likely explain this trend, including reductions in planet-cooling aerosols as nations have cleaned up their air pollution, as well as changes in atmospheric circulation patterns, which models struggle to represent.
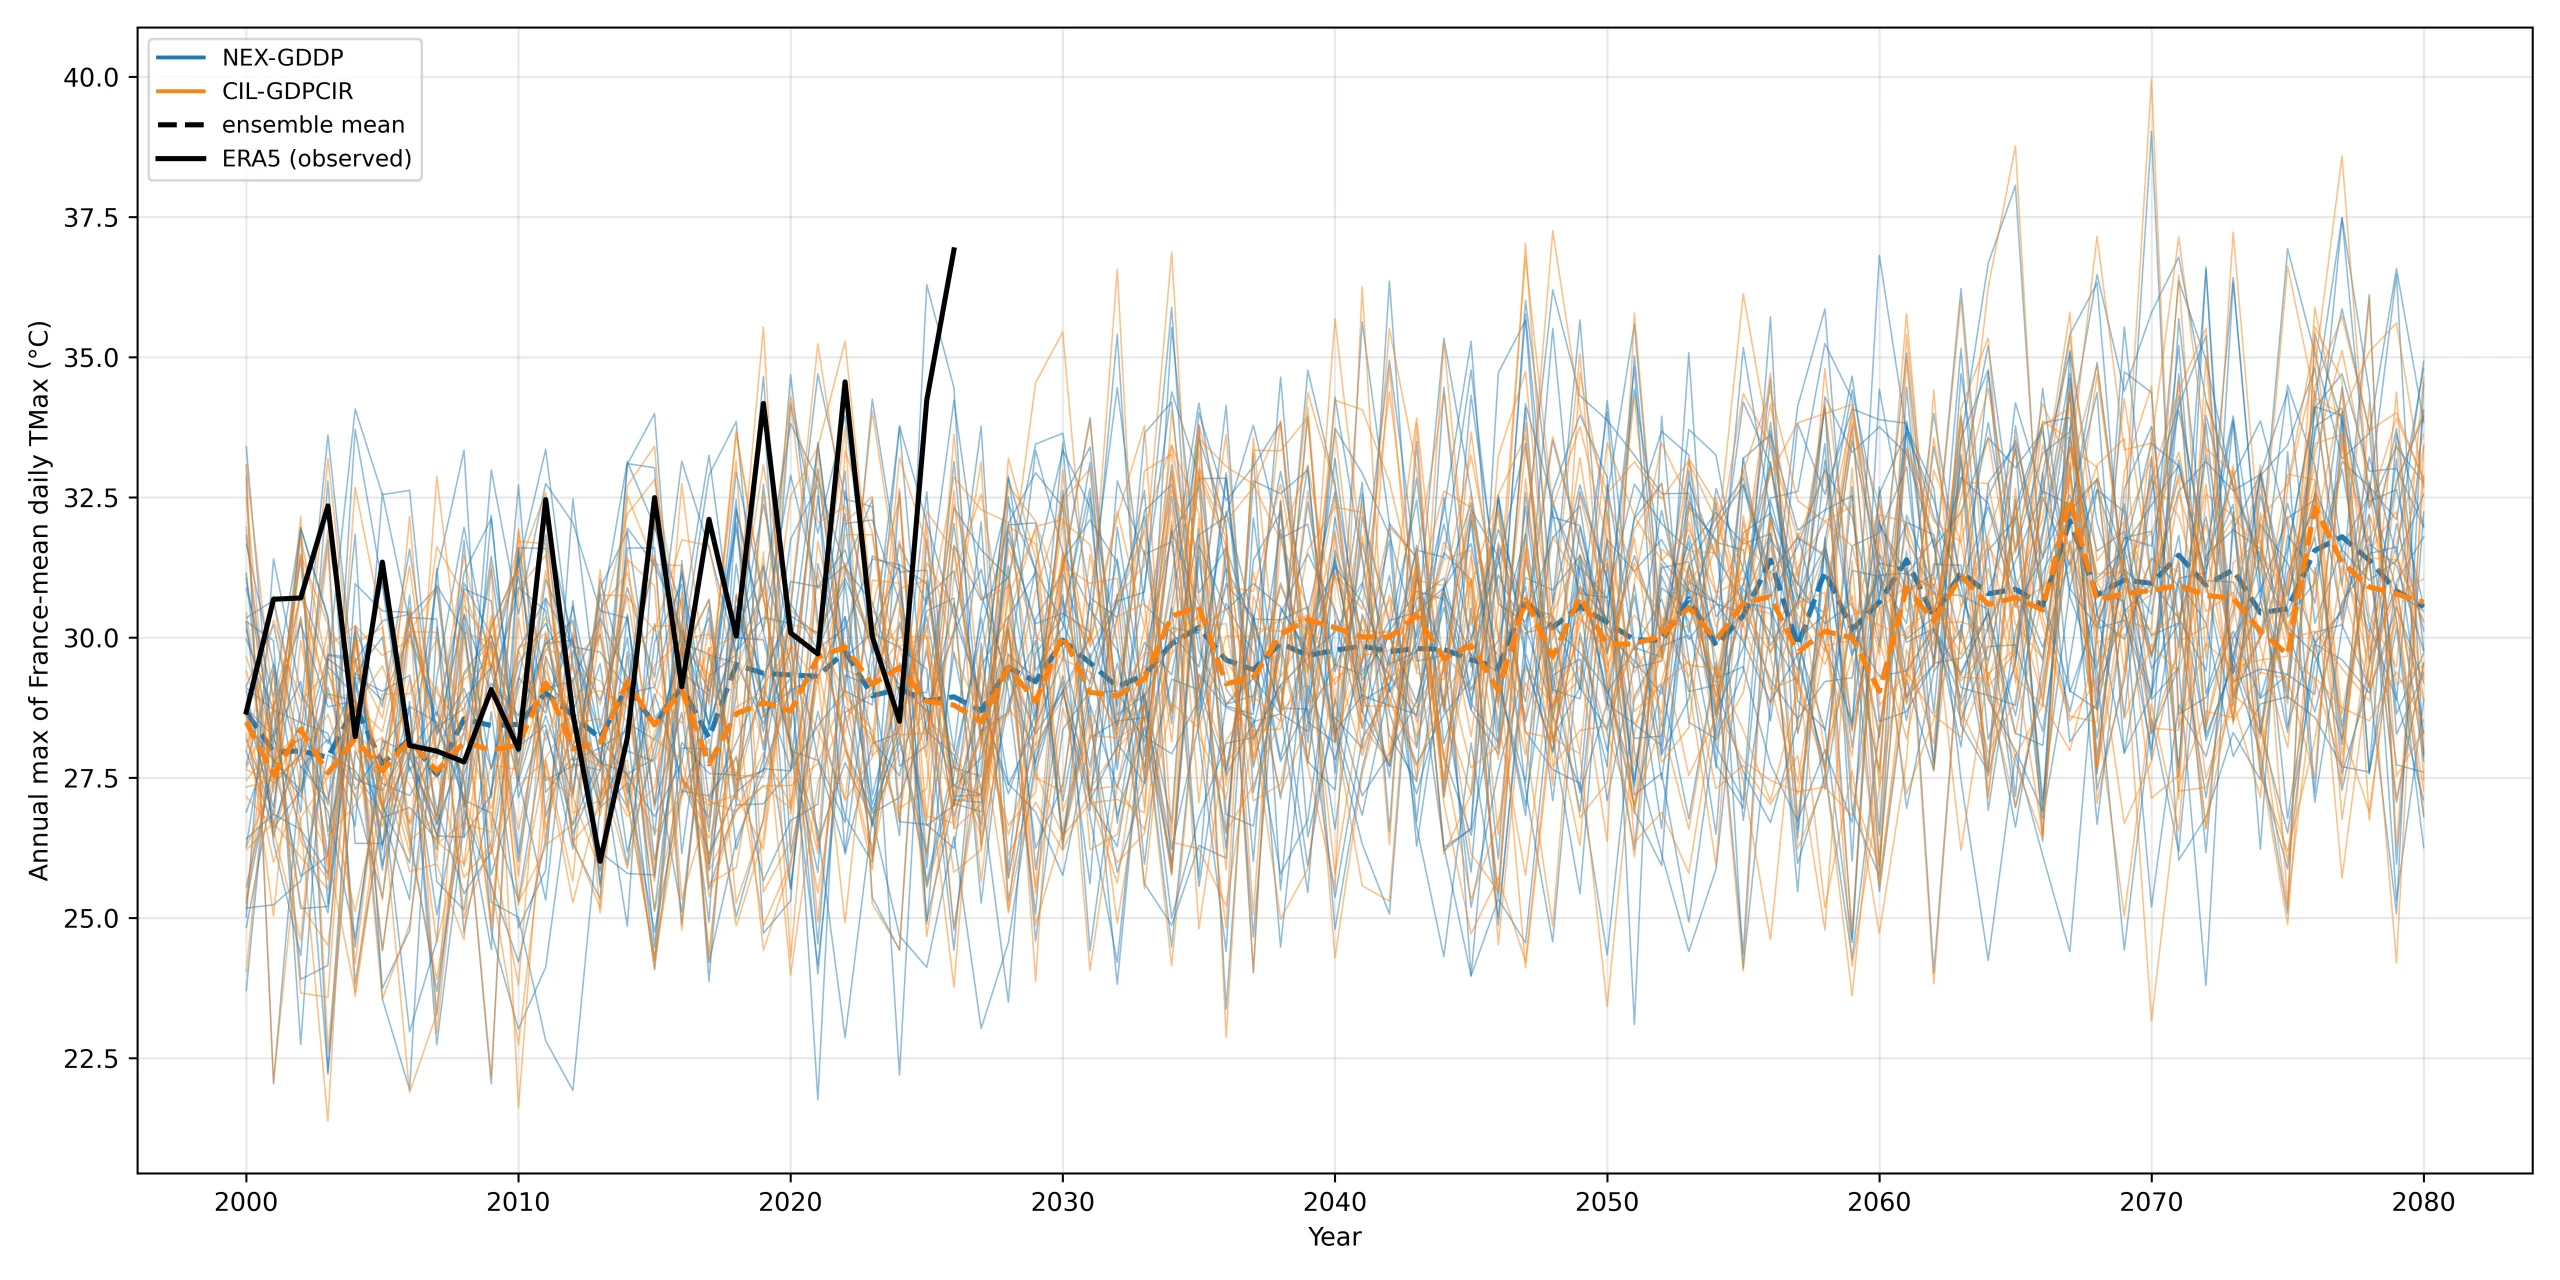
In June 2026, daily high temperatures averaged across France reached 36.9C, shattering the previous June record set in 2022 by 2.4C.
[For more on the impacts and coverage of Europe’s June heatwave, see Carbon Brief’s explainer.]
The rise in observed temperatures in France has outpaced projections made by climate models, with June maximum temperatures more in line with what was expected for the 2070s.
This is illustrated in the figure below, which shows how France’s average maximum daily high temperature for June recorded in 2026 (black line) compares to climate model projections (blue and orange lines).
Counting the death toll of climate change
The downstream impacts of these extreme temperatures are lethal.
Scientists are able to estimate the death toll of high temperatures in many locations, depending on the availability of mortality and climate data.
There are several ways to do this.
One option is to examine death certificates to see which deaths have been directly recorded by physicians as related to heat. However, there is strong evidence that this method significantly undercounts heat-related deaths, as most death certificates do not consider environmental factors such as heat when diagnosing the cause of death.
Alternatively, it is possible to calculate the rate of total (“all-cause”) mortality in a given time period relative to previous time periods – for example, by comparing the total number of deaths in June 2026 compared to the average of previous Junes. This “excess deaths” figure can be used as an estimate of the deaths from a heat wave.
Using this approach, Public Health France attributed around 2,000 deaths in France to the extreme heat in the week of 22-28 June.
Finally, scientists can use long-term data on overall mortality and correlate changes in mortality with changes in temperature to understand the statistical relationship between the two.
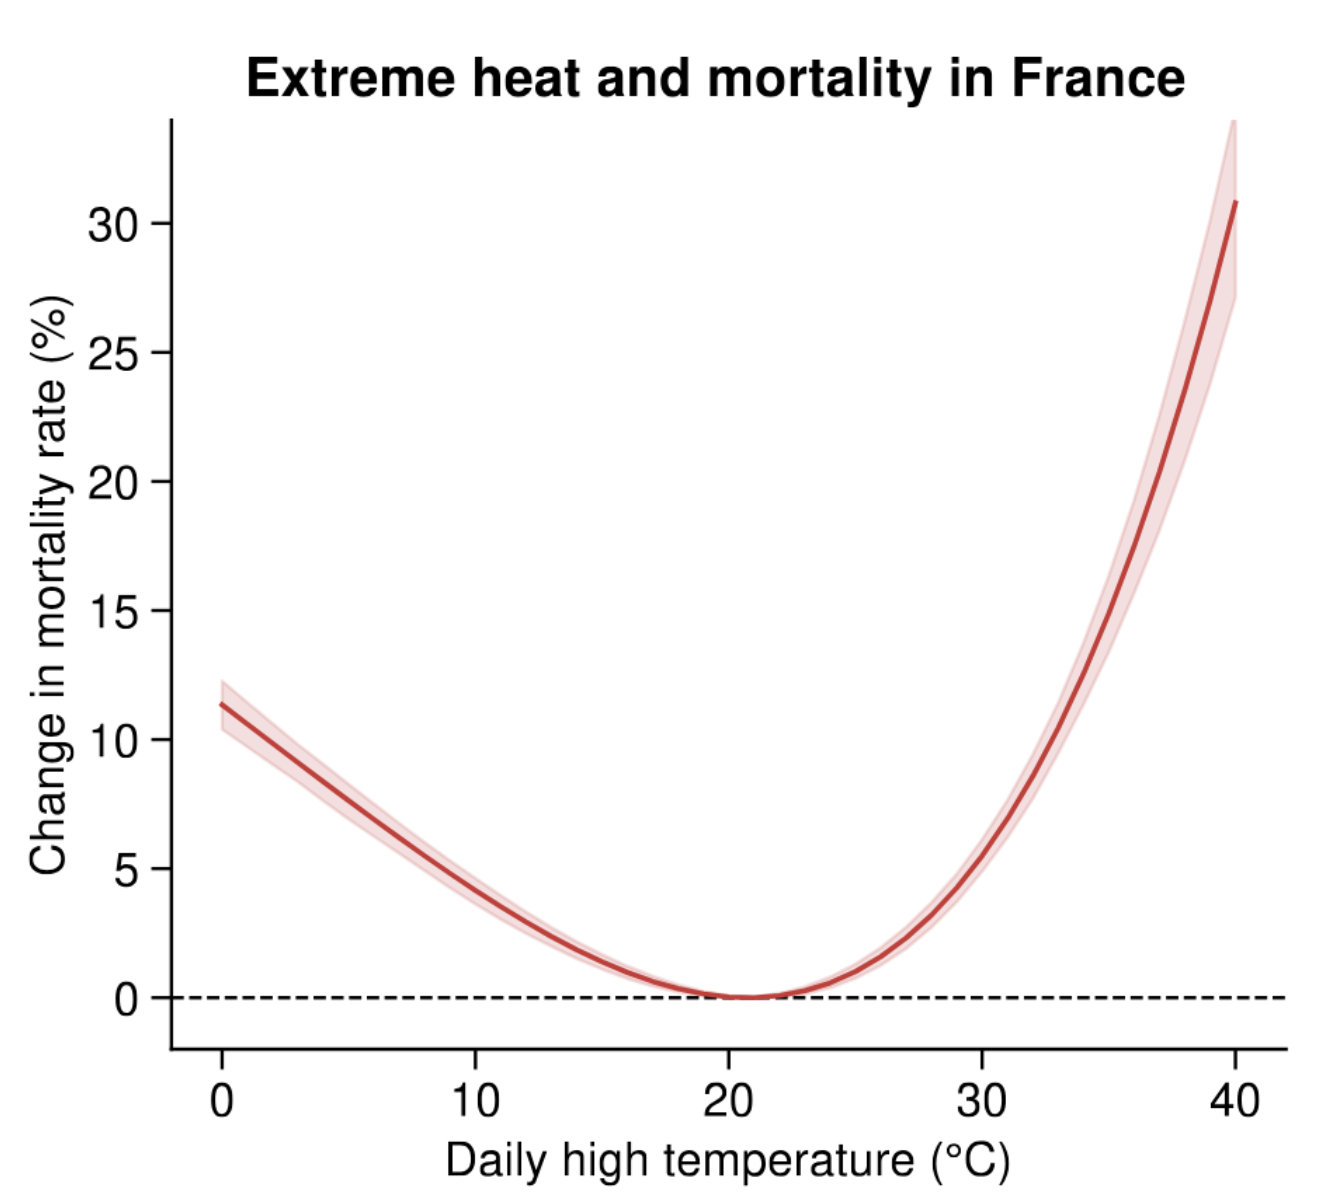
Research published in Proceedings of the National Academy of Sciences in 2025 that used this third approach found that mortality rates in France increase rapidly in cold or hot conditions as daily maximum temperatures depart further from approximately 20C.
This pattern of a U-shaped response of mortality to temperature – shown in the figure below – is very consistent across time periods and regions around the world.
To calculate the death toll of the June 2026 heatwave in France, we compared observed temperatures over 12-29 June to their baseline average over 1980-2025.
The difference between these two temperatures helps us understand how many more people died than they would have in the absence of such extreme conditions.
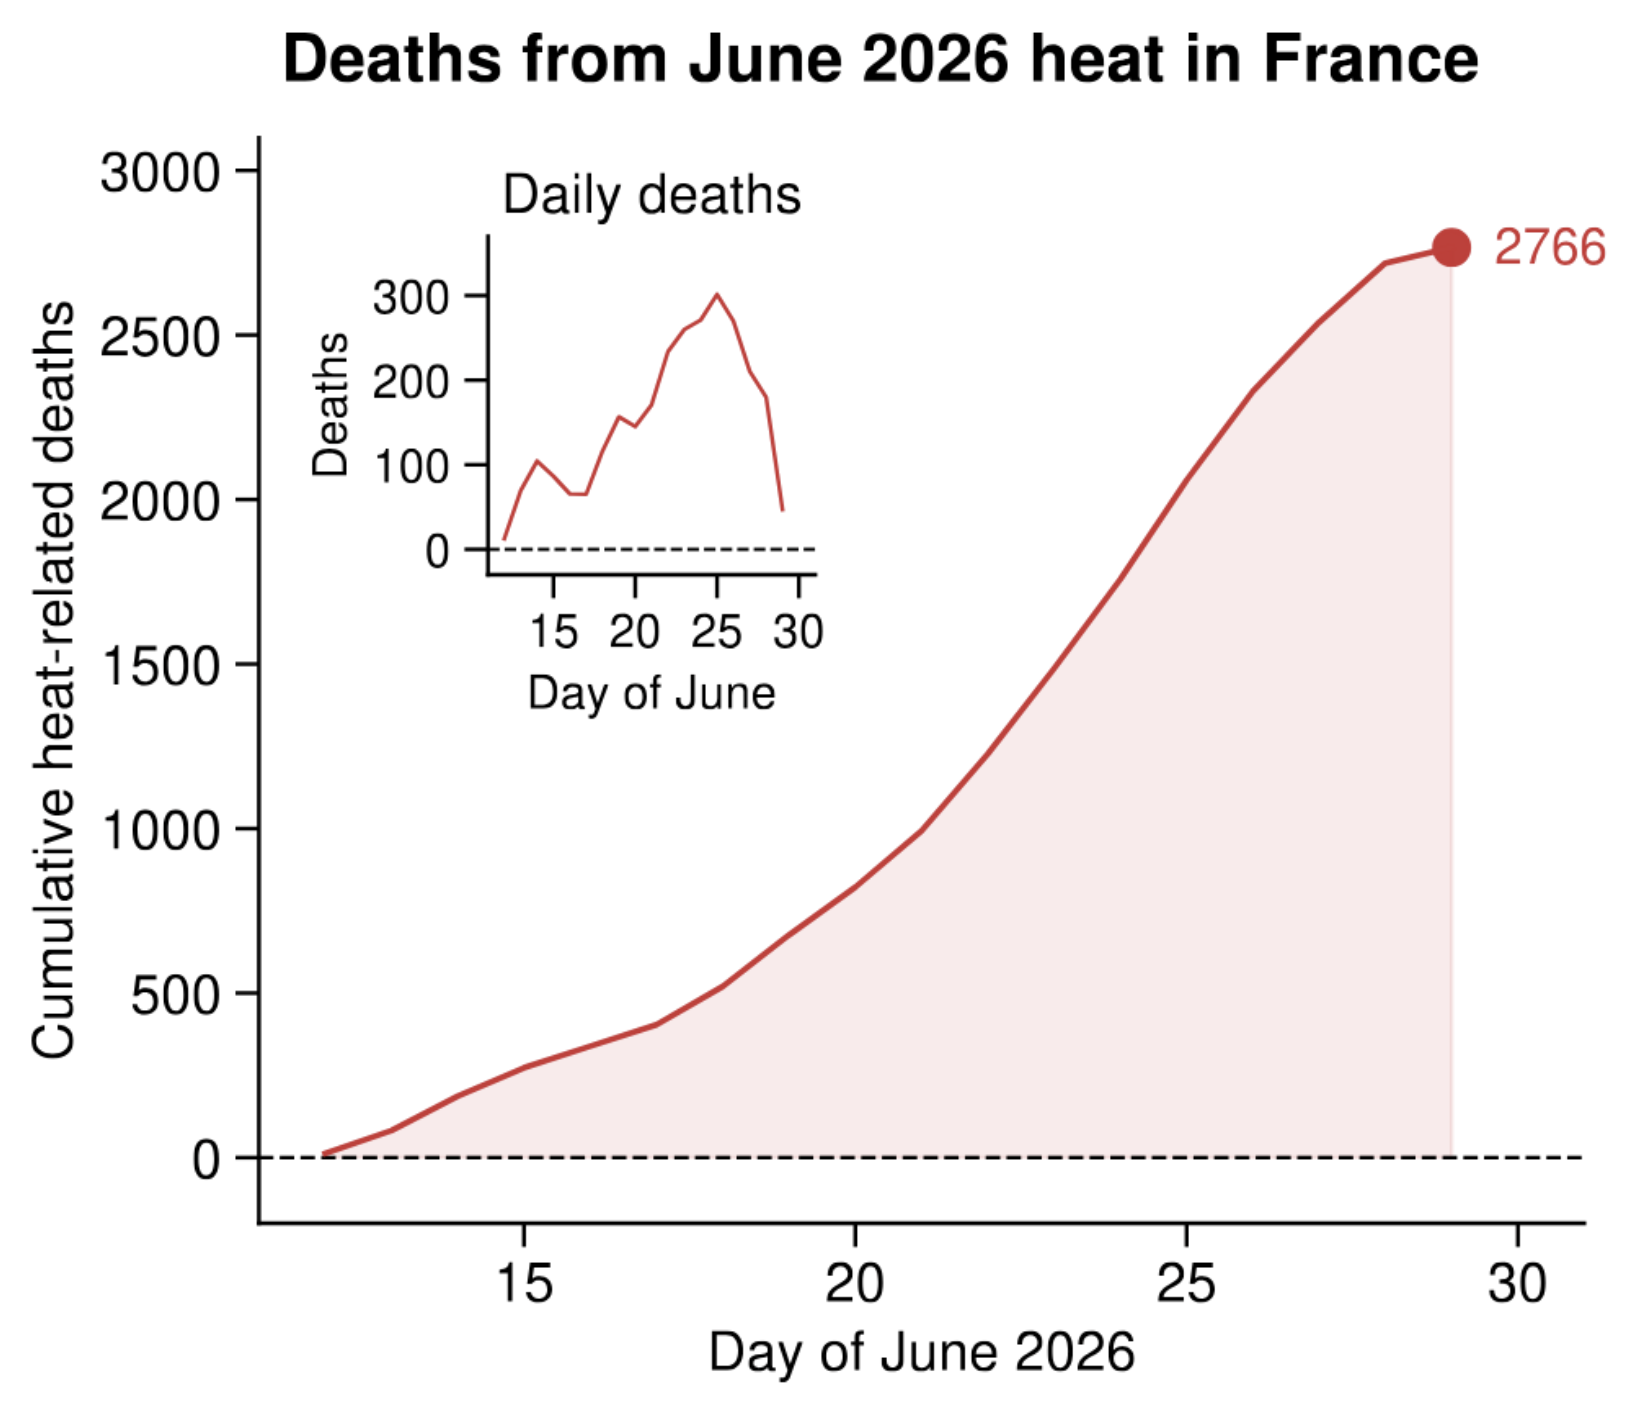
Over 12-29 June, we found that France has experienced around 2,700 heat-related deaths above the average baseline. Day-to-day heat-related mortality rates rose from less than 100 to almost 300 on the hottest days of 24 and 25 June.
This is shown in the graph below, which illustrates the cumulative total heat-related deaths seen in France over the two-and-a-half week period. The inset shows how heat-related deaths fluctuated on a day-to-day basis during this time.
Recent analysis by World Weather Attribution has already shown that human-caused climate change increased the frequency and intensity of the June heat wave across Europe.
Meanwhile, previous research has shown there is substantial evidence that heat-related mortality in Europe has already been elevated by greenhouse gas emissions.
As a result, we can be confident that at least some of the more than 2,700 deaths already seen in France are directly due to the burning of fossil fuels.
Calculating climate risk
In April, the UN-led body responsible for coordinating the work of climate modelling centres – the Coupled Modelling Intercomparison Project (CMIP) – unveiled a set of seven new emissions scenarios.
These are designed to replace the previous scenarios that have been used by scientists to understand how the climate might change in the future. They will feed into the upcoming seven assessment report (AR7) of the Intergovernmental Panel on Climate Change (IPCC).
The range of future emissions in the new CMIP scenarios is smaller, with scenarios of very high or very low emissions no longer on the table.
The retirement of the very-high emissions scenario – known as “RCP8.5” – led to certain commentators in the media and in politics, including US president Donald Trump, arguing that the risks of climate change had been “overstated”.
[For more on false and misleading claims around the new emissions scenarios, see Carbon Brief’s factcheck.]
Our analysis of June’s heat-related deaths in France suggests that, even if the most severe emissions pathways are no longer needed, climate impacts are taking a heavy toll on society.
Moreover, the temperatures seen in France show that climate models continue to underpredict the magnitude of heatwaves for a particular level of global warming.
This is because greenhouse gas emissions are only a first step in estimating the impacts of climate change.
The second step is converting emissions to changes in the climate at both the global and local levels – or hazards. This includes heatwaves, flash floods and droughts.
The third step is to determine how changes in the hazards will affect local populations. This can be determined by calculating people’s exposure and vulnerability to hazards.
Substantial uncertainty persists at every stage of this sequence.
For example, scientists do not know exactly how the global climate will react to ever-rising greenhouse gas emissions – nor the extent to which global temperature increases will drive local climate hazards. We also do not know how climate change at a local level impacts human health outcomes.
Managing the future of heat risk
Almost all heat-related deaths are preventable.
Adaptation options, such as air conditioning, heat action plans and social support for isolated people, will be crucial as the climate moves away from the typical conditions that people are used to.
Our previous research showed that France made a lot of progress reducing heat-related mortality after the deadly 2003 summer heatwave by taking many of these actions.
Adaptation can reduce deaths, but it cannot eliminate the risk created by continued warming.
Without a move away from fossil fuels, future heatwaves will keep testing the limits of public health systems and more people will die.


The post Guest post: France’s June heatwave caused more than 2,700 heat-related deaths appeared first on Carbon Brief.
Guest post: France’s June heatwave caused more than 2,700 heat-related deaths


-
Climate Change11 months ago
Guest post: Why China is still building new coal – and when it might stop
-
Greenhouse Gases11 months ago
Guest post: Why China is still building new coal – and when it might stop
-

 Greenhouse Gases2 years ago
嘉宾来稿:满足中国增长的用电需求 光伏加储能“比新建煤电更实惠”
-

 Climate Change2 years ago
嘉宾来稿:满足中国增长的用电需求 光伏加储能“比新建煤电更实惠”
-

 Renewable Energy9 months ago
Sending Progressive Philanthropist George Soros to Prison?
-
Climate Change2 years ago
Bill Discounting Climate Change in Florida’s Energy Policy Awaits DeSantis’ Approval
-

 Carbon Footprint2 years ago
US SEC’s Climate Disclosure Rules Spur Renewed Interest in Carbon Credits
-
Greenhouse Gases12 months ago
嘉宾来稿:探究火山喷发如何影响气候预测