
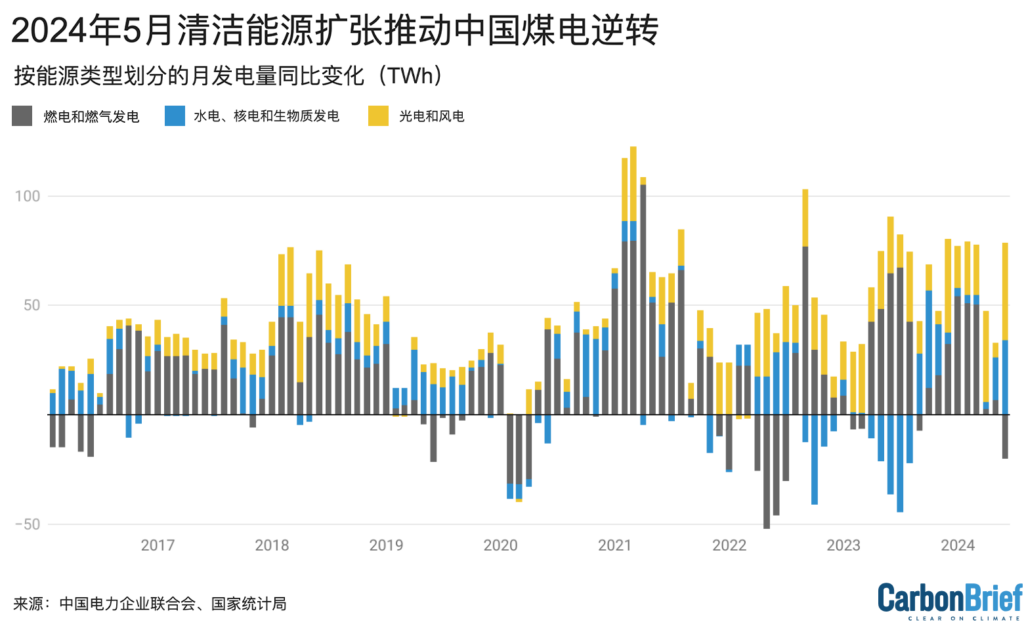
2024年5月,尽管用电需求持续增长,清洁能源发电量占到中国全国总发电量的44%,创下历史新高;燃煤发电量占比降至53%,达到历史低点。
基于官方数据和其他数据,Carbon Brief 的新分析揭示了煤炭在能源结构中占比下降的真实程度。
2023年5月,煤炭在中国发电量中所占比例为60%。一年后,这一数字下降了7个百分点。
该分析揭示的其他关键信息包括:
- 国家统计局按发电方式分列的月度发电量数据现在对风能和太阳能发电量计入非常有局限性。例如,它未纳入“分布式”屋顶光伏和较小的集中式太阳能发电站,因此只能捕捉到约一半的太阳能发电量。
- 国家统计局的月度总发电量为718太瓦时(TWh),而国家能源局报告提出月度电力需求为775太瓦时,两者的差距显著。实际上,由于发电厂和电网损耗,发电量肯定应高于需求量。
- 媒体报道曾猜测,创纪录的新增可再生能源装机容量会在5月份触及电网上限,但新数据显示情况并非如此。
- 2024年5月,中国电力需求同比增长49太瓦时(7.2%)。
- 与此同时,清洁能源发电量创纪录地增长了78太瓦时,其中太阳能发电量创纪录地增长了41太瓦时(78%),水力发电量从早些时候干旱造成的低点回升了34太瓦时(39%),风力发电量小幅增长了4太瓦时(5%)。
- 随着清洁能源的增长超过电力需求增长,化石燃料发电量被迫回落,出现了自2019年新冠大流行以来最大的月度降幅。天然气发电量下降了4太瓦时(16%),燃煤发电量下降了16太瓦时(4%)。
- 化石燃料发电量的下降意味着电力行业的CO2排放量下降了3.6%,而电力行业的CO2排放量约占中国温室气体排放总量的五分之二,是近年来排放增长的主要来源。

从2024年3月开始,中国化石燃料和水泥行业的CO2排放量由增变减。新的研究结果表明,这一趋势仍在继续。
如果目前风能和太阳能的快速部署得以继续,那么中国的CO2排放量很可能会继续下降,从而使2023年成为中国碳达峰的一年。
月度数据差异
国家统计局每月都会公布中国按发电方式分列的发电量数据。2024年5月的数据是在近一个月前的6月中旬公布,并被广泛报道。
然而,这些数据的局限性越来越大,因为其中不包括“分布式”光伏电站,如家庭和企业屋顶上安装的光伏系统。本文的分析表明,这使得大约一半的太阳能发电总量被遗漏。
如果仔细审视用电量,国家统计局发电量数据不完整这一事实显而易见:国家能源局报告的5月份用电量为775太瓦时,而国家统计局报告的发电量仅为718太瓦时。实际上,由于发电厂和输电过程中的损耗,发电量肯定远远大于用电量。
国家统计局报告的太阳能和风能发电量似乎很少,这引起了人们的困惑,并导致有报道声称中国的风能和太阳能发电表现不佳。
中电联收集的“利用率”数据可跟踪风能和太阳能发电的表现,显示相对于最大潜力的实际出力。这些数据通常包含在国家能源局发布的月度统计数据中。
国家能源局因在5月份发布的数据中略过了利用率,这导致彭博社和路透社猜测背后原因可能是风能和太阳能数据不佳。这一猜测在中电联直接提供其数据后基本被证明不成立,因为太阳能发电利用率大幅上升;风能利用率虽然下降,但在正常的年度变化范围内。
另一个数据集追踪了由于电网灵活性低而浪费的太阳能和风能发电量的比例,结果显示两者分别小幅增长了0.8和1.7个百分点。这对电厂运营者来说是个问题,但该升幅远未达到会显著影响利用率的程度——消纳率的年际变化幅度通常超过5%。
现在有足够的数据来破解国家统计局发电数据的局限性,并描绘出中国5月份发电结构的全貌。
首先值得一提的是,国家统计局的数据是以30天为一个月进行归一化处理的,这造成了部分数据不匹配。本文剩余部分使用归一化后的30天数据。
除了使用国家统计局数据,还可根据报告的装机容量和利用率来估算太阳能和风能发电量。通过将这些估计值与其他技术的报告发电量相结合,得出总发电量为783太瓦时,同比增长8%。
报告的750太瓦时用电量(按30天为一个月进行归一化)与估计的783太瓦时发电量相符,另有4.2%的差异是由于传输损耗造成的。
目前尚无输电损耗的月度数据,但2023年的平均值为4.5%,与报告的用电量和预估发电量之间的差距非常吻合。
创纪录的结果
综合各种数据可以看出,2024年5月太阳能发电量创纪录地增长了78%,远高于不完整的国家统计局数据中29%的同比增幅。
太阳能发电装机容量增加52%至691吉瓦(gigawatt),产能利用率从16%提高到19%,太阳能发电量从2023年5月的53太瓦时增至2024年5月的94太瓦时,增加了41太瓦时,创下中国各发电方式发电量中最大的增幅。
水电发电量的增幅位居第二,虽然发电量仅增长了1%,但利用率却从31%跃升至41%,因为该行业正从2022年至2023年创纪录的干旱中恢复过来。这使得水电发电量增加了39%(34太瓦时),达到115太瓦时。
风电装机大幅增长了21%,但其利用率却有所下降,这可能是由于风力条件逐月变化所致。因此,发电量的增幅相对较小,仅为5%(4太瓦时),达到83太瓦时。核电和生物质发电的发电量也有小幅增长,但核电站的利用率从87%下降到85%。
如下图所示,清洁能源发电量总计增长了78太瓦时。这足以超过49太瓦时的需求增长。
因此,尽管燃气发电装机增加了9%,但发电量却大幅下降16%,利用率急剧下降了24%。燃煤发电装机增加了3%,但发电量却下降了3.7%,平均利用率下降了7%。需求下降可能会抑制过去两年火热的对新建煤炭产能的投资。
燃煤和燃气发电量的变化,加之燃煤电厂热耗率的轻微下降,意味着电力行业的CO2排放量下降了3.6%。
在发电量发生上述变化后,中国的发电结构在2024年5月已大幅减少了对化石燃料的依赖。如下图所示,燃煤发电份额从去年同期的60%降至53%,是有记录以来的最低份额。
与此同时,太阳能发电占比从去年同期的7%上升到12%,创历史最高纪录。其余为风电(11%)、水电(15%)、核电(5%)、天然气发电(3%)和生物质发电(2%)。

非化石能源的总体份额达到创纪录的44%,间歇性可再生能源(太阳能和风能)的比例也创下新高,达到23%。
如上图所示,尽管需求不断增长,但太阳能和风能在中国电力结构中的份额正在迅速增加。2016年5月,它们仅占总量的7%。
与此同时,2024年5月,清洁能源发电装机继续强劲增长,新增太阳能发电装机19吉瓦 ,风电3吉瓦 ,核电1.2吉瓦。
在2024年的前五个月,中国新增了约79吉瓦的太阳能和20吉瓦的风能。如下图所示,这两个新增发电装机数字比去年分别增长了29%和21%,而去年的数字已经创下历史新高。
就太阳能发电具体而言,2024年5月的月新增装机高于4月,与2023年5月相比也有同比增长。

太阳能发电量的快速增长表明,太阳能产能的激增正在提供新的电力供应,其规模足以满足中国大部分的需求增长。
这进一步印证了中国的CO2排放量正处于结构性下降时期的观点。
如果清洁能源的新增装机保持在2023年和2024年初的水平,那么CO2排放量可能会持续下降,这将确定2023年是中国实现碳达峰的一年。
由于中国将在明年初宣布新的气候目标,政府对清洁能源增长的雄心水平仍有待观察。
关于数据
风能和太阳能发电量,以及按燃料划分的火电发电量系通过将每月末的发电装机乘月利用率计算得出,数据来自万得金融终端提供的中电联报告数据。
火电、水电和核电的总发电量来源于国家统计局的月度发布数据。由于无法获得生物质发电的月度利用率数据,因此采用2023年的年平均利用率52%。
发电产生的碳排放量估算基于中国最新的2018年国家温室气体排放清单中的排放因子,以及国家能源局公布的燃煤电厂月平均热耗率,并假设燃气电厂平均热耗率为50%。


The post 分析:中国清洁能源发展使五月燃煤发电份额降至53%的历史低点 appeared first on Carbon Brief.
This could be a big year for the circular economy.
In autumn, the European Commission is due to adopt the Circular Economy Act (CEA), aimed at supporting the EU in its stated aim to become a world leader in circularity by 2030.
There is a clear environmental imperative behind the legislation, but also a geopolitical one. Europe imports the vast majority of all its critical raw materials; for example, 100% of its heavy rare earth metals come from China and 71% of its platinum from South Africa.
The bloc is seeking to reduce its dependency on imports of key commodities, energy and materials, and as a result achieve greater self-sufficiency. Circular products are one route to achieving that.
Circular ambitions
Whether the EU’s aim is achievable, or not, brings into sharp relief the current state of the circular economy. According to the European Environment Agency, in 2024, secondary recovered materials made up 12% of total material use across Europe. This was only 1.5% higher than in 2010.
But, by some estimates, the global circular economy is already worth around $700 billion and could reach several trillion within the next decade. This rate of growth would take considerable support from national governments, starting with something akin to the CEA, which aims to double the EU’s circularity rate to 24% and create a single market for secondary raw materials. The hope is that this will stoke demand from businesses to adopt more circular practices.
Carsten Wachholz, business-policy engagement lead at the Ellen MacArthur Foundation, described the forthcoming act as “a critical opportunity to turn circular solutions from a niche proposition into a mainstream market choice,” adding that by harmonising rules across the single market the EU can allow the circular economy to “scale across borders”.
From there the argument runs that rules created in Europe will be copied in other markets, shaping global supply chains and standards elsewhere. “The EU can work towards shared international ambition, reducing protectionism risks, and unlocking large-scale investment globally,” he added.
Making two ends meet
Raising awareness of what is meant by circularity, and being able to identify and treat circular products correctly, is one of the challenges the sector faces.
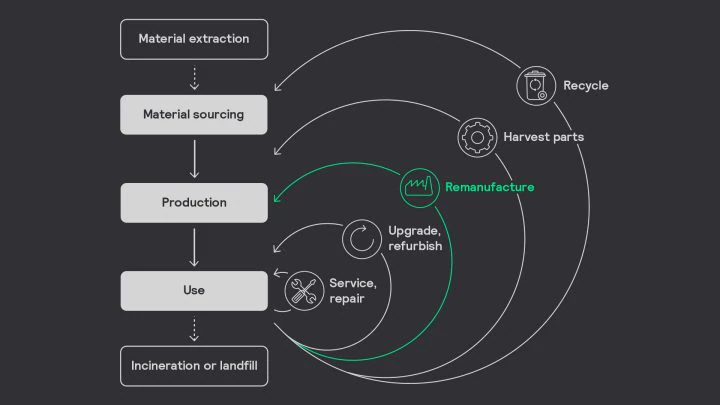
The global economy has been built on a simple linear structure where we source a material, create something out of it, sell it on and then throw it away. This process, sometimes called ‘take, make, use, dispose’ is the opposite of the principles of circularity.
The Ellen MacArthur Foundation defines the circular economy as a system where “materials never become waste”. In such a system, products and materials are “kept in circulation through processes like maintenance, reuse, refurbishment, remanufacture, recycling and composting”.
Circularity is about the whole life cycle of a product, seeing how it can be used for longer, upgrading when possible, and then potentially using that product to create something else afterwards. The intention with circularity is to increase the use of non-virgin materials, reducing the need to extract more from the ground.
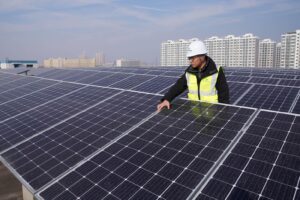
Signify: “We believe resilience is becoming more important to businesses right now”
Thomas Marinelli, head of sustainable innovation and design at Signify, a global lighting company, said: “I once explained it to a child with Lego. You put Lego blocks together and you can pull them apart again and make something new.”
Circular practices also lead to more products – phones, washing machines, lighting – being leased instead of created from scratch. These services cut the need for large upfront investments and reduce environmental impacts.
How business is responding
The next step is to convince businesses it is the right thing to do, from a financial, environmental and product perspective.
“Using products for longer and using less material and energy is a topic of interest in our markets,” added Marinelli, while at the same time acknowledging that part of the challenge is “awareness creation”.
“We need to prove that products made from non-virgin, or bio-circular materials are at least as good. And that a business’s environmental footprint is much lower when you use non-virgin materials,” he said.
Part of the awareness-raising piece is showing that older products can be repaired, refurbished and remanufactured, depending on their condition. Signify takes lighting systems that are up to 10 years old, and makes them new again, saving on material waste and cutting emissions, often at a lower cost than buying a new product.
A growing number of companies are already sold on the benefits of going circular. A recent survey from the World Economic Forum found that out of 491 manufacturing executives, 79% said circularity is crucial to their business, and 95% said it will be important within three years.
Carrefour, the French retail giant, has adopted circular practices in some of its stores as a way of driving down energy costs and cutting carbon emissions. In one of its Belgian stores, the company installed 3D-printed light fixtures made from recycled water bottles. Lighting systems were made from recycled materials that can be fully dismantled and used to make new ones after they reach the end of their natural life.
A separate example comes from Denmark where the area of Tuborg Havn in Copenhagen chose to upgrade its historic street lamps with efficient LEDs instead of replacing them. More than 80 light fixtures were cleaned, upgraded and reinstalled as part of the new initiative, and the new lights will be 3.5 times more efficient than the old ones. The initiative has allowed the harbour to retain its historic character while reducing energy consumption and modernising the area.
Overcoming barriers
The Ellen MacArthur Foundation recently coordinated an open letter to the European Commission – signed by 12 global brands including The LEGO Group, H&M and Philips – calling for lawmakers to support new reforms that address common barriers facing circular products.
These include simplifying EU-wide rules, creating tax incentives and stronger financial support for the burgeoning sector. Current VAT rules, for example, can mean secondhand goods are repeatedly taxed across their lifetime, something the charity is seeking to change.
“Capital is not lacking,” said Wachholz, “but the risk profile of circular economy projects keeps too many ventures stuck at pilot scale rather than reaching industrial deployment.”
The letter calls for the creation of a secondary materials platform to improve price transparency, digital product passports to track material flows, and the creation of new industrial hubs to provide the infrastructure and technology the sector needs in order to scale up.
Those measures, coupled with fossil energy price spikes, will help circular products compete on cost with the extractive economy, experts say. “Using recycled materials or non-virgin alternatives can become competitive in the long run,” said Marinelli, pointing to the volatility in the price of raw materials. “If you look at plastics, when oil is a problem, the price of plastics goes up. But recycled plastic stays at the same level.”
“And it’s not only about materials but production as well. When volumes of recycled materials go up, then the price remains stable or goes down,” he added.
Opportune moment
The current geopolitical environment could serve to support growth in the circular economy. Supply chain constraints caused by the war in Iran have caused commodity prices to skyrocket. This has led many companies – and countries – to seek ways to protect themselves against future shocks.
In that context, new circular policies and products could receive a favourable hearing from businesses looking to build resilience, cut costs and protect nature. A future where circularity is fully embedded across society will need time and support to grow, but may well be on its way.
Adam Wentworth is a freelance journalist based in Brighton, UK
The post Can the circular economy win over big business? appeared first on Climate Home News.
A new report from Greenpeace Australia Pacific advocates for a Pasifika-led transition toward a future free from coal, oil, and gas. It emphasises that while Pacific island nations contribute minimally to global emissions, they face existential threats from rising sea levels and coral reef destruction.


Leadership from the frontlines
Three decades ago, the world united to confront the greatest challenge of our age: climate change and transitioning away from fossil fuels.
The Pacific has been there at every step, playing a central role in shaping the global climate regime. We have defended science, been a voice for ambition and justice, and delivered successive breakthroughs — from securing the 1.5°C goal in the Paris Agreement to taking the world’s biggest problem to the world’s highest court. Today, we are spearheading efforts — both inside and outside the formal process of UN climate negotiations — towards a just and equitable transition away from fossil fuels.

Timeline
| 1980s | Pacific island countries first warn of the threats to physical and cultural survival from climate change. |
| 1990 | Together with island nations of the Caribbean and the Indian Ocean, the Pacific forms the Alliance of Small Island States (AOSIS). |
| 1991 | Vanuatu makes the first proposal for what we now call loss and damage finance. |
| 1994 | Nauru puts forward the first draft of what became the Kyoto Protocol. |
| 2009 | Pacific island countries press for a binding agreement that would limit warming to 1.5°C, with Tuvalu and AOSIS offering text for a new legal protocol. |
| 2015 | The Pacific plays a pivotal role in securing the Paris Agreement — including the all-important goal of limiting warming to 1.5°C, and a stand-alone article on addressing loss and damage from climate change. |
| 2022 | Vanuatu is the first country in the world to support a Fossil Fuel Treaty, followed shortly by Tuvalu. |
| 2023 | Pacific island countries help secure the first ever reference to fossil fuels in a UN climate decision, with COP28 calling on countries to “transition away from fossil fuels”. The Fund for Responding to Loss and Damage becomes operational. |
| 2024 | Following a request by Pacific and Caribbean island countries, the International Tribunal for the Law of the Sea clarified states’ obligations to protect the world’s oceans from the impacts of climate change. |
| 2025 | Following a campaign led by Pacific island students, a historic ruling from the International Court of Justice affirms that countries are legally obliged to limit warming to 1.5°C, and that continuing down the path of fossil fuels may be an internationally wrongful act. |
| 2026 | Pacific Ministers and civil society gather in Vanuatu to set the ongoing course of Pacific leadership towards a fossil fuel free future. The Tassiriki Call reaffirms the vision of a Fossil Fuel Free Pacific and agrees to establish an Inter-Governmental Taskforce. |

1.5°C and the transition away from fossil fuels
By the 2000s, it was clear that warming beyond 1.5°C posed a profound threat to communities in the Pacific and worldwide.
Rising seas, destructive storms, extreme heat, shifting rainfall patterns, ocean acidification… no level of warming is ‘safe’. Every fraction of a degree increases the risks to our food and water supply, our physical and mental wellbeing, our cultures, and our sovereignty.

Only when you have seen sacred land swallowed by the rising ocean and the graves of your ancestors washed out to sea, cared for elders suffering through extreme heat, watched the familiar rhythm of the seasons change before your eyes, or lied awake at night worried whether your children will still have a nation to call home, do you truly understand what is at stake. For some people and communities, 1.5°C is a point of no return.
In Paris, we held the line, and refused to negotiate away our futures. The result — a universal agreement to strive to limit warming to 1.5°C — became a lifeline for Pacific communities, and a gift to the entire world.

In the decade since Paris, the case for limiting warming to 1.5°C has only grown stronger. Beyond 1.5°C, the risks grow from highly destructive to truly existential. How? The impacts of climate change do not merely increase in a linear fashion as the global temperature climbs. At a certain point we start to trigger far more severe and abrupt changes — such as the destabilisation of polar ice sheets, committing the world to much faster sea level rise, or the mass death of critical ecosystems we depend on for our sustenance.
Cross these ‘tipping points’ and we will set in motion changes at a pace to which it may be impossible to adapt, and which will continue to play out for millenia. We will have left behind the relatively stable climate of the last 11,000 years, in which today’s modern civilisations evolved, and which is the only Earth they have known. We will have tipped our Earth into a far more chaotic state, and our survival as a species will be by no means assured.
“The salt spray of the Pacific Ocean is in my blood; I grew up watching the tides shape the shores of the islands of Tuvalu. But now, those tides are rising relentlessly, eroding lands, swallowing homes, decimating livelihoods and washing away the futures of communities.
— Dr Maina Talia, Minister for Home Affairs, Climate Change and Environment, Tuvalu
We now know that even at today’s level of global warming, of just below 1.5°C, we may have crossed tipping points for the tropical coral reefs upon which millions of people in the Pacific and worldwide depend for their food and livelihoods, and for some of the world’s major ice sheets. At warming of beyond 1.5°C, crossing these and many other tipping points becomes not merely possible but a greater and greater certainty.
Let us make this urgent reality even clearer by speaking more about the ocean — the big blue beating heart of our planet. Like the blood in our veins, ocean currents distribute nutrients, oxygen and heat around the planet. Without this planetary pulse, life simply would not exist. As the world warms, these ocean currents are slowing. The planet’s pulse is becoming fainter. Ignore these planetary health warnings, and push our ocean currents beyond a tipping point, and that pulse may stop — unable to be resuscitated — with consequences for all life connected to the ocean, including our own. The ocean that raised us is now carrying a stark warning.
We are already deep in the danger zone, and it is going to take all of us pulling in the same canoe to get back to safer shores.
Course correction
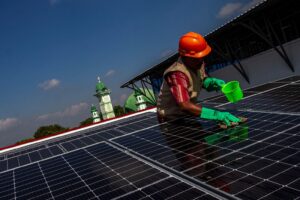
Our world is changing rapidly. Around the globe, solar panels now adorn millions of roofs and windfarms dot the landscape. Growth in renewable energy has outstripped all projections.
But here’s the rub: despite remarkable progress with renewable energy, we have seen no slowdown in the burning of coal, oil and gas. Globally, our hunger for energy has been growing fast, and with it our consumption of fossil fuels, even as renewable energy has grown alongside. We are on track to be producing double the amount of fossil fuels in 2030 than would be consistent with limiting warming to 1.5°C.
The lesson? We need, as a global community, to be far more proactive about transitioning away from fossil fuels. Merely betting on growing renewable energy is not going to save us. It is like trying to mop up a flooded floor while leaving the tap running — unless we turn down fossil fuel production, the flood only rises. In the decade since Paris, and in the three years since the world agreed explicitly to transition away from fossil fuels, consumption has reached dangerous new highs, bringing us to the brink of all-out climate catastrophe.
We need roadmaps that help us remove the barriers to action, overcome technical obstacles, and help us finally break away from fossil fuels.
But we must also ask ourselves what we truly value. Today, so much growth in energy demand is coming not from meeting our basic needs, but from material excesses and overconsumption of energy among wealthy nations and corporations, or powering artificial intelligence and technologies that only separate us further from each other and the land and oceans that sustain us. Is this really the world we want?
The Pacific has much to remind the world about what truly matters — family, connection, reciprocity, and living in harmony with our shared home.

The course ahead
The Paris Agreement, its underlying Convention, and the ongoing process of negotiations on its implementation, provide legitimacy, universality and accountability. They offer the only forums where every country has a seat at the table. They provide the legally binding framework for our common but differentiated responsibilities, and the obligation of advanced economies, whose wealth was built off the back of fossil fuels, to support the majority world in transitioning to renewable energy, adapting to the impacts of climate change, and addressing loss and damage from climate change.
But we now know that this is not enough. The greatest strength of this all-in process is also its weakness. The process of consensus decision-making provides legitimacy and durability, but also puts a brake on ambition. At best, it offers the lowest common denominator. At worst, it allows the process to be held hostage by one or more regressive forces.

Alongside the formal process of UN climate negotiations, we must continue to grow and strengthen the coalition of committed nations already getting on with the work of building a vibrant future beyond fossil fuels. We must carry forward the momentum generated by the landmark conference on transitioning away from fossil fuels in Santa Marta, as we voyage towards the second conference in Tuvalu next year. We will build a fossil fuel free Pacific, shaped by Pacific values. We will continue to be a voice of science, ambition and conscience, and we will seek justice and accountability through the full implementation of the historic ruling from the International Court of Justice.
Recommendations
1.5°C as our guiding star
The transition away from fossil fuels must be anchored to the fundamental scientific, moral and legal imperative of limiting warming to 1.5°C. This means timelines, targets and trajectories that minimise the duration and extent of any overshoot, and return the long-term average temperature rise to 1.5°C as soon as possible.
Strengthening global cooperation
The COP31 Presidency of Negotiations, to be held by Australia, must be a meaningful partnership with the Pacific. This means elevating the voices of our leaders, backing Pacific-led solutions, and maximising the opportunity of the Pacific pre-COP to ensure the 1.5°C imperative and the transition away from fossil fuels are central to the agenda at COP31 in Antalya.
COP31 must operationalise and accelerate the commitment to transition away from fossil fuels, building on the momentum from COP30 and the Santa Marta conference.
Alongside and complementary to the UN climate negotiations, willing countries should work to accelerate implementation through parallel initiatives such as the Brazilian COP30 Presidency-led roadmap, the follow-up to the Santa Marta conference, bilateral and regional collaborations, and implementation of the advisory opinion from the International Court of Justice.
National roadmaps that promote justice
All governments should develop national roadmaps for a just transition away from fossil fuels, aligned with their fair share of the global action needed to limit warming to 1.5°C, and identify needs for international support.
National roadmaps should include an immediate commitment to no new fossil fuel expansion, rule out false solutions, set timelines to phase out production and consumption — with developed countries moving fastest — and maximising the opportunities for increasing energy sovereignty, access and security.
From extraction to regeneration
The transition away from fossil fuels must also aim to reduce future energy use and demand for transition minerals. This means focussing on energy efficiency, a return to regenerative approaches, and reorienting our energy, transport, food systems and built environments away from material excesses and over-consumption, aligning instead with the values, wellbeing and long-term interests of our communities.
The transition must not lead to new industries that harm our environment and communities, and that repeat and compound the injustices of past extractive models. In particular, governments should put a permanent ban on deep sea mining.
Funding
Developed countries must provide adequate and accessible finance for transitioning away from fossil fuels, adapting to the impacts of climate change, and addressing loss and damage. This should include an increase in grants and direct budget support, be accompanied by debt relief, and be enabled through taxing polluters and ending fossil fuel subsidies.
Authored by the Pacific team at Greenpeace Australia Pacific. Words by Simon Bradshaw, Shiva Gounden, Moemoana Schwenke. Edited by Kate O’Callaghan.
Photos curated by Olivia Louella.
REPORT: Where the Ocean leads us, A Pacific way to a fossil fuel free future
Climate Change
Guest post: How US renewable-energy growth persists despite federal policy uncertainty
Despite recent shifts in federal energy policies, our analysis shows that the US transition to renewable energy is continuing.
The current administration has enacted a range of changes to prioritise fossil-fuel energy and environmental deregulation in the US, while withdrawing support for renewables.
Yet solar, wind and battery storage accounted for over 90% of new energy capacity in 2025.
This is thanks to the falling cost of renewable energy technologies, investments spurred by the Inflation Reduction Act and Bipartisan Infrastructure Law and local and state policies, according to our research at the Center for Global Sustainability, University of Maryland.
Our analysis examines recent trends in the US energy landscape, focusing on rising electricity demand, new electricity capacity additions and generation, as well as fossil-fuel production and state-level case studies.
Rising electricity demand in the US
A key shift in the calculus is the fact that US electricity demand is now projected to increase rapidly, after a period of relative stagnation.
Between 2005 and 2020, electricity demand was relatively flat, after surging in the 1990s due to growth in the economy and population, as well as rising electrification.
However, as the chart below shows, demand has grown by 7% since 2020 – and this is set to accelerate.
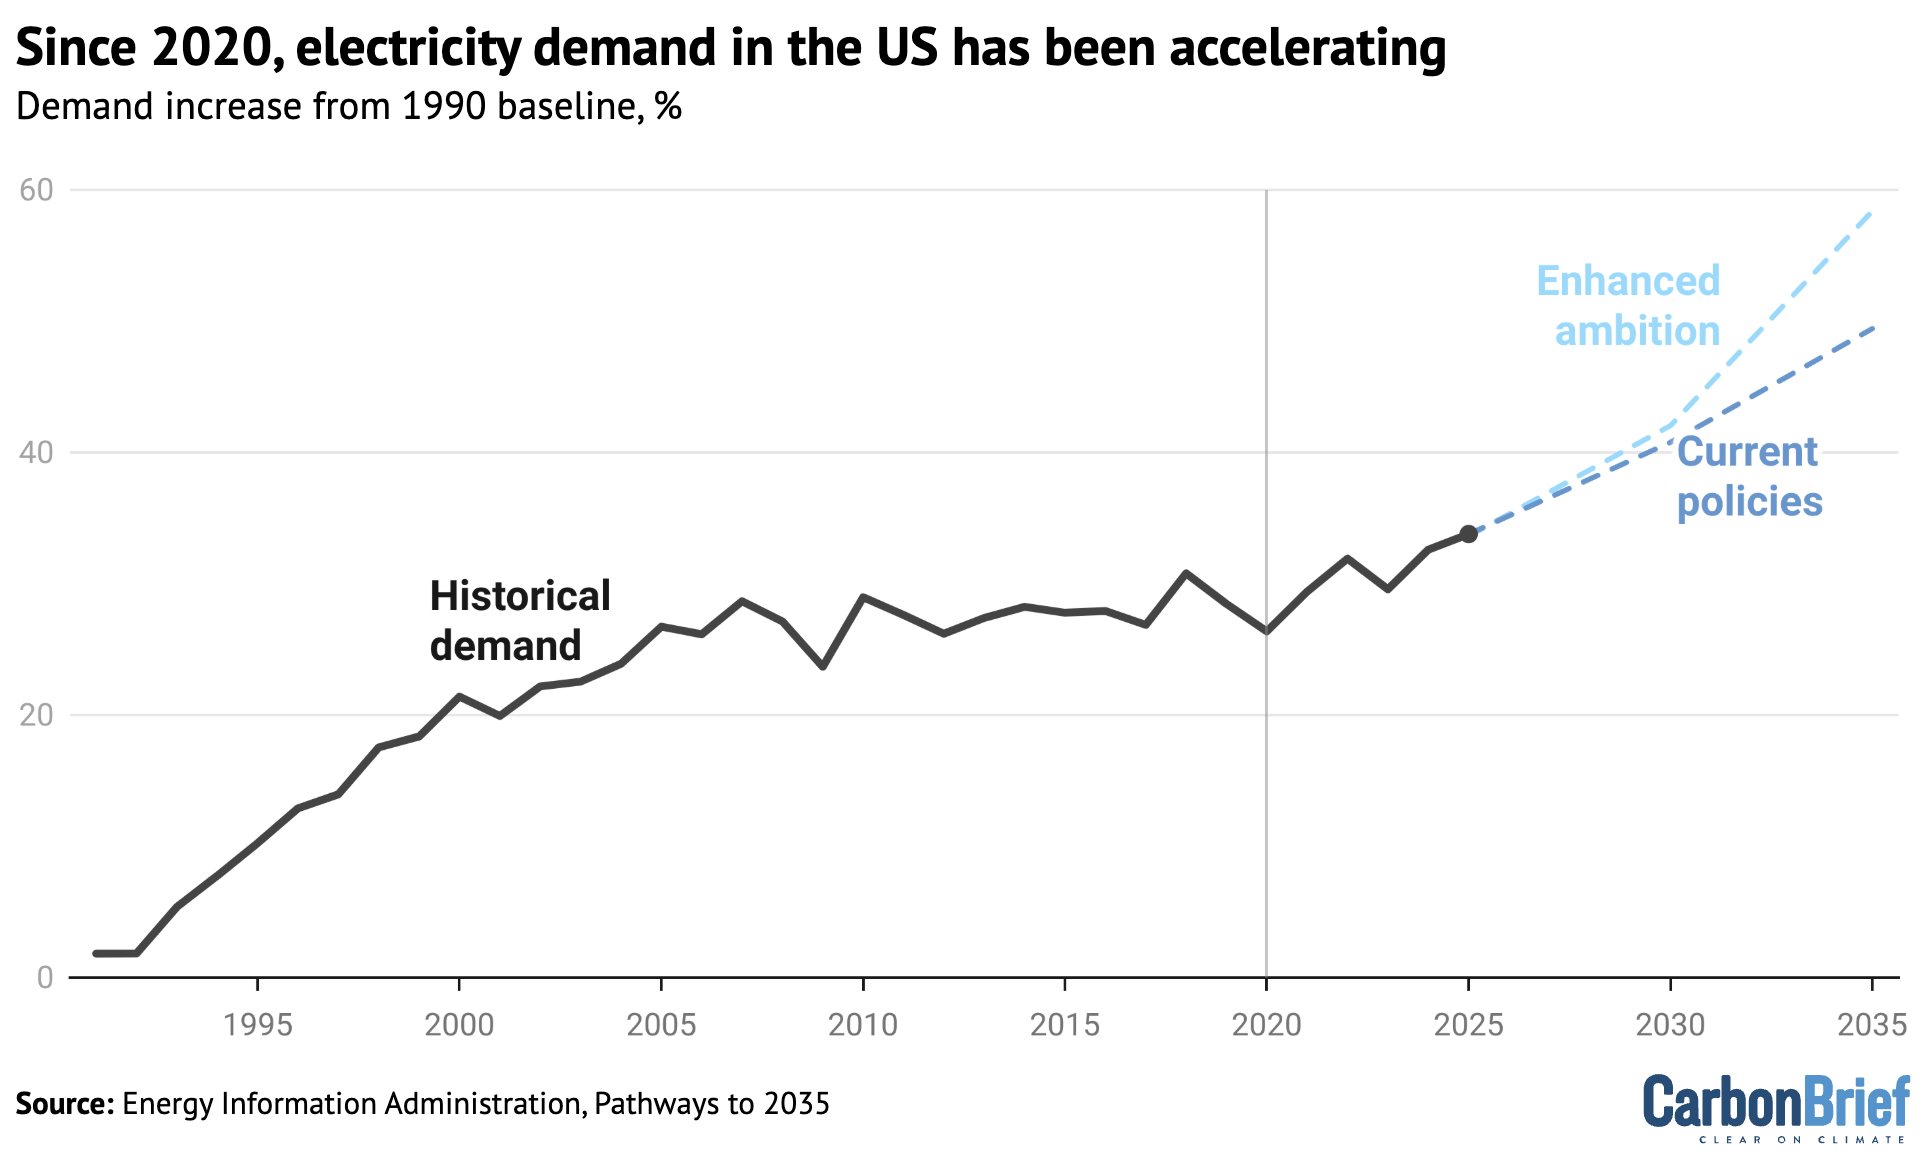
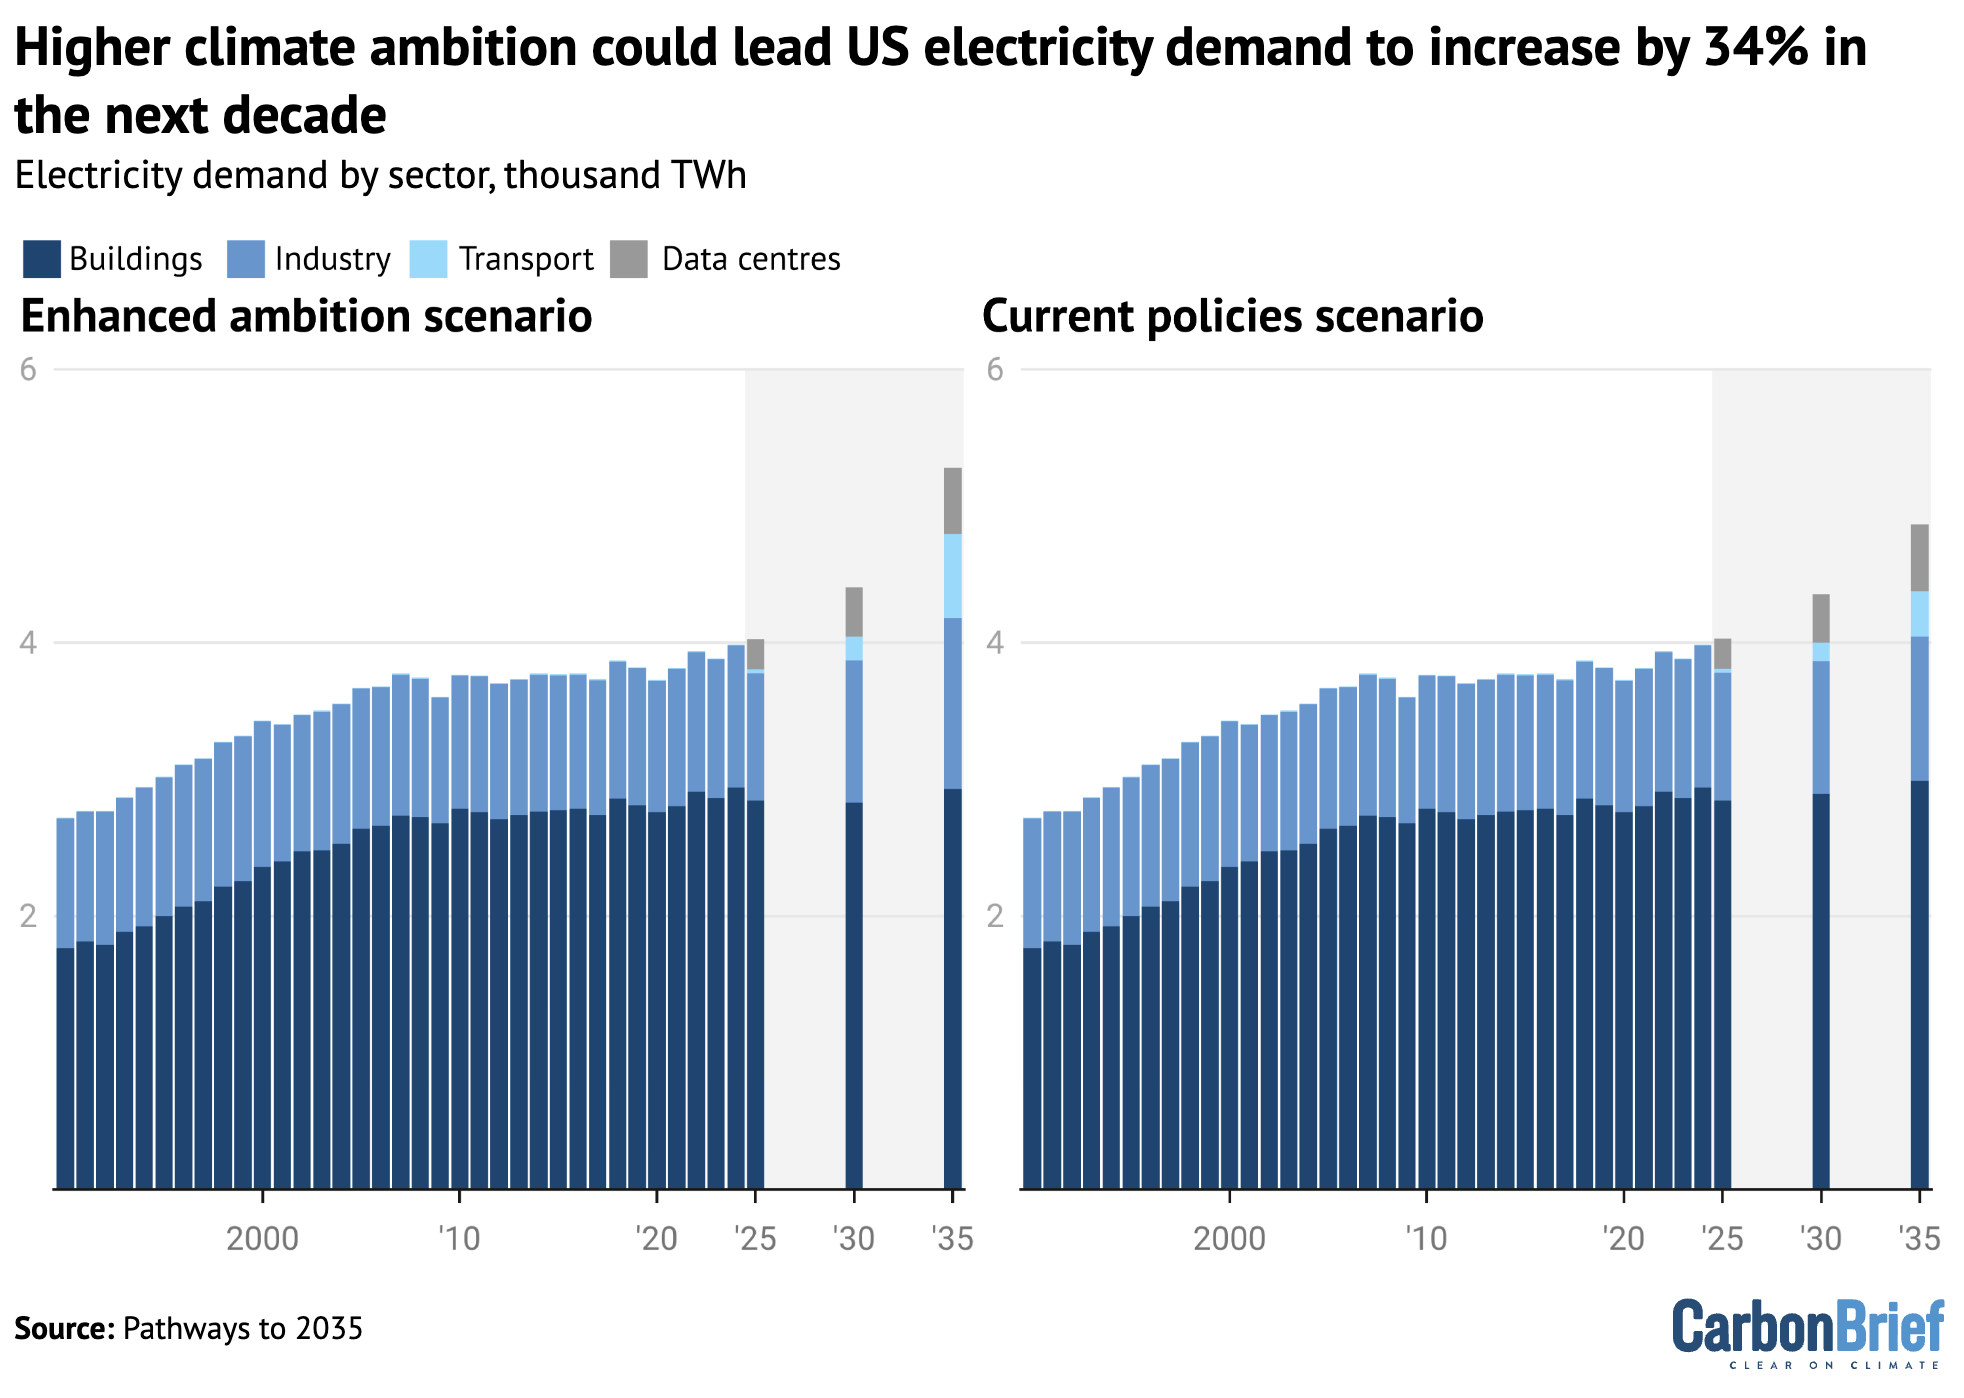
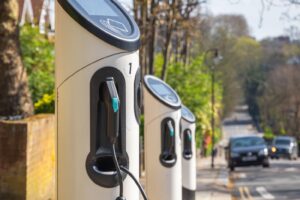
Rising transport electrification, along with new demand from data centres, buildings and industry are expected to drive additional electricity growth in the near term.
Our recent report finds that US electricity demand could increase by 24-34% in the next decade, relative to 2021 levels, as shown in the figure below. It shows that electricity demand would be higher if there is enhanced climate ambition, due to higher shares of electrified transport, industry and buildings.
While demand has been relatively flat over the past decade or two, there have been major shifts in the source of electricity supply over this period.
(Note that changes in generating capacity do not correspond directly to patterns in electricity demand shown earlier.)
Whereas huge numbers of gas-fired power plants were built in the 2000s, renewable energy has been the primary source of new capacity for the past decade. With demand largely flat, much of this new capacity helped offset the loss from significant coal retirements during this period.
Indeed, capacity additions from renewable energy have outpaced that of every other technology since 2011, according to our research.
Accelerating renewable-energy buildout is increasingly viewed as an immediate, low-cost and practical solution to meet demand growth.
As shown in the figure below, additions of solar, wind and battery storage capacity reached more than 90% of total additions in 2024 and 2025 at 47 gigawatts (GW) and 48GW a year, respectively.
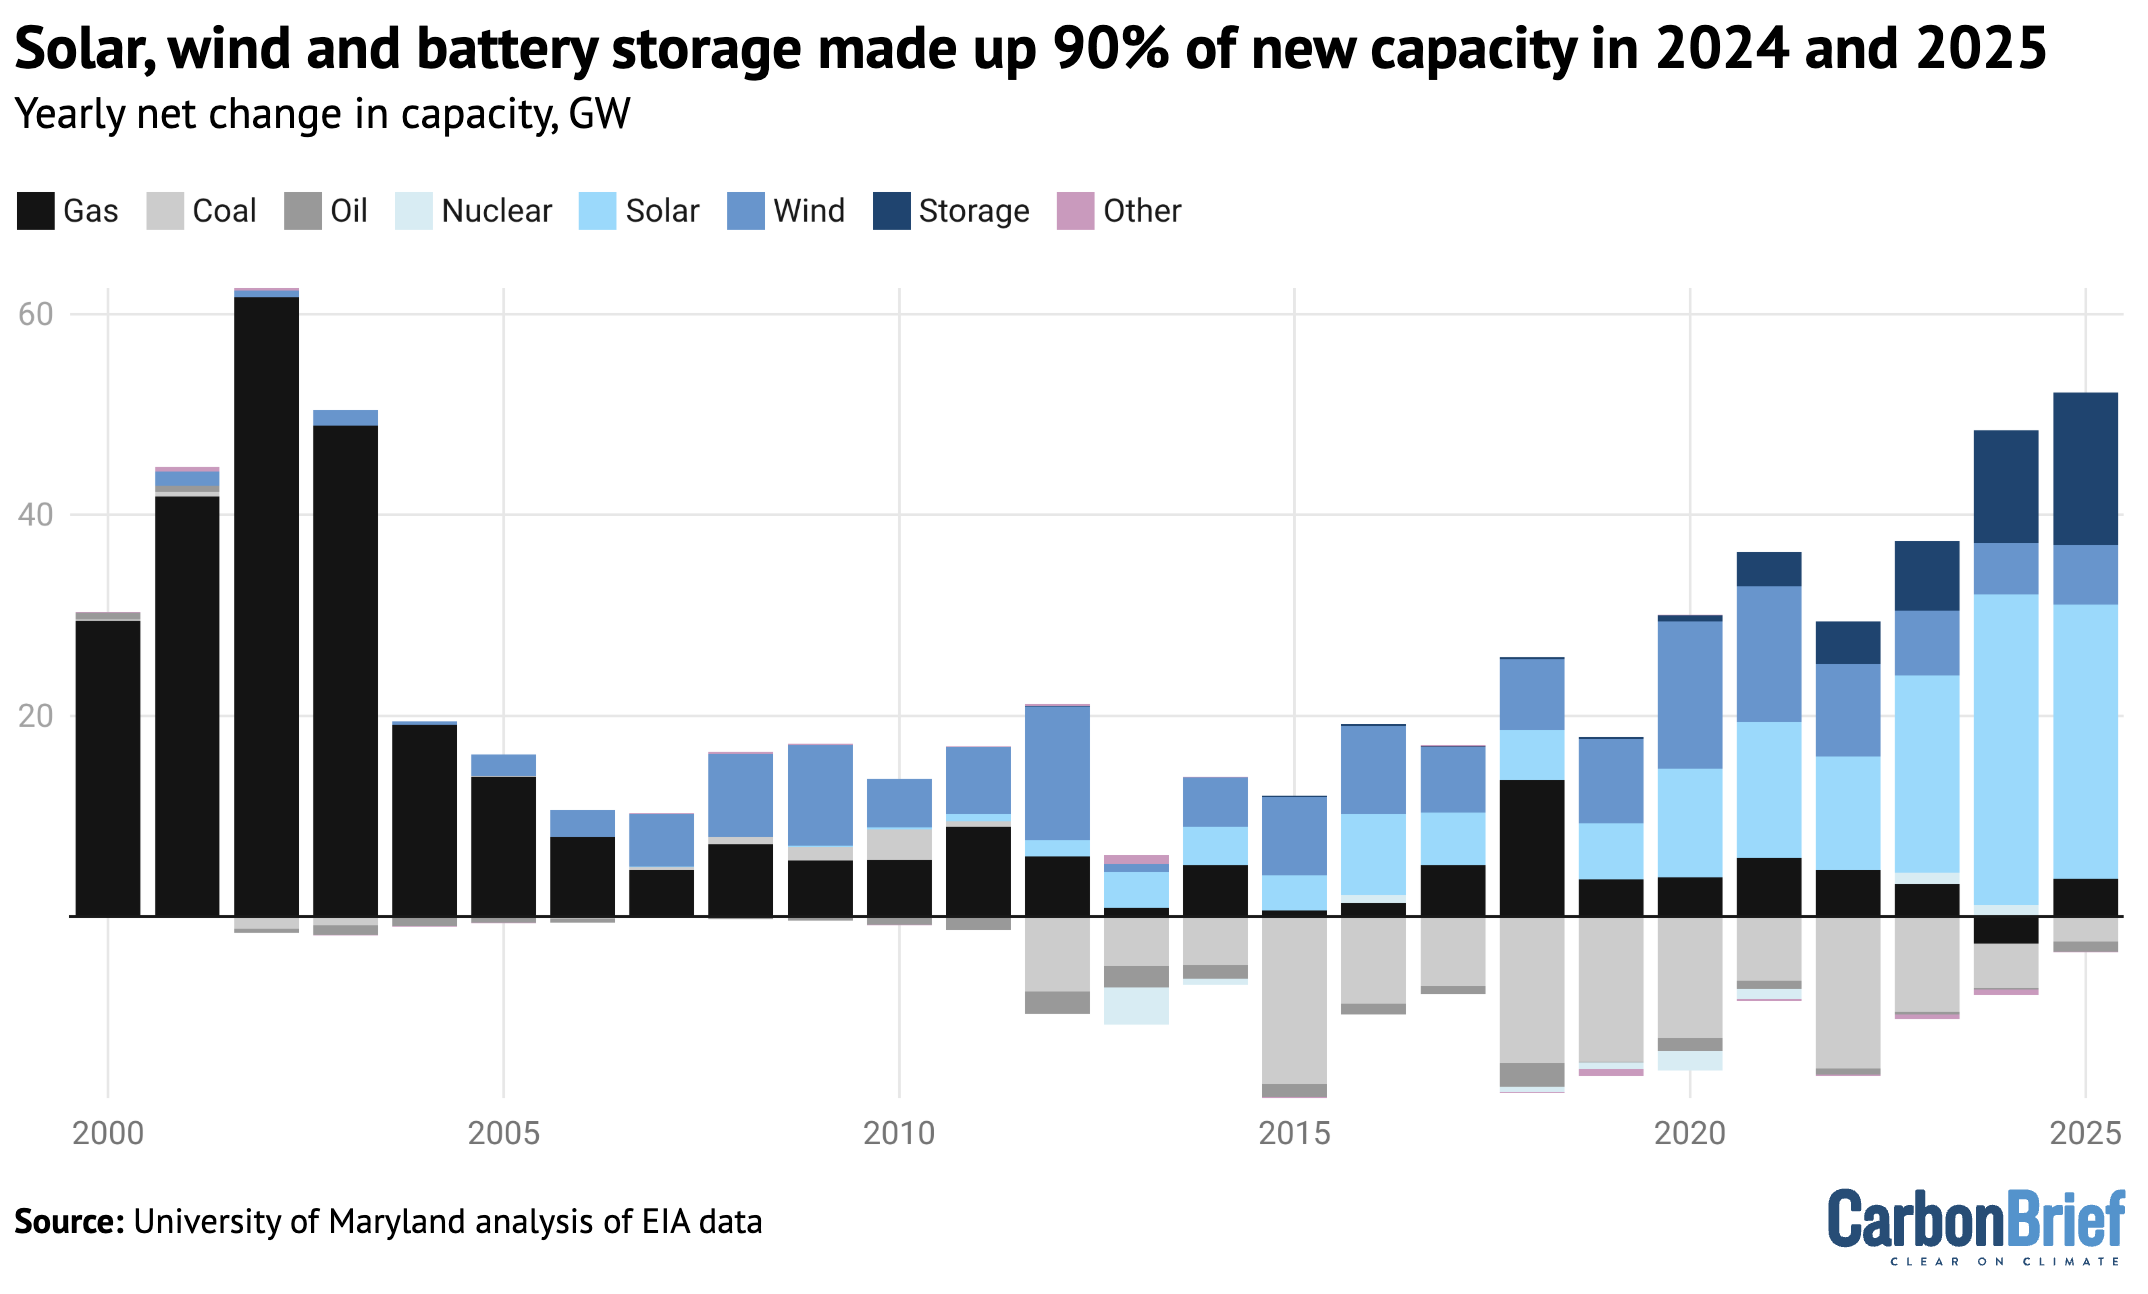
This pace of renewable deployment is attributable to quickly declining costs, driven by improvements in manufacturing technology, maturing supply chains and better economies of scale.
Meanwhile, 112GW of coal capacity was retired over the last decade due to market forces, health concerns and clean-energy policies.
Gas-power additions have remained at a low but steady level, our research shows.
Renewables surpass coal
As a result of the shifts in generating capacity, solar generation has increased nearly tenfold over the last decade, while wind generation has doubled.
As such, solar and wind reached 9% and 10% of the generation mix last year, respectively, as shown in the chart below.
Coal generation has fallen by more than 50% over the same period, replaced by a combination of renewables and gas, which has risen steadily.
(Note that coal-power output increased in 2025, primarily due to higher gas prices, while federal policy changes forced some old plants to stay open.)
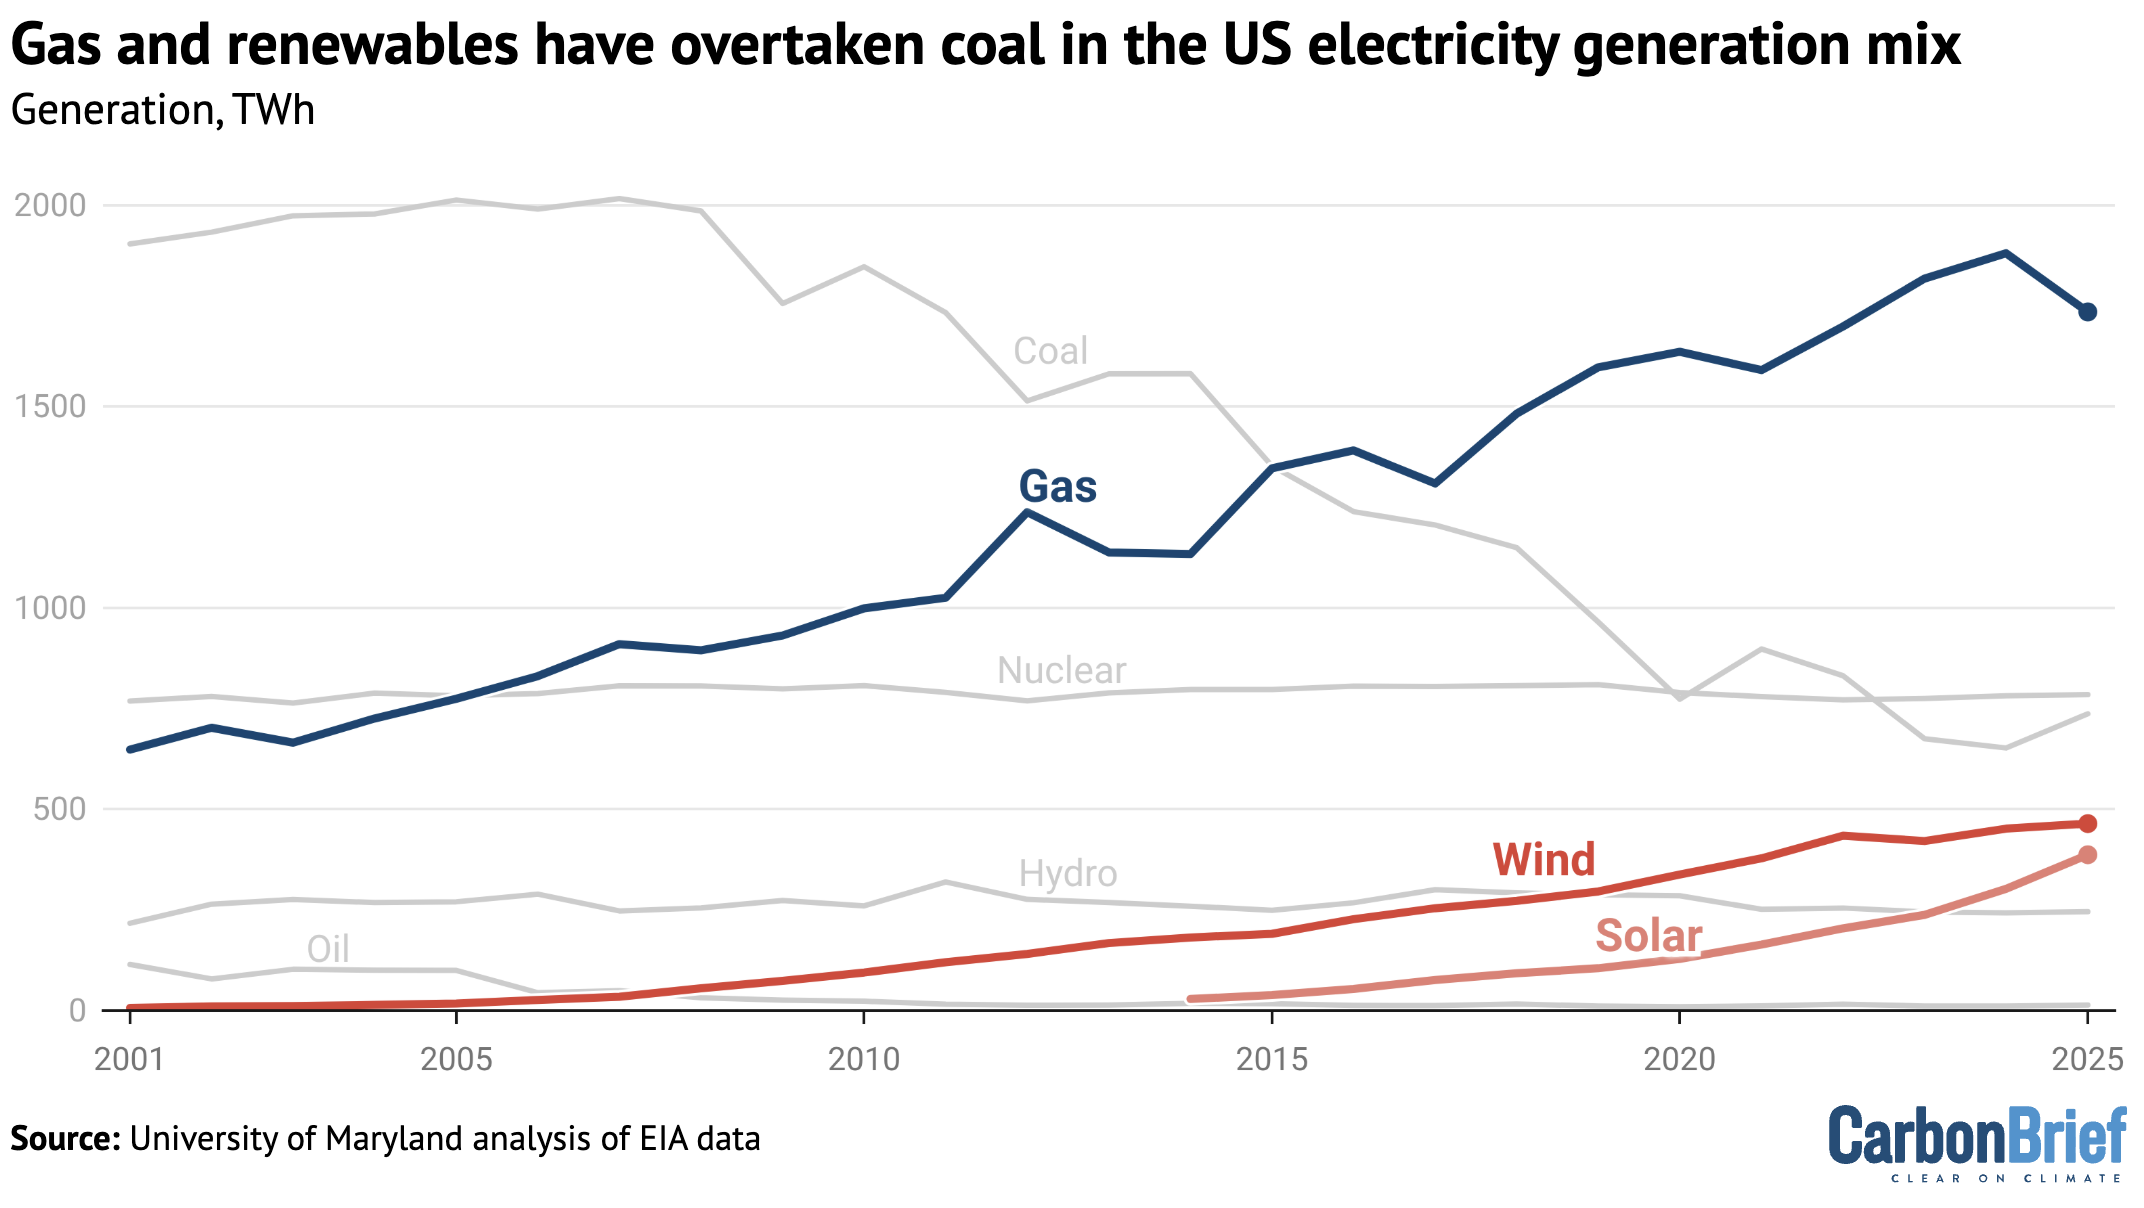
Gas generation has steadily increased in the US, reaching a 39% share of the generation mix last year. Roughly speaking, the growth in wind and solar – around 600 terawatt hours (TWh) – in the past decade was sufficient to match the decline in coal generation, while growing gas generation covered the roughly 300TWh increase in demand through 2025.
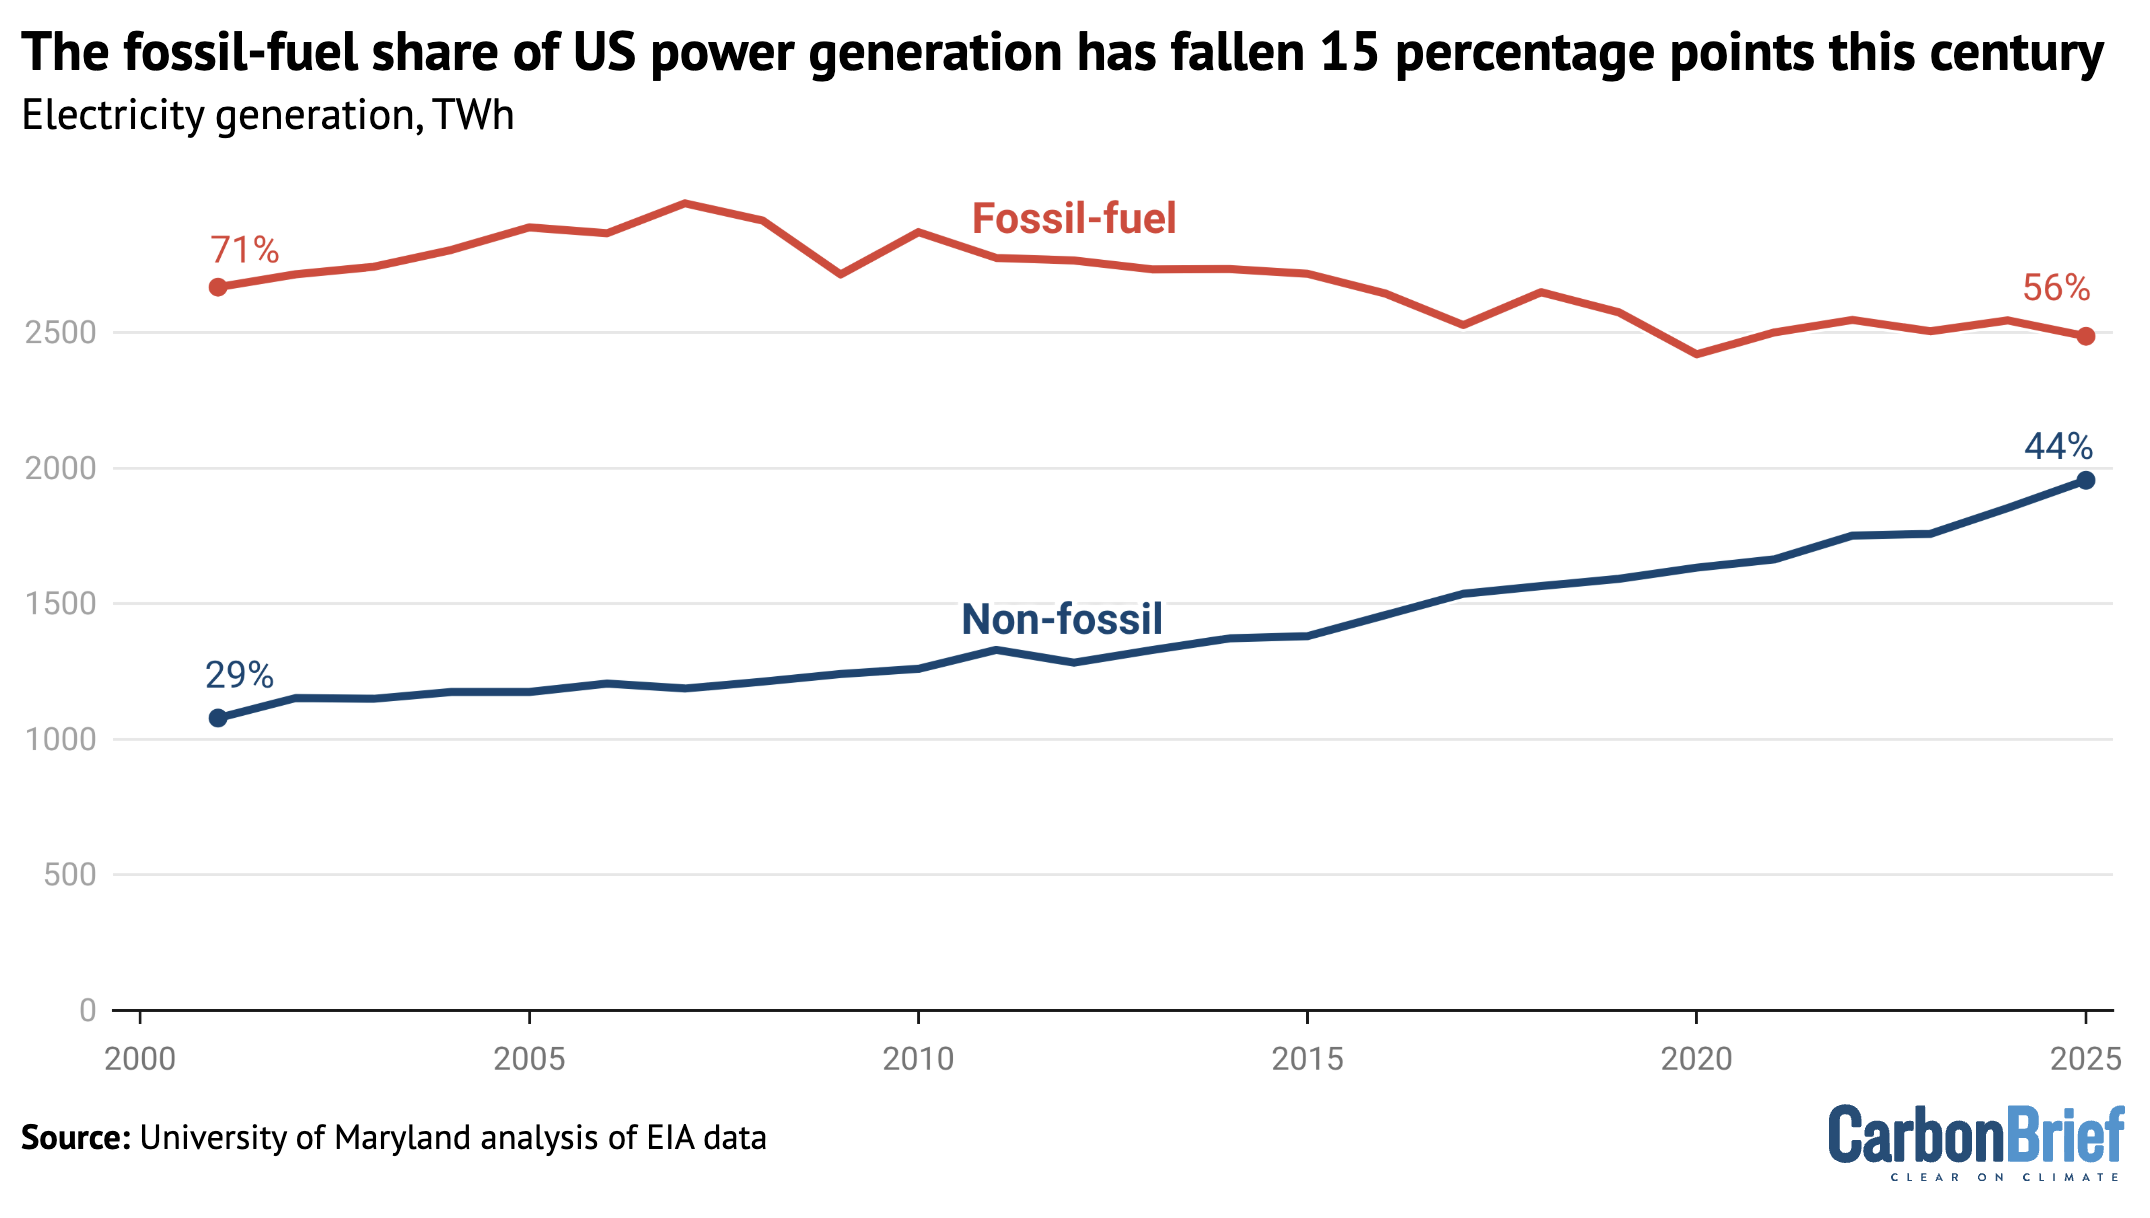
As a result, as shown in the figure below, fossil-fired electricity as a whole has fallen to 56% of the mix.
Our research shows that a rapid renewable energy buildout is occurring across states regardless of political allegiance, driven by strong economic advantages, policies such as state “renewable portfolio standards” and other environmental and health benefits.
Over the last decade, land- and wind-rich states such as Texas, Oklahoma and Iowa, have accounted for 62% of new wind capacity. Meanwhile, “sun-belt” states such as Texas, California and Florida have built 52% of new solar capacity.
Clean-energy policies have further driven renewable deployment. For example, California has a binding law requiring 100% of electricity to come from renewable and zero-carbon energy sources by 2045, with an interim target of 60% by 2030.
This has contributed to a 44% renewable generation share in the state in 2025, up from 16% only a decade ago.
Similarly, New Mexico has a legislated goal to reach 80% renewable electricity by 2040 and 100% zero-carbon electricity by 2045.
More than half of New Mexico’s electricity is now generated by renewables, up from only 9% in 2015. The state’s 3.5GW SunZia wind and transmission project is set to be the largest renewable energy project in the western hemisphere when completed.
At the same time, our research suggests that the increasing partisanship of climate policy has been a key barrier for many states.
Some states have tried to restrict climate action, spanning a potential solar-farm construction moratorium in Alabama to a ban on net-zero policy and greenhouse-gas regulation in Florida.
Renewables transcending politics
Importantly, the factors driving the transition to renewables are now frequently transcending politics.
Our research shows that lower cost, quick-to-deploy and energy-secure renewables make practical sense in many market contexts in the US – and globally. Businesses, local governments and consumers are voting with their wallets to address immediate needs.
For example, Texas leads the nation in renewable-energy expansion, despite its lack of decarbonisation goals. Texas’ deregulated power grid and lighter permitting processes, combined with its abundant renewable resources and falling technology costs, have increased renewable electricity capacity to nearly 90GW in 2025.
The state now generates more power from solar farms than coal plants.
Public health is another driver of the clean-energy transition that transcends politics, our research suggests. Oregon, for example, passed a law in 2016 to phase out all coal-generated electricity by 2035, which the state deemed “necessary for the immediate preservation of…public health and safety”.
Data centre development and energy affordability are also shaping state policy landscapes.
Virginia – which has the highest number of data centres of any US state – just passed new laws to allow for more efficient grid utilisation and to shift energy costs towards data centres while assisting low-income households with energy efficiency improvements.
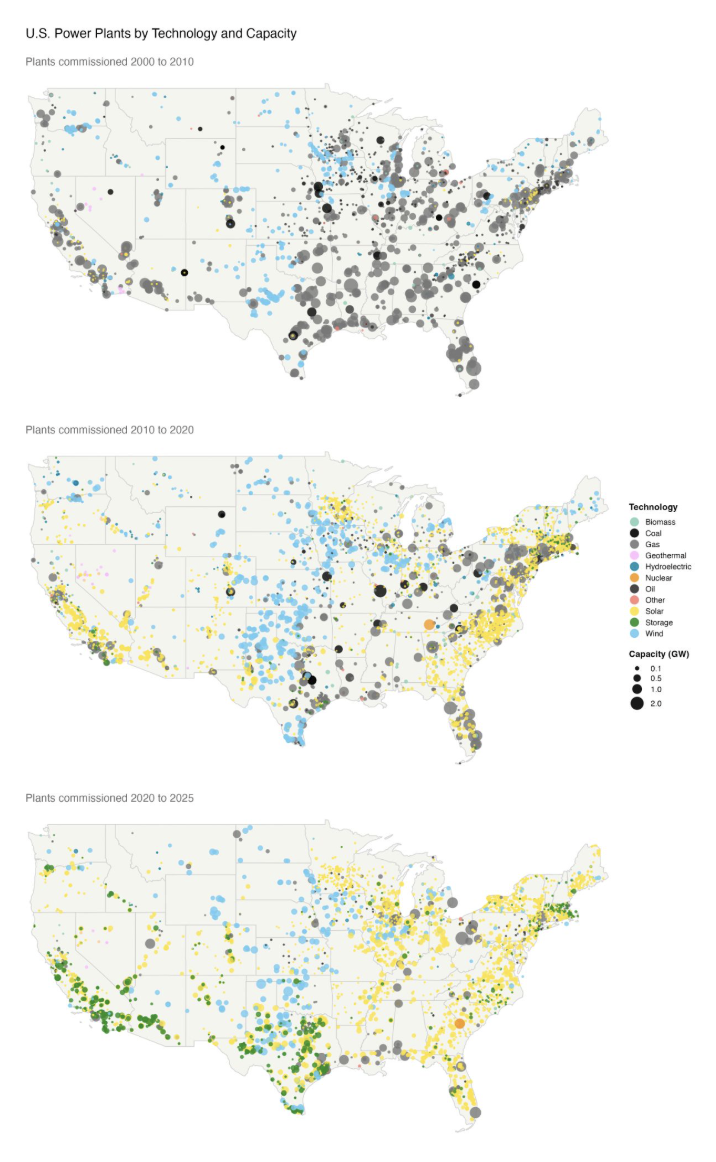
The figure below shows how widespread renewable-energy development now crosses state and political divides, even though it remains constrained to some extent by geography.
Between 2010 and 2020, state and federal policies helped spur renewable energy, with particularly strong growth in states like California and North Carolina.
More recently, declining costs and improving economics have become increasingly important drivers of renewable energy expansion, even amid increasing political and policy setbacks in some regions. This has contributed to a broader dispersion of solar and wind deployment across US states between 2020 and 2025.
While most domestic economic sectors are still fossil-fuel heavy and current US energy security priorities promote continued fossil production, this fossil-fuel reliance has shifted over the past decade away from coal mining towards oil and gas drilling.
Coal production has fallen more than 40% over the last decade, tracking the decline in domestic coal consumption, as shown by the red line in the lower figure below.
In contrast, oil and gas production and exports have grown steadily since 2008, with the US becoming a net liquified natural gas (LNG) exporter over the last decade.
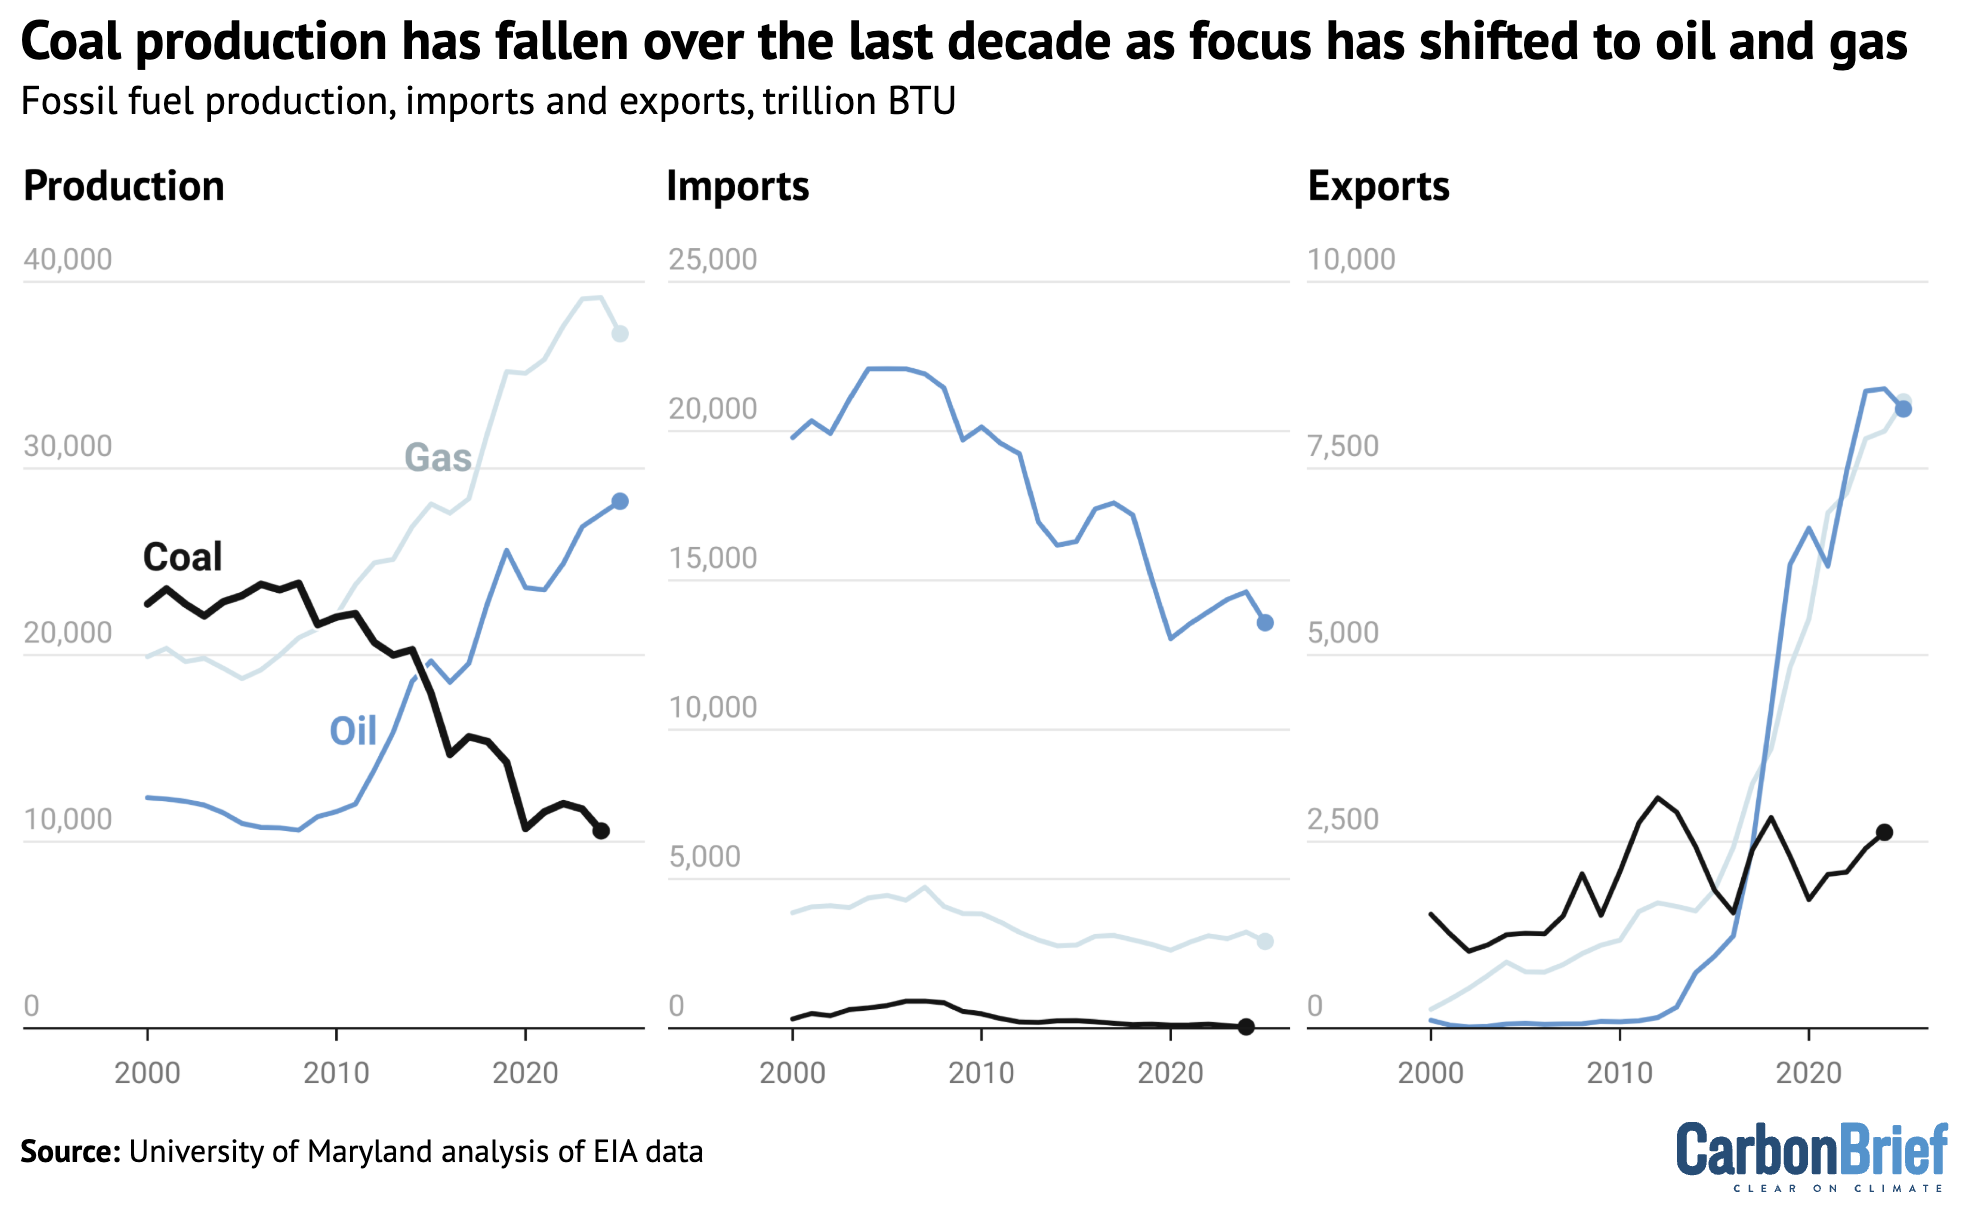
However, recent upheavals in the Middle East have underscored the country’s continued exposure to global fossil- energy markets.
Our research shows that renewable energy deployment in the US today is rooted in its practicality and cost-effectiveness. These advantages are allowing it to outcompete fossil-fuel technologies in terms of electricity capacity expansion, even across varying political landscapes.
Nevertheless, policy continues to influence the sector.
Coupled with parallel strategies for vehicle transport electrification, renewable deployment would offer lowered risks to consumers and businesses from fossil-fuel price volatility.

The post Guest post: How US renewable-energy growth persists despite federal policy uncertainty appeared first on Carbon Brief.
Guest post: How US renewable-energy growth persists despite federal policy uncertainty


-
Greenhouse Gases11 months ago
Guest post: Why China is still building new coal – and when it might stop
-
Climate Change11 months ago
Guest post: Why China is still building new coal – and when it might stop
-

 Greenhouse Gases2 years ago
嘉宾来稿:满足中国增长的用电需求 光伏加储能“比新建煤电更实惠”
-

 Climate Change2 years ago
嘉宾来稿:满足中国增长的用电需求 光伏加储能“比新建煤电更实惠”
-

 Renewable Energy8 months ago
Sending Progressive Philanthropist George Soros to Prison?
-
Climate Change2 years ago
Bill Discounting Climate Change in Florida’s Energy Policy Awaits DeSantis’ Approval
-

 Carbon Footprint2 years ago
US SEC’s Climate Disclosure Rules Spur Renewed Interest in Carbon Credits
-
Greenhouse Gases12 months ago
嘉宾来稿:探究火山喷发如何影响气候预测