
Clean energy generated a record-high 44% of China’s electricity in May 2024, pushing coal’s share down to a record low of 53%, despite continued growth in demand.
The new analysis for Carbon Brief, based on official figures and other data that only became available last week, reveals the true scale of the drop in coal’s share of the mix.
Coal lost seven percentage points compared with May 2023, when it accounted for 60% of generation in China.
Other key insights revealed by the analysis include:
- Monthly National Bureau of Statistics (NBS) data on generation by technology is now severely limited for wind and solar. For example, it excludes “distributed” rooftop solar and smaller centralised solar plants, capturing only about half of solar generation.
- This mismatch becomes clear when comparing the NBS total for monthly electricity generation of 718 terawatt hours (TWh) with reported monthly electricity demand of 775TWh, according to the National Energy Administration (NEA). In reality, electricity generation must be higher than demand due to losses at power plants and on the grid.
- Media reports have speculated that the record renewable capacity additions would have run into grid constraints in May, but the new data shows this is not the case.
- China’s electricity demand in May 2024 grew by 49TWh (7.2%) from a year earlier.
- At the same time, generation from clean energy sources grew by a record 78TWh, including a record rise from solar of 41TWh (78%), a recovery from earlier drought-driven lows for hydro of 34TWh (39%) and a modest rise for wind of 4TWh (5%).
- With clean energy expanding by more than the rise in electricity demand, fossil fuel output was forced into retreat, seeing the largest monthly drop since the Covid 19 pandemic. Gas generation fell by 4TWh (16%) and that from coal by 16TWh (4%).
- Falling generation from fossil fuels point to a 3.6% drop in CO2 emissions from the power sector, which accounts for around two-fifths of China’s total greenhouse gas emissions and has been the dominant source of emissions growth in recent years.
The new findings show a continuation of recent trends, which helped send China’s carbon dioxide (CO2) emissions from fossil fuels and cement into reverse in March 2024.
If current rapid wind and solar deployment continues, then China’s CO2 output is likely to continue falling, making 2023 the peak year for the country’s emissions.
Monthly mismatch
Every month, the NBS publishes data on China’s electricity generation by technology. The figures for May 2024 came out nearly a month ago, in mid-June, and were widely reported.
However, this data is increasingly limited because it excludes, among other things, “distributed” solar sites, such as those on the roofs of homes and businesses. Analysis for this article shows this misses out about half of the electricity generated by solar overall.
The fact that the NBS data on power generation is incomplete is obvious when looking at consumption numbers: the NEA reported electricity consumption in May was 775TWh, while the NBS reported generation at only 718TWh. In reality, generation must be significantly larger than consumption because of losses at power plants and in transmission.
The seemingly small amount of power generation from solar and wind reported by the NBS has caused confusion and has led to claims that the performance of wind and solar in China is poor.
The performance of wind and solar generation is tracked by “utilisation” data collected by China Electricity Council (CEC), showing actual output relative to the maximum potential. These figures are normally included in monthly statistics released by the NEA.
The NEA omitted this data from its May release, which led to speculation from Bloomberg and Reuters that the reason would be poor numbers for wind and solar. This proved to be largely untrue when the data became available directly from the CEC, with solar power utilisation increasing significantly and wind power utilisation falling, but within normal year-to-year variation.
Another dataset, tracking the fraction of solar and wind power wasted due to grid inflexibility, showed small increases of 0.8 percentage-points for solar and 1.7 points for wind. This is problematic for plant operators, but well short of a spike that would notably affect the utilisation numbers – they typically vary by more than 5% from year to year.
There is now enough data to work around the limitations in the NBS power generation data and give a complete picture of China’s power generation mix in May.
The first thing to note is that the NBS numbers are normalised to a 30-day month, which accounts for a fraction of the mismatch. The rest of this article uses normalised 30-day numbers.
Instead of using the NBS numbers, it is possible to estimate generation from solar and wind based on reported capacity and utilisation. Combining these estimates with reported generation for other technologies yields total generation of 783TWh and year-on-year growth of 8%.
Reported electricity consumption of 750TWh – when normalised to a 30-day month – is consistent with estimated generation of 783TWh, with the 4.2% difference being due to transmission losses.
Monthly data on transmission losses is not available, but the average for 2023 was 4.5%, matching closely with the difference between reported consumption and estimated generation.
Record results
Putting the various figures together shows that, far from the modest 29% year-on-year increase in the incomplete NBS data, there was a record 78% rise in solar generation in May 2024.
Installed solar capacity increased by 52% to 691 gigawatts (GW) and capacity utilisation improved from 16% to 19%. This delivered the largest increase in China’s electricity generation for any technology, with solar generation rising 41TWh from 53TWh in May 2023 to 94TWh in May 2024.
The second-largest increase was from hydropower, where capacity only increased 1%, but utilisation jumped from 31% to 41%, as the sector recovers from the record drought seen in 2022-23. This led to a 39% or 34TWh increase in power generation, which hit 115TWh.
Wind power saw a strong increase in capacity of 21%. Utilisation fell, however, likely due to month-to-month variations in wind conditions. As a result, power generation grew by a relatively modest 5%, or 4TWh, reaching 83TWh. Nuclear and biomass-fired power generation also saw small increases in capacity, but the utilisation of nuclear plants fell from 87% to 85%.
In total, clean power generation grew 78TWh, as shown in the figure below. This was more than enough to exceed the 49TWh increase in demand.
As a result, gas-fired generation plummeted by 16%, despite a 9% increase in capacity, driving a steep 24% drop in utilisation. Coal-fired generation capacity increased by 3% while power generation from coal fell 3.7%, resulting in average plant utilisation falling by 7%. Falling demand could temper investment in new coal capacity, which has run hot in the past two years.
The changes in coal and gas-fired generation, combined with a slight degradation in the thermal efficiency of coal-fired power plants, imply a 3.6% drop in CO2 emissions from the power sector.

After these changes in output, China’s power generation mix shifted significantly away from fossil fuels in May 2024. The share of coal-fired generation fell to 53%, down from 60% at the same time last year and the lowest share on record, as shown in the figure below.
Meanwhile, solar rose to 12%, up from 7% a year earlier and the highest on record. The remainder was made up of wind (11%), hydropower (15%), nuclear (5%), gas (3%) and biomass (2%).

The overall non-fossil energy share was a record 44% and there was also a new record-high share for variable renewable – solar and wind – which reached 23%.
Solar and wind are gaining share in China’s power mix very rapidly, despite rising demand, as shown in the figure above. In May 2016, they accounted for just 7% of the total.
Meanwhile, strong clean-energy capacity growth continued in May 2024, with 19GW of solar being added, 3GW of wind and 1.2GW of nuclear.
In the first five months of 2024, China has added some 79GW of solar and 20GW of wind. These additions are up 29% and 21% respectively from last year’s numbers, which were already record-breaking, as shown in the figure below.
Looking at solar specifically, monthly additions in May 2024 were higher than the previous month of April and also increased year-on-year compared with May 2023.

The rapid growth in power generation from solar shows that the solar capacity boom is delivering new electricity supplies at a scale sufficient to cover much of China’s demand growth.
This reinforces the view that China’s CO2 emissions are in a period of structural decline.
If clean energy additions are kept at the level reached in 2023 and early 2024, then CO2 output is likely to keep falling, which would confirm 2023 as the peak year for the country’s emissions.
With China due to announce new climate targets by early next year, the government’s level of ambition for clean energy growth remains an open question.
About the data
Wind and solar output, and thermal power breakdown by fuel, was calculated by multiplying power generating capacity at the end of each month by monthly utilisation – the proportion of maximum possible output – using data reported by China Electricity Council through Wind Financial Terminal.
Total generation from thermal power, hydropower and nuclear power was taken from National Bureau of Statistics monthly releases. Monthly utilisation data was not available for biomass, so the annual average of 52% for 2023 was applied.
CO2 emissions from power generation were calculated by applying emissions factors from China’s latest national greenhouse gas emissions inventory, for the year 2018, as well as the monthly average coal power plant heat rate reported by National Energy Administration, and by assuming average thermal efficiency of 50% for gas-fired power plants.


The post Analysis: China’s clean energy pushes coal to record-low 53% share of power in May 2024 appeared first on Carbon Brief.
Analysis: China’s clean energy pushes coal to record-low 53% share of power in May 2024
Ellen Davies is head of programmes at the African Climate Foundation and is based in Kenya. Wole Hammond is programme officer for adaptation and resilience at the foundation, based in Nigeria.
For generations, African communities have lived on the frontlines of climate disruption, managing erratic rainfall, prolonged droughts and the slow erosion of their livelihoods, which depend on predictable seasons.
When the rains failed across Southern Africa in 2024, it was but the latest chapter of a crisis already long underway. During that season, maize crop failures of 40-80% devastated farming communities in Zambia, Zimbabwe and Malawi, where roughly 70% of people depend on rain-fed agriculture. Governments already stretched by debt were forced to raid development budgets, trading long-term growth for emergency relief.
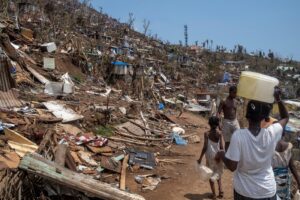
Then came the floods. In early 2026, parts of Mozambique, Zimbabwe and South Africa received over a year’s worth of rain in days. More than 2 million people were affected. In East Africa, drought has displaced nearly 62,000 people in Somalia this year alone, with nearly one in four Somalis now facing acute food insecurity.
This is what climate change looks like on the ground – not parts per million or diplomatic jargon, but whether a school stays open after floods cut off the road, whether a clinic can function in extreme heat, whether a country can still invest in its future when every year brings another disaster bill.
As Nigeria rails at loss and damage “mirage”, fund boss assures money is coming
Africa as a continent contributes the least to global emissions yet bears a disproportionate share of the consequences. Nine of the ten countries most vulnerable to climate change are African. As livelihoods collapse and rural economies fail, migration pressures will intensify, driven by climate change intersecting with poverty, conflict and constrained opportunity.
Chronic under-funding
Europe is only now beginning to experience, in more limited form, what African communities have navigated for decades with far less fiscal space, thinner insurance coverage and fewer resources for recovery. With El Niño conditions confirmed and a “super” version of the naturally occurring weather pattern possible later this year, the pressure is set to intensify further.
In Africa, climate action is fundamentally a development challenge where adaptation and mitigation must go hand in hand. Building a solar grid and flood-proofing the road that serves it are not separate agendas. Yet for too long, the global climate conversation has prioritised mitigation while leaving adaptation – the work of protecting lives, livelihoods and economies in a changing climate – chronically under-funded.
The result is three compounding gaps. A visibility gap: much of Africa’s adaptation work remains under-documented and under-recognised in global climate narratives. A financing gap: capital does not flow at the scale or speed required to the people and institutions best placed to use it. And a decision-making gap: too many solutions are still designed elsewhere and imported into African contexts, rather than backing African-led platforms to scale what is already working.
Live from LCAW – Raw diplomacy: Can new mineral alliances deliver a just energy transition?
Solutions ready for finance
The solutions exist. Rwanda’s green investment fund has mobilised climate finance at national scale through its own systems. Egypt’s Nexus of Water, Food and Energy programme has shown how integrated planning can stretch limited resources across interdependent systems.
Zambia’s Presidential Irrigation Initiative is building climate-resilient food production from the ground up. In Pata, Senegal, a solar irrigation project has unlocked agricultural production and created jobs, demonstrating how integrated investments in water, energy and livelihoods can deliver resilience and development gains simultaneously.
In South Africa, the African Climate Foundation’s work with the South African Local Government Association (SALGA) is supporting district municipalities to assess their climate risks and develop fit-for-purpose Climate Action Plans, building adaptation capacity where it is needed most – at the local level.
These are not pilot projects waiting to be validated. They are working systems waiting for investment.
Closing the gaps requires a decisive shift in posture from global finance, philanthropy and development institutions. It means backing country-led platforms that can prepare, aggregate and finance adaptation projects. It means investing in place-based initiatives grounded in local knowledge.
French court rules Total must revise climate plan to account for all emissions
It means fostering intra- and inter-continental collaboration, so that lessons from Kigali inform decisions in Nairobi and innovations in Lagos reach communities in Dakar. And it means treating adaptation as core economic infrastructure, not charitable relief.
Invest now for future gains
The economic case is clear. Every dollar invested in climate adaptation returns an estimated four dollars in benefits on average – and up to five in the poorest economies. Under-investment in African adaptation is as economically irrational as it is morally unjust.
The world depends on Africa’s food systems, its young workforce – the majority of the continent’s population is under 25 – and its minerals. Several African countries supply a substantial share of the copper, cobalt and other critical materials underpinning the global clean energy transition.
Drought in Zambia has already shown how climate stress can disrupt hydropower, electricity supply and mining output. A transition that depends on African minerals cannot afford to ignore African climate resilience.
The world can continue to under-fund adaptation and pay repeatedly for emergencies, instability and lost development. Or it can invest now in the people, institutions and systems already doing the work on the ground in Africa, not in solutions imported from elsewhere.
Africa has the agency, the knowledge and the platforms. What it needs is the finance to match. A super El Niño will not wait for consensus to form. Neither, frankly, should we.
The post Climate adaptation in Africa needs investment, not imported solutions appeared first on Climate Home News.
Climate adaptation in Africa needs investment, not imported solutions
Climate Change
DeBriefed 26 June 2026: Heat records broken across Europe | London climate action week | Introducing ‘Project Cosmos’
Welcome to Carbon Brief’s DeBriefed.
An essential guide to the week’s key developments relating to climate change.
This week
Record Europe heat
HOTTEST EVER: The UK broke its temperature record for June twice this week, while France recorded its hottest day ever two days in a row, reported the Guardian. The Times reported that temperatures reached 36.7C in Somerset on Thursday, as the “London Ambulance Service had its busiest-ever day for life-threatening emergencies”.
FRANCE FRYING: French newspaper Libération said that temperatures reached as high as 44.3C in the south-western commune of Pissos on Wednesday. Spain also recorded its highest daily average temperature for June, said BBC News. On Thursday, Switzerland also had its hottest June day, when temperatures reached 37C in four locations, reported SwissInfo.
CLIMATE LINK: CNN covered a rapid analysis from the World Weather Attribution service finding that fossil-fuelled climate change has made this heatwave the most severe and widespread in Europe’s history. Carbon Brief covered the broken heat records, explaining the influence of climate change.
‘Electrifying’ London talks
‘LONDON COOKING’: In a sweltering, packed-out event at London climate action week, UN chief António Guterres quipped that “London is not just calling, it’s cooking”, reported Edie. Guterres also used his address to release a “global call to action on methane” and to call on artificial intelligence companies to reveal their environmental impact and source their power solely from renewables by 2030, said the publication.
‘ELECTRIFY NOW’: Elsewhere, dozens of governments, led by the EU and the UK, committed to throwing “their political weight” behind a rapid electrification of the world’s economy, according to Climate Home News. A high-level summit in London’s Mansion House saw energy ministers and business leaders, joined by Guterres, in “calling for faster action to curb demand for oil, coal and gas by powering homes, industry and transport with clean electricity”.
FOSSIL TRANSITION: At the same event, ministers from Colombia and the Netherlands, the co-hosts of the world’s first summit on transitioning away from fossil fuels in April, unveiled a report on their key takeaways. It comes after the current Colombian government has been ousted by a presidential election defeat to a fossil-fuel-supporting Trump ally. Carbon Brief examined what this could mean for the world’s energy transition.
Around the world
- UK TARGET: The UK parliament has approved its “seventh carbon budget”, aimed at cutting emissions 87% below 1990 levels by 2040.
- TOTAL ACCOUNTABILITY: A French court has ordered oil-and-gas giant TotalEnergies to account for the emissions from the use of its products, following a case brought by a climate NGO, reported Le Monde.
- METHANE RULES: The US, Qatar and other major energy exporters have urged the EU to “rewrite planned methane emissions” rules for oil-and-gas imports, saying that the policy could disrupt fuel supplies to Europe, according to Reuters.
- CHINA MESSAGE: China’s special envoy for climate change, Liu Zhenmin, said at the World Economic Forum that energy shortages triggered by the Iran war should be a “lesson to countries to accelerate their energy transitions”, reported Bloomberg.
- US WEBSITE REVIVED: Former US government workers have “recreated a valuable climate-science website” shut down by the Trump administration last year, said the New York Times.
6,600 animals
The number of livestock that perished in transport during heat in England and Wales from June to August 2025, double the number killed the year before, reported Carbon Brief.
Latest climate research
- Some world regions are experiencing up to 50 additional heat stress days annually, when compared to 1950 | Nature Climate Change
- Projections of national land-use emissions to 2100 suggest the strongest “carbon sinks” will be in China and Indonesia, whereas Brazil and the Democratic Republic of the Congo will “dominate global sources” | Nature
- Most carbon-offset projects relying on “avoided deforestation” have “mixed, negligible or negative impacts relative to control areas” | Nature Climate Change
(For more, see Carbon Brief’s in-depth daily summaries of the top climate news stories on Monday, Tuesday, Wednesday, Thursday and Friday.)
Captured
The UK government’s official climate advisers, the Climate Change Committee (CCC), has released its latest progress report, emphasising that faster electrification is the best way to secure lower energy bills and stronger energy security. Electrification has shot up the agenda in recent months, with the COP31 presidency calling for countries to back a global goal for 35% of “final” energy to come from electricity by 2035. The text of the CCC’s latest report uses the word “electrification” far more often than previous editions, as shown in the figure above. See Carbon Brief’s in-depth breakdown of the CCC’s latest advice.
Spotlight
Introducing ‘Project Cosmos’
Carbon Brief explains how it built a major new database of climate science research and unveils a new ranking of the 500 most highly cited publications, authors and institutions in climate science.
This week, Carbon Brief launched Project Cosmos – the world’s largest and most complete database of climate change research.
The database features more than 1.8m academic papers, books and reports, capturing the vast body of human knowledge about climate change that has accumulated over more than a century of academic study.
The climate science “universe” is based on reports from the Intergovernmental Panel on Climate Change (IPCC), which are recognised as the world’s most authoritative summaries of the latest climate science.
Since its first report was published in 1990, humanity’s knowledge about human-caused climate change has ballooned. The IPCC has published six sets of reports in total – each one longer than the last.
In total, IPCC reports reference more than 100,000 other papers, books and reports. This is the core of our climate science universe. Carbon Brief then built on this core, by looking at four other sources of data. Read more about how the Cosmos database was created here.

Every single publication in the Cosmos database is linked to at least one other through references. Visualising these links reveals a “galaxy” of references.
In the image above, each colour and cluster reveals different topics and densities of research. Explore the galaxy in an interactive map.
Cosmos 500
As part of an initial wave of preliminary analysis to demonstrate the scope of the Project Cosmos database, Carbon Brief has ranked the 500 most highly cited publications, authors and institutions in the database.
The most highly cited climate scientist is Prof Philippe Ciais, who has spent almost four decades researching the planet’s carbon cycle – and the ways in which humans have been impacting its balance. Carbon Brief recently interviewed Ciais in Paris.
The US tops the tables for the most highly cited authors and institutions. Almost half of the 500 most highly-cited authors are from US institutions. This raises particular concerns for the future of climate science, as US climate scientists and institutions are coming under attack under the Trump administration.
Experts from global south countries account for only 4% of all authors in the Cosmos 500. China stands out as the most highly-cited global south country. Meanwhile, only 10% of authors in the Cosmos 500 are women.
There are many possibilities for future avenues of research using the Cosmos database. Over time, the database could be used to reveal, for example, how interest in different areas of climate science has changed over time, plus identify potential knowledge gaps and, thus, opportunities for future research.
Carbon Brief invites researchers – including academics, journalists and analysts – to submit their own proposals for co-authored studies, literature reviews and analytical projects. Proposals should be sent to cosmos AT carbonbrief DOT org.
This spotlight first appeared in Cited, Carbon Brief’s new fortnightly newsletter focused on climate research. Sign up for free.
Watch, read, listen
‘DOOMSDAY CULT’: OpenDemocracy reported on a “religious cult” spreading climate misinformation in “parliaments” and at “COP summits”.
‘WEDGES’ EXAMINED: ProPublica and Drilled released an investigation into how oil executives worked to influence a climate research paper from Princeton University known as “wedges”.
‘1976 to 2056’: A 30-minute YouTube video from the Met Office had climate scientists explaining how current UK temperatures compare to the infamous 1976 heatwave, and how extremes could worsen by 2056.
Coming up
- 29-30 June: Hamburg sustainability conference, Hamburg, Germany
- 29-30 June: Seventh global conference on climate and sustainable development goals synergies, Bangkok, Thailand
- 29-30 June: 11th annual global conference on energy efficiency, Montreal, Canada
Pick of the jobs
- Drilled, series editor | Salary: $4,000 a month (six-month contract). Location: US
- Met Office, ocean climate science manager | Salary: £54,515-£58,582. Location: Exeter, UK
- Grantham Research Institute on Climate Change and the Environment, research officer (climate science and law) | Salary: £43,277-£55,497. Location: London
DeBriefed is edited by Daisy Dunne. Please send any tips or feedback to debriefed@carbonbrief.org.
This is an online version of Carbon Brief’s weekly DeBriefed email newsletter. Subscribe for free here.
The post DeBriefed 26 June 2026: Heat records broken across Europe | London climate action week | Introducing ‘Project Cosmos’ appeared first on Carbon Brief.
Over the last four years, Colombia has emerged as one of the most vocal advocates for the world to transition away from fossil fuels.
Under the leadership of leftist politician and economist Gustavo Petro, it became the first major oil-and-gas producer to commit to halting all new fossil-fuel expansion.
In April, the nation hosted a first-of-its-kind meeting of countries on transitioning away from fossil fuels, alongside the Netherlands, in the Caribbean city of Santa Marta.
The meeting concluded with a promise for a new “Santa Marta process” spearheaded by Colombia and the Netherlands, a movement of countries that would continue to push for a transition away from fossil fuels at home – and at international climate talks.
But on 21 June, an ally of Petro suffered defeat in a presidential election runoff against Abelardo de la Espriella, a hard-right populist and favourite of US president Donald Trump, who has pledged to boost oil production and pursue “fracking to the max”.
Below, Carbon Brief examines what the loss could mean for Colombia’s stance on fossil fuels, as well as international efforts to transition away from coal, oil and gas, including at the COP31 climate summit in Turkey in November.
- How could the election defeat change Colombia’s stance on fossil fuels?
- How could it affect international efforts to transition away from fossil fuels?
- How could efforts to transition away from fossil fuels feature at COP31?
How could the election defeat change Colombia’s stance on fossil fuels?
In 2022, Petro became Colombia’s first left-wing president in recent history.
Under his leadership, Colombia became the first major oil producer and exporter to halt all new fossil-fuel expansion, boosted renewable energy and saw a sustained decline in deforestation.
At the COP28 summit in 2023, Petro announced that Colombia would become the first major oil exporter to sign the fossil-fuel non-proliferation treaty, a pact to legally control fossil-fuel production and use.

Successive Colombian environment ministers became among the most vocal supporters of transitioning away from fossil fuels at UN climate talks.
This included former minister Susana Muhamad, a political scientist and environmentalist who stepped in to lead the most recent UN biodiversity summit in 2024 after original host Turkey was forced to withdraw following earthquakes.
She was succeeded by Irene Vélez Torres, a former academic who led calls for a “fossil-fuel roadmap” to be part of the formal outcome at the COP30 summit in 2025.
At the sidelines of COP30, Vélez Torres and Netherlands climate minister Stientje van Veldhoven announced plans to co-host a first-of-its-kind summit on transitioning away from fossil fuels in Colombia in April 2026.
(In the end, countries failed to agree to a formally negotiated “fossil-fuel roadmap” at COP30. However, the Brazilian COP30 presidency promised to bring forward a voluntary roadmap instead, informed by the Santa Marta summit.)
Some 57 countries – representing one-third of the world’s economy – participated in the event, with officials describing it as “refreshing”, “highly successful” and “groundbreaking”, according to Carbon Brief’s reporting from Colombia.
The meeting concluded with a range of outcomes, including a second fossil-fuel transition summit to be co-hosted by Tuvalu and Ireland in 2027.
In stark contrast to Petro’s government, new hard-right populist president Abelardo de la Espriella has promised to quickly boost new fossil-fuel and mining projects, including by “fracking to the max”.
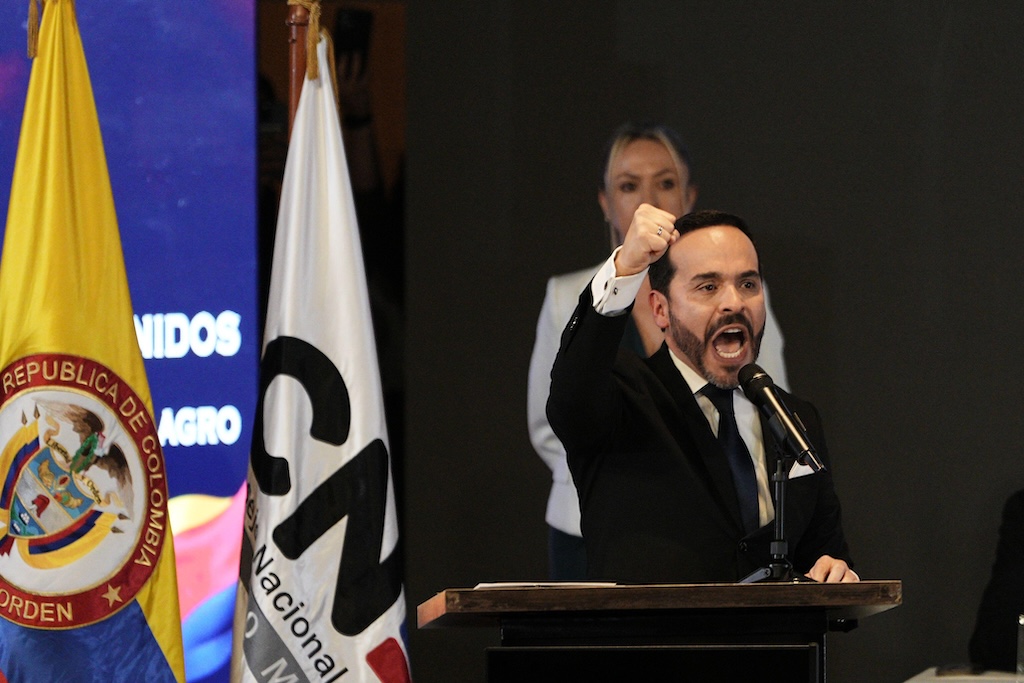
De la Espriella has also promised to build 10 “mega prisons” inside Colombia’s Amazon rainforest.
He has not yet commented on whether he will withdraw Colombia from Santa Marta’s “coalition of the willing”.
How could it affect international efforts to transition away from fossil fuels?
Just two days after the Colombian government’s election defeat, environment minister Vélez Torres took to the stage at London climate action week, alongside Netherlands climate minister van Veldhoven, to present a report on key takeaways from the Santa Marta summit.
The report, written before the election loss, speaks of an ongoing “Santa Marta process” to accelerate the global transition away from fossil fuels. It says that this will be coordinated by Colombia and the Netherlands, along with the two appointed co-hosts of the second conference on transitioning away from fossil fuels, Tuvalu and Ireland.
Acknowledging that this was likely to be one of her last addresses as Colombia’s environment minister, Vélez Torres told the audience that, going forward, the Santa Marta process must be resilient to “political setbacks”.
At the sidelines of the event, Vélez Torres told Carbon Brief that the work her government has done “cannot be erased”, despite a change in power. She said:
“Right now, we are facing the dark nights, this will really shift the politics in terms of energy position and environmental protection. But we are certain that our legacy will continue. It goes beyond governments.”
Dutch minister van Veldhoven told Carbon Brief that the plan for the “Santa Marta process” is to hold fossil-fuel transition summits in a different country every year, with two new co-hosts each time. This could help weather political shocks, she said:
“We know that every couple of years there will be elections. That is why [we have] the idea of rotating presidencies and chairmanships…while we make sure we make use of existing secretariats and organisations that are not subject to political changes every couple of years.
“In that combination, we hope to create a historic legacy and continue to drive the process forward, but also [create space for] a new energy from two new countries every year that bring their own perspective and their own dynamic.”
Although new countries could drive the process forward without Colombia, there are few major oil producers that have shown the same level of commitment to transitioning away from fossil fuels.
Ana Toni, an economist and CEO of the COP30 summit in Brazil, told Carbon Brief at London climate action week that the world will “miss the leadership of Colombia”, but added:
“Not one country will stop this movement. All countries need to chip in. There isn’t one leader for this topic. Everybody needs to join forces.”
How could efforts to transition away from fossil fuels feature at COP31?
At London climate action week, Colombia and the Netherlands presented their Santa Marta report to the Brazilian COP30 presidency.
The COP30 presidency is due to release a voluntary international “fossil-fuel roadmap” ahead of COP31 in Turkey in November, which it has promised will be informed by the takeaways from Santa Marta.
Speaking at the sidelines of London climate action week, Colombia and the Netherlands added that they have had “constructive” conversations with the COP31 co-presidencies, Australia and Turkey, about how to incorporate the discussions from Santa Marta.
Colombian environment minister Irene Vélez Torres told a small group of journalists:
“We had this very interesting conversation with COP31 and they were clearly open to suggestions about what is needed in the discussion in Turkey, and we were explicit about the need to engage with the phasing out of fossil fuels.”
However, both Colombia and the Netherlands added that they were unsure of how this might work in practice.
When asked about whether the Santa Marta discussions could be incorporated into formal COP texts, they were keen to emphasise that all the conversations in Colombia were specifically not negotiations.
They added that they were unsure of whether the group of 57 countries that gathered in Santa Marta would appear as a collective at press conferences or events at the COP31 summit.


The post Q&A: What change of power in Colombia could mean for world’s fossil-fuel transition appeared first on Carbon Brief.
Q&A: What change of power in Colombia could mean for world’s fossil-fuel transition


-
Climate Change11 months ago
Guest post: Why China is still building new coal – and when it might stop
-
Greenhouse Gases11 months ago
Guest post: Why China is still building new coal – and when it might stop
-

 Greenhouse Gases2 years ago
嘉宾来稿:满足中国增长的用电需求 光伏加储能“比新建煤电更实惠”
-

 Climate Change2 years ago
嘉宾来稿:满足中国增长的用电需求 光伏加储能“比新建煤电更实惠”
-

 Renewable Energy8 months ago
Sending Progressive Philanthropist George Soros to Prison?
-
Climate Change2 years ago
Bill Discounting Climate Change in Florida’s Energy Policy Awaits DeSantis’ Approval
-

 Carbon Footprint2 years ago
US SEC’s Climate Disclosure Rules Spur Renewed Interest in Carbon Credits
-
Greenhouse Gases12 months ago
嘉宾来稿:探究火山喷发如何影响气候预测