

English version below
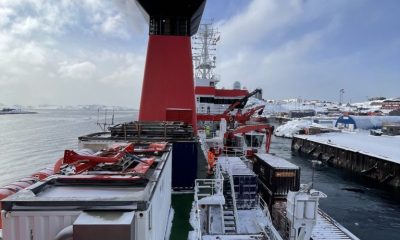
Es beginnt der zweite Teil unserer Forschungsreise. Wir fahren im Moment Richtung Norden in die Labradorsee. Inzwischen ist es mit einer Lufttemperatur um 4°C richtig kalt geworden. Wir sind auf dem Weg zum 53. Breitengrad. Dort liegen fest verankerte Geräte, die zum Beispiel Temperatur, Salzgehalt, Sauerstoff und Strömungsgeschwindigkeiten messen können. Man kann sich das so vorstellen, dass die Messgeräte aufgereiht sind, wie an einer langen Perlenkette. An einem Ende der „Perlenkette“ befindet sich ein Anker, der alles an einer spezifischen Position festhält. Durch Schwimmkörper, die zwischen den Messgeräten positioniert sind, bekommt die ganze Kette Auftrieb und schwebt dadurch senkrecht in der Wassersäule. Diese sogenannten Verankerungen können 2-3 km lang sein und sind das erste Ziel unserer Reise.
Seit 1997 befinden sich Teile der Verankerungen schon an dieser Stelle in der Labradorsee und werden im Abstand von 2 Jahren kontrolliert. Die Position wurde aus gutem Grund gewählt. Die Labradorsee ist ein bedeutender Ort für die Zirkulation des gesamten Ozeans, denn hier befindet sich ein Ort an dem neues Tiefenwasser gebildet wird. Aufgrund von Dichteänderungen sinkt dabei sauerstoffreiches, kaltes und salzreiches Wasser ab. Die Stelle, an der sich die Verankerungen befinden ist besonders, da sich dort ein Knotenpunkt verschiedener Strömungen befindet. Alle dichten Wassermassen des Nordatlantiks kommen hier zusammen und bilden den westlichen Randstrom, der in der Tiefe Richtung Süden fließt. Durch die lange Messreihe ist es möglich Schwankungen in dieser Bildung der Wassermassen zu dokumentieren, was zum Beispiel Schlussfolgerungen über die Stärke des Golfstroms ermöglichen kann. So können auf lange Sicht potenzielle Auswirkungen des Klimawandels auf die Ozeanzirkulation abgeleitet werden.


In den nächsten Tagen werden wir die Verankerungen aus dem Wasser holen, gegebenenfalls reparieren, die Daten aus den Messgeräten auslesen und alles am Ende wieder ins Wasser werfen. Dieser Prozess läuft eigentlich immer gleich ab. Zuerst wird vom Schiff aus ein akustisches Signal ins Wasser gesendet. Dieses Signal löst die Verbindung zwischen Anker und dem Kabel mit den Messgeräten. Die Verankerung fängt dann an, zur Wasseroberfläche aufzusteigen – das liegt an den zu Anfang bereits erwähnten Schwimmkörpern. Anschließend wird von der Brücke Ausschau gehalten, wo die Verankerung genau an die Oberfläche treibt. Dann wird alles Stück für Stück an Bord geholt, gesäubert und demontiert. Erst, wenn die Messgeräte wieder mit neuen Batterien bestückt und die Daten ausgelesen sind, wird alles wieder zusammengebaut und Stück für Stück wieder ins Wasser gelassen. Als allerletztes wird der Anker ins Wasser gesetzt. Er fällt zum Meeresboden und zieht die Verankerung unaufhaltsam mit nach unten.
Abhängig von der Länge, braucht man einige Stunden für diesen Prozess. Pro Tag werden im Idealfall 1-3 Verankerungen abgefertigt. Eine wichtige Rolle spielt bei dieser Arbeit das Wetter. Drei Dinge sind hierbei wichtig: gute Sichtbedingungen, möglichst wenig Welle und Tageslicht. Im Moment ist der Nebel unser größter Gegenspieler, doch meistens verzieht er sich den Tag über und stört uns nur noch, beim Sterne oder Sonnenuntergang beobachten.
Mooring works
The second part of our research journey begins. We are currently heading north to the Labrador Sea. In the meantime, it has become really cold with an air temperature around 4°C. We are on our way to the 53rd latitude. This is the location of permanently anchored measurement devices that can measure, for example, temperature, salinity, oxygen and flow velocities. One can imagine that the measuring instruments are lined up, as if on a long chain of beads. At one end of the “pearl chain” there is an anchor that holds everything in a specific position. With the help of floating devices positioned between the measuring instruments, the entire chain receives buoyancy and thus floats vertically in the water column. These so-called moorings can be 2-3 km long and are the first destination of our trip.
Since 1997, parts of the moorings have been located at this point in the Labrador Sea and are checked at intervals of 2 years. The position was chosen for good reason. The Labrador Sea is an important place for the circulation of the entire ocean, because here is a place where new deep water is formed. Due to changes in density, oxygen-rich, cold and salt-rich water sinks. The location where the moorings are located is special, since there is a junction of different currents. All the dense water masses of the North Atlantic come together here and form the deep western boundary current, which flows in depth southward. Due to the long series of measurements, it is possible to document fluctuations in this formation of the water masses, which can, for example, allow conclusions about the strength of the Gulf Stream. In this way, in the long term, potential effects of climate change on ocean circulation can be deduced.

Over the next few days we will take the moorings out of the water, repair them if necessary, read the data from the measuring devices and finally throw everything back into the water. This process is usually always the same. First, an acoustic signal is sent into the water from the ship. This signal breaks the connection between the anchor and the cable with the measuring devices. The mooring then begins to rise to the water surface – this is due to the floats mentioned at the beginning. Then we look out from the bridge to see exactly where the mooring is floating to the surface. Then everything is brought on board piece by piece, cleaned and dismantled. Only when the measuring devices have been fitted with new batteries and the data has been read out will everything be reassembled and put back into the water piece by piece. The very last thing to do is to put the anchor in the water. It falls to the seabed and inexorably pulls the mooring down with it.
Depending on the length of the mooring, this process takes several hours. Ideally, 1-3 anchorings are completed per day. The weather plays an important role in this work. Three things are important here: good visibility, as little waves as possible and daylight. At the moment the fog is our biggest opponent, but it usually disappears during the day and only disturbs us when we are watching the stars or the sunset.




If you’ve ever joined a beach cleanup, you’ve almost certainly picked up a plastic bottle. During Ocean Conservancy’s 2025 International Coastal Cleanup® (ICC), plastic beverage bottles were the top item collected by volunteers around the world. Plastic bottles have been among the top 10 items collected throughout the ICC’s entire 41-year history.
But where do those bottles really come from? We know rivers carry plastics of all shapes and sizes from inland communities to coasts and the ocean. What we know far less about is what makes plastic bottles move within rivers, what speeds them up or slows them down and how likely they are to reach the coast and become ocean pollution. Research on river plastics is growing worldwide, but studies in North America lag behind other regions.
Ocean Conservancy scientists, alongside a team of collaborators from 10 research institutions around the United States and Canada, set out to help close some of these pressing knowledge gaps.
How do you track a plastic bottle?
… with a little help from GPS! We modeled our research after a 2021 project in the Toronto Harbor conducted by our University of Toronto colleagues. Like the Toronto project, our research team outfitted floating plastic bottles with GPS tags that reported each bottle’s location at regular intervals. That let us calculate how far and how fast every bottle traveled. Over a two-year period, we released about 300 GPS-tagged bottles into 30 stretches of river in Los Angeles, California; California’s San Francisco Bay Area; Chicago, Illinois; Washington, D.C.; Miami, Florida; Boston, Massachusetts; and Toronto, Canada.
We chose each of these places on purpose.
The locations were selected to represent varied watershed types (ranging from temperate to subtropical climates and mountainous to flat terrain) and development intensity (suburban to densely urban). We followed the bottles for about three months each, through changing seasons, storms and rainfall before locating and retrieving them. And while the plan was always to recover the bottles at the end of the experiment, we also conducted cleanups in each watershed beforehand to make sure we were leaving things a little cleaner than we started.
What did we find?
Our bottles went on quite a journey! On average, each bottle traveled 3.8 miles, but distance traveled actually spanned a huge range depending on the bottle and location. For example, one of our bottles barely budged, moving just 240 feet over the deployment period. Another made it further than the length of a marathon, clocking in at 33 miles traveled.
We found river flow was a major driver of how far bottles went, but it wasn’t the only factor—the landscape around each river mattered too. Patterns in bottle movement revealed:
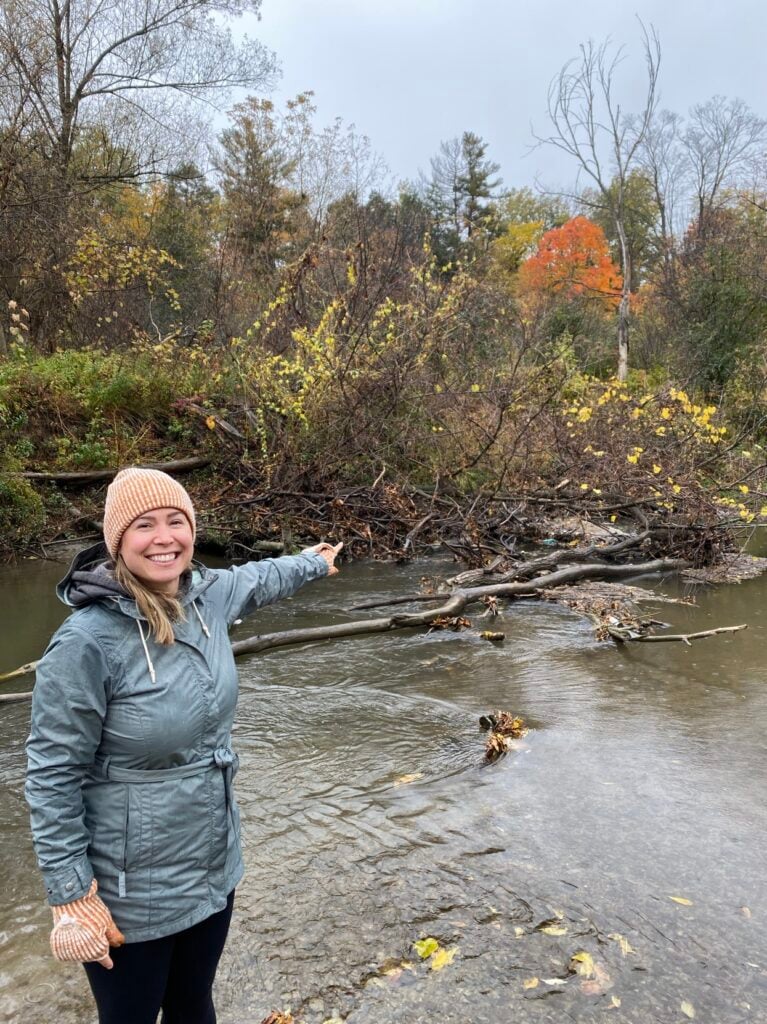
- Forest and vegetation in rivers slowed bottles down. The more forest cover upstream, the less likely a bottle was to reach the coast, because it got snagged in brush, branches and other natural obstructions.
- More urbanized stretches sped them up. Bottles moved farther and faster in more urbanized stretches of river, where there was typically less vegetation to catch them.
Using thousands of GPS points, as well as data about the river systems and watersheds we studied, we built a model to estimate where bottles reaching the coast or the Great Lakes may be coming from. It showed that within a one-year period, about half originate quite close to shore (within seven miles). The other half come from much farther inland, up to 120 miles away!
Why does this matter for our ocean?
Plastic bottles aren’t just unsightly. Ocean Conservancy’s recent, award-winning research found they can be deadly to marine life—either as whole items or after they break up into sharp fragments. There have been documented instances of seabirds like albatross dying after swallowing a plastic bottle whole.
Plastic bottles are among the most prolific plastic pollutants we see out there, and now we understand that many of those we find on beaches or in the ocean may be coming from far upstream.
That has big implications for how we tackle the problem. If half of the bottles reaching the ocean around North America or Great Lakes can start their trip more than 100 miles inland, prevention must happen upstream. Pollution-prevention models, like laws that incentivize the collection and recycling of plastic bottles before they end up in the environment, should be implemented more broadly to prevent plastic from becoming pollution in the first place. Cleanups and other efforts in coastal communities also remain critical. If we want to capture floating plastics like bottles before they reach the coast and eventually our ocean, communities within 120 miles from the ocean or Great Lakes should plan to do those cleanups on an annual basis, or even more frequently.
How can I help keep plastic bottles out of rivers and the ocean?
No matter where you live, the choices you make can help keep plastic out of the ocean:
- Support policies, like those Ocean Conservancy advocates, to stop plastic pollution at the source.
- Join a cleanup along your local river, creek or lakeshore. Every bottle picked up inland is one less that can wash out to sea.
- Choose reusables instead of single-use plastic bottles whenever you can.
We want to extend a huge thank-you to our amazing collaborators on this project at the University of New Hampshire, University of Toronto, Loyola University of Chicago, Smithsonian Environmental Research Center, Florida International University, Moore Institute for Plastic Pollution Research, San Francisco Estuary Institute, University of Waterloo, University of Southern California and University of New Mexico.
Our study, “GPS-Tracked Bottles in North American Rivers Show Marine Plastic Pollution Can Originate from Far Upstream,” was published in the November 13 issue of the scientific journal Environmental Science & Technology-Water. Read the full paper here.
This blog was co-written with Hannah De Frond. Hannah works with Ocean Conservancy and the University of Toronto Trash Team to manage the International Trash Trap Network (ITTN), a global network of local groups using trash traps to increase cleanup efforts, engage communities and inform upstream solutions.
Get Ocean Updates in Your Inbox
Sign up with your email and never miss an update.
The post How Far Does a Plastic Bottle Really Travel in a Year? appeared first on Ocean Conservancy.
If you’ve ever joined a beach cleanup, you’ve almost certainly picked up a plastic bottle. During Ocean Conservancy’s 2025 International Coastal Cleanup® (ICC), plastic beverage bottles were the top item collected by volunteers around the world. Plastic bottles have been among the top 10 items collected throughout the ICC’s entire 41-year history.
But where do those bottles really come from? We know rivers carry plastics of all shapes and sizes from inland communities to coasts and the ocean. What we know far less about is what makes plastic bottles move within rivers, what speeds them up or slows them down and how likely they are to reach the coast and become ocean pollution. Research on river plastics is growing worldwide, but studies in North America lag behind other regions.
Ocean Conservancy scientists, alongside a team of collaborators from 10 research institutions around the United States and Canada, set out to help close some of these pressing knowledge gaps.
How do you track a plastic bottle?
… with a little help from GPS! We modeled our research after a 2021 project in the Toronto Harbor conducted by our University of Toronto colleagues. Like the Toronto project, our research team outfitted floating plastic bottles with GPS tags that reported each bottle’s location at regular intervals. That let us calculate how far and how fast every bottle traveled. Over a two-year period, we released about 300 GPS-tagged bottles into 30 stretches of river in Los Angeles, California; California’s San Francisco Bay Area; Chicago, Illinois; Washington, D.C.; Miami, Florida; Boston, Massachusetts; and Toronto, Canada.
We chose each of these places on purpose.
The locations were selected to represent varied watershed types (ranging from temperate to subtropical climates and mountainous to flat terrain) and development intensity (suburban to densely urban). We followed the bottles for about three months each, through changing seasons, storms and rainfall before locating and retrieving them. And while the plan was always to recover the bottles at the end of the experiment, we also conducted cleanups in each watershed beforehand to make sure we were leaving things a little cleaner than we started.
What did we find?
Our bottles went on quite a journey! On average, each bottle traveled 3.8 miles, but distance traveled actually spanned a huge range depending on the bottle and location. For example, one of our bottles barely budged, moving just 240 feet over the deployment period. Another made it further than the length of a marathon, clocking in at 33 miles traveled.
We found river flow was a major driver of how far bottles went, but it wasn’t the only factor—the landscape around each river mattered too. Patterns in bottle movement revealed:
- Forest and vegetation in rivers slowed bottles down. The more forest cover upstream, the less likely a bottle was to reach the coast, because it got snagged in brush, branches and other natural obstructions.
- More urbanized stretches sped them up. Bottles moved farther and faster in more urbanized stretches of river, where there was typically less vegetation to catch them.
Using thousands of GPS points, as well as data about the river systems and watersheds we studied, we built a model to estimate where bottles reaching the coast or the Great Lakes may be coming from. It showed that within a one-year period, about half originate quite close to shore (within seven miles). The other half come from much farther inland, up to 120 miles away!