
The Integrity Council for the Voluntary Carbon Market (ICVCM) published new decisions under its Core Carbon Principles (CCP) program. The update covers three carbon credit methodologies, also called “categories” in ICVCM’s system. One methodology received full approval, and two received conditional approval.
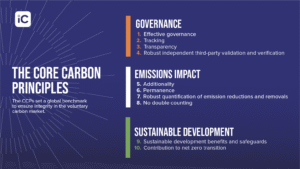
ICVCM’s CCP label is meant to help buyers spot carbon credits that meet a clear, minimum integrity bar. ICVCM uses an Assessment Framework to apply its label. This framework checks how programs and methods handle key issues, including quantification, additionality, monitoring, and verification.
According to Annette L. Nazareth, Chair of the Governing Board, ICVCM
“Demand for CCP-labelled credits has grown steadily, commanding price premiums that reflect buyers’ renewed trust. Policymakers, multilateral institutions, and standard-setters have incorporated the CCPs into their own frameworks, recognising the Integrity Council’s role in building coherence across voluntary and compliance markets.”
The three decisions were:
- Isometric: ISM Reforestation Protocol v1.1 — CCP Approved
- Gold Standard: Methane emission reduction by adjusted water management practice in rice cultivation v1.0 — CCP Approved (Conditional)
- American Carbon Registry (ACR): Improved Forest Management (IFM) on Non-Federal US Forestlands v2.0 — CCP Approved (Conditional)
How the CCP Label Works and When Conditions Apply
A CCP-approved method can earn credits for the CCP label. Projects need to follow the method and the program’s usual rules. In this ICVCM update, the Isometric reforestation method was approved without conditions. This means credits issued under it can get CCP labeling immediately.
A CCP-approved but conditional methodology can still earn the label, but only if specific conditions are met. These conditions can apply to how projects prove additionality. They can also apply to how projects account for risks. Finally, they may apply to how projects set baselines and leakage deductions.
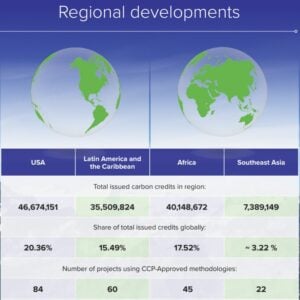
ICVCM also published a market-level snapshot with its February 2026 decisions. It approved eight carbon-crediting programs as CCP-Eligible. It also approved 38 methodologies.
However, 22 methodologies did not meet the requirements. About 105 million credits were approved for the CCP label. Of these, 52 million are available, while 53 million have been retired or canceled. Globally, here’s ICVCM’s carbon credit achievement:
Isometric Sets a First for Nature-Based CCP Credits
ICVCM granted full CCP approval to Isometric’s ISM Reforestation Protocol v1.1, which Isometric published in October 2025. The protocol outlines rules for measuring carbon removals from reforestation. This refers to restoring forest cover on land that was once forested. ICVCM placed it under the broader Afforestation, Reforestation, and Revegetation (ARR) category.
ICVCM said the assessment found the protocol met all relevant criteria in the CCP Assessment Framework. Because the body approved it with no conditions, it stated that all credits issued under the methodology will be eligible for CCP labels.
The Integrity Council also shared early activity indicators for this protocol. It said no credits had been issued yet, but 20 project developers were already registered under the methodology. The organization added that Isometric expects to issue over 4 million credits annually by 2030 under this protocol.
Isometric announced this week that the approval makes its Reforestation Protocol the first nature-based protocol with the CCP label.
- RELATED: Verra Issues First CCP-Labeled IFM Credits Under VM0045: A New Era for Forest Carbon Accounting
Rice Methane Credits Get a Conditional Green Light
ICVCM gave conditional CCP approval to Gold Standard’s method for cutting methane emissions. This method focuses on adjusting water management in rice cultivation (version 1.0). The Integrity Council announced that it published the methodology in July 2023. It is the first approved method for avoiding methane in rice cultivation.
The basic idea behind adjusted water management is simple. Flooded rice fields can produce methane because organic matter breaks down without oxygen. Changing water levels during the growing season can reduce methane formation.
Gold Standard’s documentation states that methane forms in flooded fields with low oxygen. It also notes that the methodology helps water regime changes that reduce methane emissions.
ICVCM also pointed to recent research on the scale of rice methane. A Nature Research Highlight from May 2025 said that a new inventory found rice paddy methane emissions were over 39 million metric tonnes in 2022.
Why Some Credits Qualify, and Others Don’t
The Integrity Council said the rice methodology qualifies for CCP approval only when specific conditions are met. The conditions show how a project proves additionality in some cases. They also explain a rule update about soil organic carbon loss risk in the methodology.
ICVCM also gave credit volume and pipeline estimates. It said about 50,000 credits had been issued under this methodology so far. However, the body understood that none of those credits complied with the first condition. As a result, the organization said those already-issued credits will not be eligible for the CCP label.
ICVCM noted that Gold Standard plans to issue up to 3.2 million credits in the next five years. This is based on its current project pipeline projections. It also listed the main project locations as India, plus activities in Pakistan, Vietnam, Bangladesh, Cambodia, Ghana, Indonesia, Lao PDR, Nepal, and Thailand.
- SEE MORE: Shell’s Initiative to Cut Methane in Rice Farming in the Philippines and Create Carbon Credits
ACR’s Forest Credits Face Tighter Baseline Tests
Same with Gold Standard, ICVCM also granted conditional CCP approval to ACR’s Improved Forest Management (IFM) on Non-Federal US Forestlands v2.0. IFM projects aim to change forest management practices to increase stored carbon or avoid emissions compared with a baseline scenario.
ICVCM explained that v2.0 is an earlier version of an IFM methodology that its Governing Board had already approved in August 2025 (v2.1). For v2.1, ICVCM had set a condition tied to leakage.
- A leakage deduction is needed for projects that cut wood product output by less than 5%. This keeps treatment consistent with projects that exceed that threshold.
For v2.0, ICVCM set two additional conditions. The methodology can earn CCP labeling if:
- A dynamic evaluation of the baseline is verified in line with ACR’s tool for dynamic baseline evaluation (developed with v2.1), and/or
- Removal credits are generated using a specified equation in the methodology (ICVCM references Equation 30).
ICVCM also quantified the immediate impact. It said 2.7 million credits were expected to be immediately eligible for the CCP label out of 13.3 million issued credits under this methodology.
The Integrity Council also stated that past and future removal credits from this method can get CCP labels. Future emission reduction credits can qualify, too, if they use the dynamic baseline evaluation tool.
ACR said the CCP label will soon activate for 2.7 million eligible IFM 2.0 credits in the ACR registry. They linked eligibility to the same baseline evaluation tool.
What CCP Expansion Means for Buyers and Developers
These ICVCM decisions matter because they expand the set of methodologies that can produce credits with the CCP label. For buyers, the label can act as a quick screen when building procurement rules. CCP decisions can influence method evolution for project developers and standards bodies. Conditional approvals often need updates to methods or stricter project tests.
At the same time, the details show that CCP labeling is not automatic. For example, ICVCM’s conditions for the rice methodology mean that some already-issued credits will not qualify. In the IFM case, ICVCM tied eligibility to specific approaches for baselines and the type of credit (removals versus emission reductions).
The approvals expand high-integrity CCP-labeled credits. They also signal growing supply for buyers while enforcing strict standards on baselines, additionality, and verification—shaping voluntary carbon markets toward greater quality and scale.
The post ICVCM Adds New CCP-Approved Carbon Credit Methods for Isometric, Gold Standard and ACR appeared first on Carbon Credits.
Every business carbon footprint report ends with a number, the amount of carbon emissions produced by the business, less the amount of carbon reduced and offset, given in tonnes of CO₂. Many of the people who sign off on that number, including those who paid for it, cannot picture what it represents on the ground. A tonne is a unit of mass. CO₂ is invisible. The link between the amount offset in the report and a real piece of restored forest somewhere in the world is almost never indicated.
![]()
Americans are paying more for insurance, electricity, taxes, and home repairs every year. What many people may not realize is that climate change is already one of the drivers behind those rising costs.
For many households, climate change is no longer just an environmental issue. It is becoming a cost-of-living issue. While climate impacts like melting glaciers and shrinking polar ice can feel distant from everyday life, the financial effects are already showing up in monthly budgets across the country.
Today, a larger share of household income is consumed by fixed costs such as housing, insurance, utilities, and healthcare. (3) Climate change and climate inaction are adding pressure to many of those expenses through higher disaster recovery costs, rising energy demand, infrastructure repairs, and increased insurance risk.
The goal of this article is to help connect climate change to the everyday financial realities people already experience. Regardless of where someone stands on climate policy, it is important to recognize that climate change is already increasing costs for households, businesses, and taxpayers across the United States.
More conservative estimates indicate that the average household has experienced an increase of about $400 per year from observed climate change, while less conservative estimates suggest an increase of $900.(1) Those in more disaster-prone regions of the country face disproportionate costs, with some households experiencing climate-related costs averaging $1,300 per year.(1) Another study found that climate adaptation costs driven by climate change have already consumed over 3% of personal income in the U.S. since 2015.(9) By the end of the century, housing units could spend an additional $5,600 on adaptation costs.(1)
Whether we realize it or not, Americans are already paying for climate change through higher insurance premiums, energy costs, taxes, and infrastructure repairs. These growing expenses are often referred to as climate adaptation costs.
Without meaningful climate action, these costs are expected to continue rising. Choosing not to invest in climate action is also choosing to spend more on climate adaptation.
Here are a few ways climate change is already increasing the cost of living:
- Higher insurance costs from more frequent and severe storms
- Higher energy use during longer and hotter summers
- Higher electricity rates tied to storm recovery and grid upgrades
- Higher government spending and taxpayer-funded disaster recovery costs
The real debate is not whether climate change costs money. Americans are already paying for it. The question is where we want those costs to go. Should we invest more in climate action to help reduce future climate adaptation costs, or continue paying growing recovery and adaptation expenses in everyday life?
How Climate Change Is Increasing Insurance Costs
There is one industry that closely tracks the financial impact of natural disasters: insurance. Insurance companies are focused on assessing risk, estimating damages, and collecting enough revenue to cover losses and remain financially stable.
Comparing the 20-year periods 1980–1999 and 2000–2019, climate-related disasters increased 83% globally from 3,656 events to 6,681 events. The average time between billion-dollar disasters dropped from 82 days during the 1980s to 16 days during the last 10 years, and in 2025 the average time between disasters fell to just 10 days. (6)
According to the reinsurance firm Munich Re, total economic losses from natural disasters in 2024 exceeded $320 billion globally, nearly 40% higher than the decade-long annual average. Average annual inflation-adjusted costs more than quadrupled from $22.6 billion per year in the 1980s to $102 billion per year in the 2010s. Costs increased further to an average of $153.2 billion annually during 2020–2024, representing another 50% increase over the 2010s. (6)
In the United States, billion-dollar weather and climate disasters have also increased significantly. The average number of billion-dollar disasters per year has grown from roughly three annually during the 1980s to 19 annually over the last decade. In 2023 and 2024, the U.S. recorded 28 and 27 billion-dollar disasters respectively, both setting new records. (6)
The growing impact of climate change is one reason insurance costs continue to rise. “There are two things that drive insurance loss costs, which is the frequency of events and how much they cost,” said Robert Passmore, assistant vice president of personal lines at the Property Casualty Insurers Association of America. “So, as these events become more frequent, that’s definitely going to have an impact.” (8)
After adjusting for inflation, insurance costs have steadily increased over time. From 2000 to 2020, insurance costs consistently grew faster than the Consumer Price Index due to rising rebuilding costs and weather-related losses.(3) Between 2020 and 2023 alone, the average home insurance premium increased from $75 to $360 due to climate change impacts, with disaster-prone regions experiencing especially steep increases.(1) Since 2015, homeowners in some regions affected by more extreme weather have seen home insurance costs increased by nearly 57%.(1) Some insurers have also limited or stopped offering coverage in high-risk areas.(7)
For many families, rising insurance costs are no longer occasional financial burdens. They are becoming recurring monthly expenses tied directly to growing climate risk.
How Rising Temperatures Increase Household Energy Costs

The financial impacts of climate change extend beyond insurance. Rising temperatures are also changing how much energy Americans use and how utilities plan for future electricity demand.
Between 1950 and 2010, per capita electricity use increased 10-fold, though usage has flattened or slightly declined since 2012 due to more efficient appliances and LED lighting. (3) A significant share of increased energy demand comes from cooling needs associated with higher temperatures.
Over the last 20 years, the United States has experienced increasing Cooling Degree Days (CDD) and decreasing Heating Degree Days (HDD). Nearly all counties have become warmer over the past three decades, with some areas experiencing several hundred additional cooling degree days, equivalent to roughly one additional degree of warmth on most days. (1) This trend reflects a warming climate where air conditioning demand is increasing while heating demand generally declines. (4)
As temperatures continue rising, households are expected to spend more on cooling than they save on heating. The U.S. Energy Information Administration (EIA) projects that by 2050, national Heating Degree Days will be 11% lower while Cooling Degree Days will be 28% higher than 2021 levels. Cooling demand is projected to rise 2.5 times faster than heating demand declines. (5)
These projections come from energy and infrastructure experts planning for future electricity demand and grid capacity needs. Utilities and grid operators are already preparing for higher peak summer electricity loads caused by rising temperatures. (5)
Longer and hotter summers also affect how homes and buildings are designed. Buildings constructed for past climate conditions may require upgrades such as larger air conditioning systems, stronger insulation, and improved ventilation to remain comfortable and energy efficient in the future. (10)
For many households, this means higher monthly utility bills and potentially higher long-term home improvement costs as temperatures continue to rise.
How Climate Change Affects Electricity Rates
On an inflation-adjusted basis, average U.S. residential electricity rates are slightly lower today than they were 50 years ago. (2) However, climate-related damage to utility infrastructure is creating new upward pressure on electricity costs.
Electric utilities rely heavily on above-ground poles, wires, transformers, and substations that can be damaged by hurricanes, storms, floods, and wildfires. Repairing and upgrading this infrastructure often requires substantial investment.
As a result, utilities are increasing electricity rates in response to wildfire and hurricane events to fund infrastructure repairs and future mitigation efforts. (1) The average cumulative increase in per-household electricity expenditures due to climate-related price changes is approximately $30. (1)
While this increase may appear modest today, utility costs are expected to rise further as climate-related infrastructure damage becomes more frequent and severe.
How Climate Disasters Increase Government Spending and Taxes
Extreme weather events also damage public infrastructure, including roads, schools, bridges, airports, water systems, and emergency services infrastructure. Recovery and rebuilding costs are often funded through taxpayer dollars at the federal, state, and local levels.
The average annual government cost tied to climate-related disaster recovery is estimated at nearly $142 per household. (1) States that frequently experience hurricanes, wildfires, tornadoes, or flooding can face even higher public recovery costs.
These expenses affect taxpayers whether they personally experience a disaster or not. Climate-related recovery spending can increase pressure on public budgets, emergency management systems, and infrastructure funding nationwide.
Reducing Climate Costs Through Climate Action
While this article focuses on the growing financial costs associated with climate change, the issue is not only about money for many people. It is also about recognizing our environmental impact and taking responsibility for reducing it in order to help preserve a healthy planet for future generations.
While individuals alone cannot solve climate change, collective action can help reduce future climate adaptation costs over time.
For those interested in taking action, there are three important steps:
- Estimate your carbon footprint to better understand the emissions connected to your lifestyle and activities.
- Create a plan to gradually reduce emissions through energy efficiency, cleaner technologies, and more sustainable choices.
- Address remaining emissions by supporting verified carbon reduction projects through carbon credits.
Carbon credits are one of the most cost-effective tools available for climate action because they help fund projects that generate verified emission reductions at scale. Supporting global emission reduction efforts can help reduce the long-term impacts and costs associated with climate change.
Visit Terrapass to learn more about carbon footprints, carbon credits, and climate action solutions.
The post How Climate Change Is Raising the Cost of Living appeared first on Terrapass.

Investor climate group closes down, blaming “limits” of shareholder activism

Where the Republican Party Has Gone Since Eisenhower in the 1950s
Cropped 3 June 2026: Highway through the Amazon | El Niño impact | State of CO2 removal
-
Climate Change10 months ago
Guest post: Why China is still building new coal – and when it might stop
-
Greenhouse Gases10 months ago
Guest post: Why China is still building new coal – and when it might stop
-

 Greenhouse Gases2 years ago
嘉宾来稿:满足中国增长的用电需求 光伏加储能“比新建煤电更实惠”
-

 Climate Change2 years ago
嘉宾来稿:满足中国增长的用电需求 光伏加储能“比新建煤电更实惠”
-
Climate Change2 years ago
Bill Discounting Climate Change in Florida’s Energy Policy Awaits DeSantis’ Approval
-

 Renewable Energy7 months ago
Sending Progressive Philanthropist George Soros to Prison?
-

 Carbon Footprint2 years ago
US SEC’s Climate Disclosure Rules Spur Renewed Interest in Carbon Credits
-
Greenhouse Gases11 months ago
嘉宾来稿:探究火山喷发如何影响气候预测