

Chinese electric vehicle (EV) giant BYD is accelerating its global expansion, especially in Europe and Canada. In contrast, Tesla is losing ground across key markets. New sales data, policy shifts, and geopolitical deals suggest a major shift in the EV landscape.
This trend matters not just for automakers. It also impacts battery metals, supply chains, carbon markets, and the future of clean mobility.
BYD’s Germany Boom Marks Europe’s EV Shake-Up
BYD recorded a dramatic surge in German sales in January 2026. Bloomberg highlighted data from Germany’s Federal Motor Transport Authority (KBA) showing that BYD’s registrations jumped more than 10-fold from January 2025. The company sold only 235 vehicles in Germany last year, but recent data suggests sales likely exceeded 2,500 units.
Meanwhile, Tesla struggled. BYD more than doubled Tesla’s registrations in Germany during the same month.
Overall, car sales in Germany declined 6.6% to 193,981 vehicles in January. However, electric cars still accounted for 22% of new registrations, highlighting strong demand for EVs despite a weak auto market. This surge shows that BYD’s low-cost models and expanding lineup are gaining traction in Europe’s largest automotive market.
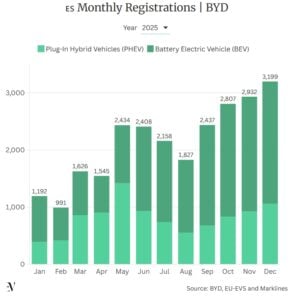
Significantly, the German numbers reflect a broader European trend. Throughout 2025, BYD recorded more than 200% year-on-year growth in many months. In December 2025 alone, its European registrations reached 27,678 units—up nearly 230%.
Breakthrough in Spain
Spain emerged as another key battleground. BYD dominated the Spanish EV and plug-in hybrid market in January 2026.
- The company registered 1,962 vehicles, a 64.6% year-on-year increase. It captured a 13.6% market share, leading both fully electric and plug-in hybrid segments.
- Fully electric sales rose nearly 30% to 1,039 units, putting BYD ahead of Kia and Mercedes-Benz. Tesla ranked fourth, with only 458 fully electric vehicles sold.
Spain’s performance highlights BYD’s strategy of combining affordable EVs with hybrids to capture diverse buyers.
Notably, BYD also sold 1,326 battery-electric vehicles in the UK, marking a nearly 21% increase from the previous year.
Tesla’s European Sales Collapse Deepens
Tesla, on the other hand, saw sales decline every month in Europe during 2025. The trend continued into 2026. Its struggles were especially visible in Northern and Western Europe.
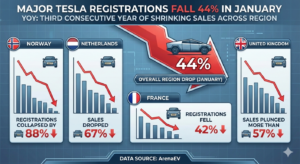
In five major European markets, Tesla’s registrations fell 44% year-over-year in January. This marked the third consecutive year of shrinking sales across the region.
- Norway: Registrations collapsed by 88%, with only 83 vehicles sold.
- Netherlands: Sales dropped 67%.
- France: Registrations fell 42% to 661 vehicles, the lowest in over three years.
- United Kingdom: Sales plunged more than 57% to just 647 vehicles.
Policy changes played a role. Norway reduced EV tax incentives starting January 1, which hurt Tesla demand. However, the scale of the decline surprised analysts.
Even in Sweden and Denmark, where Tesla saw sales rise by 26% and 3%, the total number of cars sold remains low. These minor gains do little to offset the sharp decline compared with two years ago.
Analysts believe that one key issue is Tesla’s aging lineup. The Model Y, once a top seller, is now over four years old, and buyers are looking for newer options. Although Tesla launched more affordable “Standard” versions of the Model Y and Model 3, these updates have not been enough to reverse the downward trend.
In the current scenario, Tesla is not only losing ground to Chinese brands. European automakers are also regaining market share. Volkswagen overtook Tesla in 2025 to become Europe’s top-selling EV brand. It sold around 274,000 units, compared to Tesla’s 235,000.
This shows Europe’s EV market is becoming more competitive, with local manufacturers and Chinese brands challenging Tesla’s early dominance.

Canada Opens the Door to Chinese EVs
Europe is not the only region where BYD is gaining ground. Prime Minister Mark Carney signed a landmark trade agreement with China on January 16, 2026. This deal allows Chinese-made EVs to enter the market at low tariffs.
- So Canada will allow up to 49,000 Chinese EVs annually at a tariff rate of 6.1%. This marks a sharp reversal from the 100% tariff imposed in October 2024.
Also, the quota could rise to about 70,000 vehicles within five years. By 2030, at least half of imported Chinese EVs must be priced below CAD 35,000. In exchange, China agreed to reduce tariffs on Canadian canola seed, improving agricultural trade relations.
PM Carney said,
“At its best, the Canada-China relationship has created massive opportunities for both our peoples. By leveraging our strengths and focusing on trade, energy, agri-food, and areas where we can make huge gains, we are forging a new strategic partnership that builds on the best of our past, reflects the world as it is today, and benefits the people of both our nations.”
BYD Gains a Regulatory Edge in Canada
BYD holds a unique advantage in Canada. Its manufacturing facilities in Shenzhen and Xi’an are already approved for Canadian imports. This pre-clearance gives BYD a head start over rivals like NIO, XPeng, and Li Auto. However, other Chinese brands must wait for regulatory approvals or rely on slower case-by-case processes.
BYD also operates an electric bus assembly plant in Ontario, strengthening its local presence. Furthermore, affordable models like the Seagull and Dolphin, priced between $20,000 and $30,000, could qualify under Canada’s affordability requirements.
Political Backlash and U.S. Concerns
The Canada-China EV deal triggered political controversy. Ontario Premier Doug Ford initially urged Canadians to boycott Chinese EVs, warning the agreement could hurt domestic manufacturing.
Labor unions and automakers also expressed concern. They fear the deal could weaken North America’s automotive industry and strain U.S.-Canada trade relations.
As per reports, U.S. President Donald Trump threatened tariffs on Canadian goods if the deal moves forward, calling it a “disaster.” However, Canadian officials argue the agreement aligns with USMCA rules and will expand the EV market.
Analysts estimate Chinese EVs could capture around 23% of Canada’s EV sales in the first year, saving consumers about CAD 6,700 per vehicle.

Stock Market Snapshot: BYDDY vs TSLA
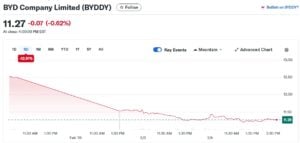
BYD’s (BYDDY) stock trades around $11.28 per share, with a market cap of roughly $102 billion. The stock is near the lower end of its 52-week range, reflecting margin pressures and geopolitical risks.
Tesla’s (TSLA) stock trades near $406 per share, with a market cap of about $1.35 trillion. Analysts expect a volatile 2026, with forecasts ranging widely depending on EV demand and margins.

Despite Tesla’s valuation premium, BYD’s rapid sales growth is reshaping investor sentiment.
The Bigger Picture: A Global EV Power Shift
BYD’s rapid rise shows how the EV industry is changing. Chinese automakers are using scale, government support, and efficient production to challenge Western rivals. At the same time, Tesla remains strong in technology, software, and brand recognition. Yet, price competition and shifting policies are reshaping the market.
In Europe, declining subsidies, along with Canada’s new trade rules and ongoing geopolitical tensions, are affecting EV adoption and corporate strategies. As BYD gains ground in Germany, Europe, and Canada, it signals a turning point in the global EV race. Tesla’s falling sales highlight the increasing pressure from both Chinese and European competitors.
For investors, policymakers, and climate advocates, these trends matter. They will influence battery supply chains, emissions targets, and the demand for carbon credits. The EV transition is no longer led by a single company—today, it has become a global contest for scale, affordability, and sustainable leadership.
The post How BYD’s European Surge and Canada Deal Are Challenging Tesla’s EV Dominance appeared first on Carbon Credits.
Every business carbon footprint report ends with a number, the amount of carbon emissions produced by the business, less the amount of carbon reduced and offset, given in tonnes of CO₂. Many of the people who sign off on that number, including those who paid for it, cannot picture what it represents on the ground. A tonne is a unit of mass. CO₂ is invisible. The link between the amount offset in the report and a real piece of restored forest somewhere in the world is almost never indicated.
![]()
Americans are paying more for insurance, electricity, taxes, and home repairs every year. What many people may not realize is that climate change is already one of the drivers behind those rising costs.
For many households, climate change is no longer just an environmental issue. It is becoming a cost-of-living issue. While climate impacts like melting glaciers and shrinking polar ice can feel distant from everyday life, the financial effects are already showing up in monthly budgets across the country.
Today, a larger share of household income is consumed by fixed costs such as housing, insurance, utilities, and healthcare. (3) Climate change and climate inaction are adding pressure to many of those expenses through higher disaster recovery costs, rising energy demand, infrastructure repairs, and increased insurance risk.
The goal of this article is to help connect climate change to the everyday financial realities people already experience. Regardless of where someone stands on climate policy, it is important to recognize that climate change is already increasing costs for households, businesses, and taxpayers across the United States.
More conservative estimates indicate that the average household has experienced an increase of about $400 per year from observed climate change, while less conservative estimates suggest an increase of $900.(1) Those in more disaster-prone regions of the country face disproportionate costs, with some households experiencing climate-related costs averaging $1,300 per year.(1) Another study found that climate adaptation costs driven by climate change have already consumed over 3% of personal income in the U.S. since 2015.(9) By the end of the century, housing units could spend an additional $5,600 on adaptation costs.(1)
Whether we realize it or not, Americans are already paying for climate change through higher insurance premiums, energy costs, taxes, and infrastructure repairs. These growing expenses are often referred to as climate adaptation costs.
Without meaningful climate action, these costs are expected to continue rising. Choosing not to invest in climate action is also choosing to spend more on climate adaptation.
Here are a few ways climate change is already increasing the cost of living:
- Higher insurance costs from more frequent and severe storms
- Higher energy use during longer and hotter summers
- Higher electricity rates tied to storm recovery and grid upgrades
- Higher government spending and taxpayer-funded disaster recovery costs
The real debate is not whether climate change costs money. Americans are already paying for it. The question is where we want those costs to go. Should we invest more in climate action to help reduce future climate adaptation costs, or continue paying growing recovery and adaptation expenses in everyday life?
How Climate Change Is Increasing Insurance Costs
There is one industry that closely tracks the financial impact of natural disasters: insurance. Insurance companies are focused on assessing risk, estimating damages, and collecting enough revenue to cover losses and remain financially stable.
Comparing the 20-year periods 1980–1999 and 2000–2019, climate-related disasters increased 83% globally from 3,656 events to 6,681 events. The average time between billion-dollar disasters dropped from 82 days during the 1980s to 16 days during the last 10 years, and in 2025 the average time between disasters fell to just 10 days. (6)
According to the reinsurance firm Munich Re, total economic losses from natural disasters in 2024 exceeded $320 billion globally, nearly 40% higher than the decade-long annual average. Average annual inflation-adjusted costs more than quadrupled from $22.6 billion per year in the 1980s to $102 billion per year in the 2010s. Costs increased further to an average of $153.2 billion annually during 2020–2024, representing another 50% increase over the 2010s. (6)
In the United States, billion-dollar weather and climate disasters have also increased significantly. The average number of billion-dollar disasters per year has grown from roughly three annually during the 1980s to 19 annually over the last decade. In 2023 and 2024, the U.S. recorded 28 and 27 billion-dollar disasters respectively, both setting new records. (6)
The growing impact of climate change is one reason insurance costs continue to rise. “There are two things that drive insurance loss costs, which is the frequency of events and how much they cost,” said Robert Passmore, assistant vice president of personal lines at the Property Casualty Insurers Association of America. “So, as these events become more frequent, that’s definitely going to have an impact.” (8)
After adjusting for inflation, insurance costs have steadily increased over time. From 2000 to 2020, insurance costs consistently grew faster than the Consumer Price Index due to rising rebuilding costs and weather-related losses.(3) Between 2020 and 2023 alone, the average home insurance premium increased from $75 to $360 due to climate change impacts, with disaster-prone regions experiencing especially steep increases.(1) Since 2015, homeowners in some regions affected by more extreme weather have seen home insurance costs increased by nearly 57%.(1) Some insurers have also limited or stopped offering coverage in high-risk areas.(7)
For many families, rising insurance costs are no longer occasional financial burdens. They are becoming recurring monthly expenses tied directly to growing climate risk.
How Rising Temperatures Increase Household Energy Costs

The financial impacts of climate change extend beyond insurance. Rising temperatures are also changing how much energy Americans use and how utilities plan for future electricity demand.
Between 1950 and 2010, per capita electricity use increased 10-fold, though usage has flattened or slightly declined since 2012 due to more efficient appliances and LED lighting. (3) A significant share of increased energy demand comes from cooling needs associated with higher temperatures.
Over the last 20 years, the United States has experienced increasing Cooling Degree Days (CDD) and decreasing Heating Degree Days (HDD). Nearly all counties have become warmer over the past three decades, with some areas experiencing several hundred additional cooling degree days, equivalent to roughly one additional degree of warmth on most days. (1) This trend reflects a warming climate where air conditioning demand is increasing while heating demand generally declines. (4)
As temperatures continue rising, households are expected to spend more on cooling than they save on heating. The U.S. Energy Information Administration (EIA) projects that by 2050, national Heating Degree Days will be 11% lower while Cooling Degree Days will be 28% higher than 2021 levels. Cooling demand is projected to rise 2.5 times faster than heating demand declines. (5)
These projections come from energy and infrastructure experts planning for future electricity demand and grid capacity needs. Utilities and grid operators are already preparing for higher peak summer electricity loads caused by rising temperatures. (5)
Longer and hotter summers also affect how homes and buildings are designed. Buildings constructed for past climate conditions may require upgrades such as larger air conditioning systems, stronger insulation, and improved ventilation to remain comfortable and energy efficient in the future. (10)
For many households, this means higher monthly utility bills and potentially higher long-term home improvement costs as temperatures continue to rise.
How Climate Change Affects Electricity Rates
On an inflation-adjusted basis, average U.S. residential electricity rates are slightly lower today than they were 50 years ago. (2) However, climate-related damage to utility infrastructure is creating new upward pressure on electricity costs.
Electric utilities rely heavily on above-ground poles, wires, transformers, and substations that can be damaged by hurricanes, storms, floods, and wildfires. Repairing and upgrading this infrastructure often requires substantial investment.
As a result, utilities are increasing electricity rates in response to wildfire and hurricane events to fund infrastructure repairs and future mitigation efforts. (1) The average cumulative increase in per-household electricity expenditures due to climate-related price changes is approximately $30. (1)
While this increase may appear modest today, utility costs are expected to rise further as climate-related infrastructure damage becomes more frequent and severe.
How Climate Disasters Increase Government Spending and Taxes
Extreme weather events also damage public infrastructure, including roads, schools, bridges, airports, water systems, and emergency services infrastructure. Recovery and rebuilding costs are often funded through taxpayer dollars at the federal, state, and local levels.
The average annual government cost tied to climate-related disaster recovery is estimated at nearly $142 per household. (1) States that frequently experience hurricanes, wildfires, tornadoes, or flooding can face even higher public recovery costs.
These expenses affect taxpayers whether they personally experience a disaster or not. Climate-related recovery spending can increase pressure on public budgets, emergency management systems, and infrastructure funding nationwide.
Reducing Climate Costs Through Climate Action
While this article focuses on the growing financial costs associated with climate change, the issue is not only about money for many people. It is also about recognizing our environmental impact and taking responsibility for reducing it in order to help preserve a healthy planet for future generations.
While individuals alone cannot solve climate change, collective action can help reduce future climate adaptation costs over time.
For those interested in taking action, there are three important steps:
- Estimate your carbon footprint to better understand the emissions connected to your lifestyle and activities.
- Create a plan to gradually reduce emissions through energy efficiency, cleaner technologies, and more sustainable choices.
- Address remaining emissions by supporting verified carbon reduction projects through carbon credits.
Carbon credits are one of the most cost-effective tools available for climate action because they help fund projects that generate verified emission reductions at scale. Supporting global emission reduction efforts can help reduce the long-term impacts and costs associated with climate change.
Visit Terrapass to learn more about carbon footprints, carbon credits, and climate action solutions.
The post How Climate Change Is Raising the Cost of Living appeared first on Terrapass.


-
Climate Change10 months ago
Guest post: Why China is still building new coal – and when it might stop
-
Greenhouse Gases10 months ago
Guest post: Why China is still building new coal – and when it might stop
-

 Greenhouse Gases2 years ago
嘉宾来稿:满足中国增长的用电需求 光伏加储能“比新建煤电更实惠”
-

 Climate Change2 years ago
嘉宾来稿:满足中国增长的用电需求 光伏加储能“比新建煤电更实惠”
-
Climate Change2 years ago
Bill Discounting Climate Change in Florida’s Energy Policy Awaits DeSantis’ Approval
-

 Renewable Energy7 months ago
Sending Progressive Philanthropist George Soros to Prison?
-

 Carbon Footprint2 years ago
US SEC’s Climate Disclosure Rules Spur Renewed Interest in Carbon Credits
-
Greenhouse Gases11 months ago
嘉宾来稿:探究火山喷发如何影响气候预测