

Harnessing the Power of the Wind: Wind Energy in the United States
Wind energy, once a quaint image of rural water pumps and nostalgic Americana, has transformed into a major player in the United States’ energy landscape.
Its towering turbines now dot vast plains, coastal bluffs, and even mountaintops, capturing the boundless energy of the wind and converting it into clean, renewable electricity.
A Growing Giant:
The US boasts the second-largest installed wind power capacity globally, with over 141 gigawatts (GW) as of January 2023. This represents a remarkable surge from just 6 GW in 2000, highlighting the rapid growth and increasing importance of wind power. In 2022 alone, wind accounted for a significant 22% of all new electricity capacity installed, showcasing its vital role in diversifying the nation’s energy mix.
Beyond Megawatts: The Impact of Wind Power:
Wind’s significance extends far beyond generating electricity. It’s a clean energy source, devoid of the harmful emissions that contribute to climate change. In 2022, wind energy avoided an estimated 336 million metric tons of carbon dioxide emissions, equivalent to taking 72 million cars off the road for a year. Additionally, the wind industry is a significant job creator, supporting over 120,000 jobs across all 50 states.
Regional Leaders and Future Prospects:
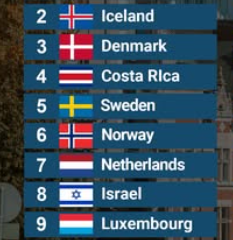
While wind power thrives across the country, certain states stand out as wind energy champions. Iowa reigns supreme, with wind providing over 60% of its electricity, followed by South Dakota, Kansas, and Oklahoma, where wind contributes over 40%. Looking ahead, the future of wind energy appears bright. Technological advancements have led to larger, more efficient turbines, while initiatives like the Inflation Reduction Act of 2022 offer valuable tax credits and support for renewable energy development.
Challenges and Opportunities:
Despite its promising outlook, wind energy faces challenges. Concerns about visual impact, wildlife impacts, and grid integration require careful consideration and mitigation strategies. Finding suitable locations for wind farms while respecting local communities and environmental concerns is crucial for sustainable development.
Wind Power: A Pillar for a Brighter Future:
Wind energy in the United States is not just a source of clean electricity; it’s a symbol of progress, innovation, and a commitment to a sustainable future. With its growing capacity, environmental benefits, and economic contributions, wind power is poised to play an even greater role in powering the nation’s homes and businesses. As we harness the power of the wind, we can pave the way for a cleaner, greener, and more energy-independent future for generations to come.
Table of Wind Capacity in United States compare to Consumption
Wind Capacity vs. Consumption in the United States
| Year | Installed Wind Capacity (GW) | Total Electricity Consumption (GW) | Wind Percentage of Consumption |
|---|---|---|---|
| 2023 (Jan) | 141.1 | 425.1 | 33.2% |
| 2022 | 135.9 | 424.4 | 32.2% |
| 2021 | 118.5 | 417.0 | 28.2% |
| 2020 | 114.8 | 412.0 | 27.9% |
| 2019 | 106.5 | 409.3 | 26.0% |
| 2018 | 95.4 | 406.2 | 23.5% |
| 2017 | 84.5 | 404.0 | 21.0% |
| 2016 | 74.5 | 400.2 | 18.6% |
| 2015 | 66.7 | 397.2 | 16.7% |
| 2014 | 63.4 | 392.7 | 16.2% |
Notes:
- Installed wind capacity data based on American Wind Energy Association (AWEA) reports.
- Total electricity consumption data based on U.S. Energy Information Administration (EIA) Annual Energy Outlook 2023.
- Wind percentage of consumption calculated by dividing wind capacity by total consumption and multiplying by 100%.
Observations:
- Wind capacity in the US has been steadily increasing over the past decade, growing by over 120% since 2014.
- While wind makes up a significant portion of electricity generation, it still only meets about one-third of total consumption.
- The continued growth of wind capacity is expected to play a crucial role in reducing the country’s reliance on fossil fuels and achieving clean energy goals.
Additional Information:
- This table only shows national averages. Wind penetration varies significantly across different states, with some states like Iowa relying heavily on wind for their electricity needs.
- The table doesn’t account for actual wind energy generation, which can vary depending on wind conditions.
- There are other renewable energy sources like solar and hydropower that also contribute to electricity generation in the US.

Top 10 Wind Farms in the United States
Top 10 Wind Farms in the United States: Harnessing the Power of Nature
The United States takes pride in its vast and diverse landscapes, and amidst it all, wind energy thrives. Towering turbines stand tall, capturing the boundless energy of the wind and converting it into clean, renewable electricity. But where are the biggest and most impressive wind farms located?
Let’s embark on a virtual tour of the top 10 wind farms in the United States:
1. Alta Wind Energy Center (California):
Nestled in the Tehachapi Pass, California, Alta holds the crown as the largest onshore wind farm in the US. Its 1,550 megawatts (MW) capacity can power over 500,000 homes, and its 4,000-acre spread boasts over 7,000 turbines, creating a mesmerizing sight against the dramatic mountain backdrop.
2. Horse Bluff Wind Farm (Texas):
Texas, the undisputed wind energy leader in the US, claims the second spot with Horse Bluff Wind Farm. This 900 MW giant sprawls across 54,000 acres in Stephens County, generating enough electricity to power over 300,000 homes.
3. Shepherds Flat Wind Farm (Oregon):
Shepherds Flat in Eastern Oregon stands tall at 845 MW. Its 338 turbines dot the rolling hills across 80,000 acres, powering about 280,000 homes and contributing significantly to Oregon’s renewable energy goals.
4. Roscoe Wind Farm (Texas):
Back in Texas, Roscoe Wind Farm takes the fourth spot with 781.5 MW capacity. Located in Nolan County, its 627 turbines generate enough clean energy to power over 260,000 homes.
5. Capricorn Ridge Wind Farm (Texas):
Texas continues its wind energy dominance with Capricorn Ridge, a 735.5 MW behemoth in Coke County. Its 315 turbines stand sentinel across 44,000 acres, powering over 245,000 homes.
6. Amazon Wind Farm Texas (Texas):
Yes, even tech giant Amazon is in the wind game! Their Amazon Wind Farm Texas boasts 735 MW capacity, spread across 52,000 acres in Kent County. The 239 turbines generate enough clean energy to power over 245,000 homes.
7. Meadow Lake Wind Farm (Kansas):
Venturing into the Midwest, we find Meadow Lake Wind Farm in Kansas. This 664 MW facility in Barton and Stafford counties utilizes 240 turbines to power over 220,000 homes.
8. Pioneer Trail Wind Farm (Iowa):
Iowa, the wind energy leader per capita, makes its debut on the list with Pioneer Trail Wind Farm. Located in Tama and Grundy counties, its 630 MW capacity comes from 210 turbines, powering over 210,000 homes.
9. Avangrid Renewables West Butte Wind Farm (Kansas):
Back in Kansas, Avangrid Renewables’ West Butte Wind Farm brings 615 MW to the table. Its 159 turbines stand across 42,000 acres in Edwards and Pawnee counties, powering over 205,000 homes.
10. Rock Creek Wind Farm (Kansas):
Rounding out the top 10 is Rock Creek Wind Farm in Kansas. This 600 MW facility in Cloud and Republic counties boasts 180 turbines, generating enough clean energy to power over 200,000 homes.
Table of Top 10 Wind Farms in the United States
| Rank | Wind Farm | State | Capacity (MW) | Turbines | Homes Powered | Area (acres) |
|---|---|---|---|---|---|---|
| 1 | Alta Wind Energy Center | California | 1,550 | 7,000+ | 500,000+ | 4,000 |
| 2 | Horse Bluff Wind Farm | Texas | 900 | 300+ | 300,000+ | 54,000 |
| 3 | Shepherds Flat Wind Farm | Oregon | 845 | 338 | 280,000+ | 80,000 |
| 4 | Roscoe Wind Farm | Texas | 781.5 | 627 | 260,000+ | Nolan County |
| 5 | Capricorn Ridge Wind Farm | Texas | 735.5 | 315 | 245,000+ | Coke County |
| 6 | Amazon Wind Farm Texas | Texas | 735 | 239 | 245,000+ | Kent County |
| 7 | Meadow Lake Wind Farm | Kansas | 664 | 240 | 220,000+ | Barton & Stafford counties |
| 8 | Pioneer Trail Wind Farm | Iowa | 630 | 210 | 210,000+ | Tama & Grundy counties |
| 9 | Avangrid Renewables West Butte Wind Farm | Kansas | 615 | 159 | 205,000+ | Edwards & Pawnee counties |
| 10 | Rock Creek Wind Farm | Kansas | 600 | 180 | 200,000+ | Cloud & Republic counties |
Note:
- Homes powered are approximate and based on average US household electricity consumption.
- Area details may not be specific due to variations in project information.
These wind farms are just a glimpse into the vast and ever-growing landscape of wind energy in the United States. As technology advances and public support strengthens, these clean energy giants will continue to rise, powering our homes and businesses while safeguarding our environment for future generations.
https://www.exaputra.com/2024/01/wind-energy-lansdcape-in-united-states.html


 For those who struggle with elementary school arithmetic, Trump won the election (50%+ approval) out of more than 150 million votes cast, and now his approval rating is in the low 30s.
That’s ~30 million voters who regret their choices, out of the common American.
Add in the Tucker Carlsons of the world.
Absolutely.
It must be done, because our country is home to some hateful morons who want to see honest, hardworking, taxpaying people with brown skin deported, and their families torn apart.
It wasn’t the American way until recently, but it sure is now.
 As shown at left, the United States is loaded with people who twist the facts to their liking.

After a Slow Start on Climate, Zohran Mamdani Faces Scrutiny Over Parks Budget and Environmental Promises
Who Loses in the Trump Administration’s $1 Billion ‘Deal’ to Abandon Offshore Wind?
Minneapolis Activists Launch Hunger Strike to Protest Polluting Trash Incinerator
-
Climate Change8 months ago
Guest post: Why China is still building new coal – and when it might stop
-
Greenhouse Gases8 months ago
Guest post: Why China is still building new coal – and when it might stop
-

 Greenhouse Gases2 years ago
嘉宾来稿:满足中国增长的用电需求 光伏加储能“比新建煤电更实惠”
-
Climate Change2 years ago
Bill Discounting Climate Change in Florida’s Energy Policy Awaits DeSantis’ Approval
-

 Climate Change2 years ago
嘉宾来稿:满足中国增长的用电需求 光伏加储能“比新建煤电更实惠”
-
Climate Change Videos2 years ago
The toxic gas flares fuelling Nigeria’s climate change – BBC News
-

 Renewable Energy6 months ago
Sending Progressive Philanthropist George Soros to Prison?
-

 Carbon Footprint2 years ago
US SEC’s Climate Disclosure Rules Spur Renewed Interest in Carbon Credits