

The U.S. battery storage market achieved unprecedented growth in 2024, fueled by the need for renewable energy integration and improved grid stability. With nearly 9.2 gigawatts (GW) of new capacity installed in late November, the year surpassed previous records, per S&P Global data. This highlights the sector’s rapid expansion and future potential.
Power Surge: How Battery Storage Is Transforming the U.S. Grid
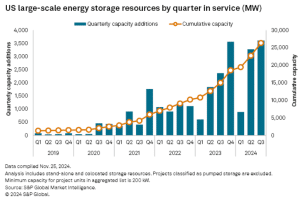
Large-scale lithium-ion battery storage installations in the U.S. reached new heights in 2024, surpassing the previous year’s record of 8.4 GW, according to S&P Global data.
By November 25, developers had added 9.2 GW of new capacity, setting a new benchmark for the industry. The third quarter alone accounted for 3.6 GW of these additions, representing a 52.5% increase compared to the same period in 2023. This remarkable growth pushed the nation’s cumulative battery storage capacity to 26.3 GW.
Most installed battery systems are designed for 1 to 4 hours of discharge, with many directly connected to solar farms. These hybrid setups provide dual benefits:
- Renewable energy generation, and
- Storage for use during peak demand periods or when solar production wanes.
Among the major projects completed in 2024, Quinbrook Infrastructure Partners’ Gemini Solar Plus Storage Project in Nevada stands out. This massive facility, which became fully operational in July, combines a 690-MW solar farm with a 380-MW/1,416-MWh battery system. It delivers power under a 25-year agreement with NV Energy, supporting grid reliability and renewable energy adoption.
Charging the Future with Expanding Battery Projects Pipeline
The pipeline for future battery storage projects in the U.S. remains robust, reflecting sustained confidence in the sector. By the third quarter, developers had begun construction on 14.2 GW of new battery power capacity, with an additional 2 GW in advanced development.
Of this total, over 6.4 GW targets completion by the end of 2024, although actual commissioning timelines often extend beyond initial projections.
Looking further ahead, the U.S. battery storage market has a planned pipeline of 143 GW of non-hydro energy storage projects through 2030. This includes ambitious goals for the next few years, including:
- 43.6 GW in 2025,
- 37.3 GW in 2026, and
- 33.8 GW in 2027.
These figures highlight the industry’s rapid evolution and its critical role in the energy transition.
Battery Storage Key to 60% Carbon Reduction
Battery storage is emerging as a critical driver of the energy transition, with costs falling and adoption accelerating. Major companies are expanding their offerings to meet surging demand fueled by the rise of AI and data centers. Both of these will significantly increase energy consumption, driving substantial growth in the global battery storage market.
Electric vehicles (EVs) alone will replace millions of barrels of oil daily by 2030, intensifying the need for large-scale energy storage in the power sector.
According to the International Energy Agency (IEA), achieving net-zero emissions requires energy storage capacity to grow six-fold by 2030. This means reaching 1,500 GW by that period.
- Batteries are expected to drive 90% of this expansion, increasing 14-fold to 1,200 GW, while other technologies like pumped storage and compressed air provide support.
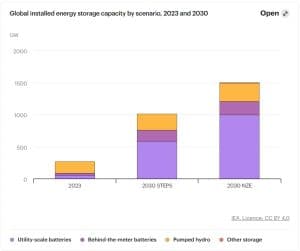
This rapid growth calls for annual battery deployment to rise by 25%. Batteries could account for 60% of carbon reductions by 2030, both directly through EVs and solar PV systems and indirectly via electrification and renewable energy integration.
As battery storage scales up, it remains essential to decarbonizing the energy sector and ensuring electricity security worldwide. In the U.S., certain states are leading the charge in battery storage development and planning.
Who is Leading the Battery Charge?
Per S&P Global analysis, California maintains its dominance with 11.9 GW of installed capacity as of November 25, most of which operates within the California Independent System Operator’s (CAISO) service area.
Texas follows with 8.1 GW of installed capacity, supported by its vast renewable energy resources and deregulated energy market. Arizona (2.1 GW) and Nevada (1.3 GW) also feature prominently, while no other state has surpassed the 1 GW threshold.
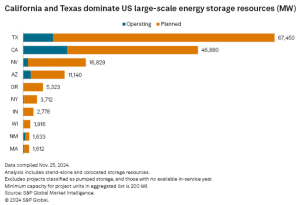
When it comes to planned projects, Texas leads with 59.3 GW of battery storage in development, far outpacing California’s 35 GW. Nevada ranks third with 15.5 GW, followed by Arizona (9.1 GW) and Oregon (5.3 GW).
This geographical distribution highlights the growing regional diversity in battery storage investments, driven by varying energy demands, renewable energy policies, and state-level incentives.
Toward a Clean Energy Future with Solar + Storage
The 2024 additions reflect a healthy mix of hybrid and standalone systems, showcasing the versatility of battery storage solutions. Of the nearly 9.2 GW added this year, around 6 GW were standalone projects, while 3.2 GW were hybrid systems, mostly colocated with solar farms.
These hybrid setups are particularly valuable for enhancing the efficiency of renewable energy projects. By combining solar generation with battery storage, hybrid facilities can store excess solar power during the day and discharge it during periods of high demand or low solar output.
This ability to smooth energy supply and demand makes hybrid systems a critical component of the grid’s transition to cleaner energy sources.
The Atrisco Solar Plus Storage Project in New Mexico is another noteworthy example of hybrid development. This facility includes a 360-MW solar farm paired with a 300-MW/1,200-MWh battery system.
The project delivers power under a 20-year agreement with the Public Service Company of New Mexico, underscoring the long-term viability and economic benefits of such projects.
The rapid growth of the U.S. battery storage market in 2024 reflects broader efforts to decarbonize the energy system. By enabling the integration of renewable energy and improving grid reliability, battery storage is becoming an indispensable tool for achieving national and state-level clean energy goals.
The post U.S. Battery Storage Hits a New Record Growth in 2024 appeared first on Carbon Credits.

Nature-based carbon investments deserve consideration when they address a specific business dependency and produce outcomes you can measure. Imagine Moonbucks, a global coffee roaster planning next season’s espresso blend. It is considering natural Grade 4 coffee from Jimma, in southwestern Oromia, Ethiopia. Its sourcing decisions affect the roasting schedule and the cash tied up in coffee purchases. Moonbucks needs to understand which measures could protect that supply, what they would cost and how it would judge the results.
1. Define the sourcing problem before choosing a project
Moonbucks needs a dependable component for its espresso blend. Its procurement team wants continuity of volume and an agreed cup profile. Replacing a shipment at short notice could require new sample approval and changes to the blend, and given the schedules for cultivation, processing, and freight delivery, is practically impossible. Moonbucks needs to get this right, and its initial concern is inconsistent deliveries. It commissions an assessment of the supplying farms and post-harvest chain. The questions cover land condition, harvest availability and whether drying or storage problems are affecting saleable lots.
This distinction changes the investment brief. A tree-planting proposal cannot be assumed to fix drying problems. Better storage cannot restore eroded land. The team must establish which problem exists before selecting the response.
CCC’s guide to finding nature-based solutions in your supply chain explains where to look. Here, the next task is to turn a broad concern into a testable proposal.
2. Develop nature-based carbon investments around the actual supply chain
The assessment would trace Moonbucks’ purchases back through the exporter and supplying producer groups. Which farms supply the contracted lots? Who controls land-management decisions? How long does the buyer expect to maintain the purchasing relationship?
Furthermore, Jimma natural Grade 4 cannot be treated as interchangeable with every Ethiopian coffee. Moonbucks would need to test any substitute against its own blend and quality requirements.
Suppose Moonbucks’ assessment identifies an opportunity to maintain shade trees and restore vegetation along exposed streambanks. The IPCC describes agroforestry as a way to store carbon in vegetation and soil, with potential benefits for erosion control and water quality.1 Moonbucks would need local advice on species, growing conditions and maintenance before deciding how these measures fit its sourcing plan.
The proposal now has a defined sourcing connection and a candidate intervention. The next steps are to test its effect on production, assess carbon eligibility and build the financial case.
3. Compare the proposal with other ways to protect supply
WBCSD’s Nature-based Solutions Blueprint recommends comparing nature-based options with other responses across their benefits and costs.2 For Moonbucks, that means evaluating the landscape proposal alongside drying improvements, storage controls and alternative sourcing arrangements.
The product’s natural-process designation matters. Moonbucks should examine the drying and dry-milling chain alongside land conditions. Its team would check storage practices, contamination risks and incoming-lot quality to see whether problems arise before or after the coffee leaves the farms.
The revised proposal might combine land stewardship with separate post-harvest controls. Each component needs its own purpose and budget. A sustainability label should not obscure which activity is expected to solve which problem.
The project develops as the evidence improves. Its scope should follow the diagnosis rather than preserve the first idea unchanged.
4. Establish what the carbon outcome could count toward
Moonbucks’ sustainability team now tests the proposed carbon case separately from the sourcing case. Is the objective a measurable change in Moonbucks’ value-chain emissions, verified credits for separate voluntary use, or distinct outcomes under carefully defined arrangements?
Scope 3 covers value-chain emissions. A purchasing relationship alone does not prove that a farm intervention can be included in Moonbucks’ inventory. The team needs an applicable accounting method, defensible boundaries and evidence supporting attribution.
SBTi’s FLAG Guidance (forest, land and agriculture), version 1.2, says purchased credits used as offsets cannot meet near-term FLAG or energy and industry targets. Eligible land-based removals are subject to accounting requirements.3 Moonbucks needs to test its proposal against those rules before including an outcome in its targets.
For Moonbucks’ Jimma proposal, maintaining existing trees and establishing new vegetation could involve different carbon questions. Specialists must examine the baseline and additionality, meaning what changes because the project proceeds. They must also assess measurement and the risk that stored carbon is lost. CCC’s MRV and additionality article introduces those tests.
Until that work is complete, Moonbucks should not budget an assumed Scope 3 reduction or credit-sale receipt. Direct emissions reductions remain the priority.
5. Build a financial case that survives weaker assumptions
Moonbucks’ finance team would now build a multi-year budget. UNEP’s State of Finance for Nature 2023 compares current finance with the investment needed to meet climate, biodiversity and land-restoration goals.4 The company would cost its proposed activities, farmer participation and ongoing monitoring. Verification, where required, is a separate expense. Maintenance and responsibility for replacing failed plantings must remain visible after the initial establishment budget ends.
Operational benefits need equally careful treatment. If fewer rejected lots reduce emergency purchasing, count that saving once. Do not add “supply resilience” as another financial benefit when it represents the same avoided cost.
Moonbucks should compare a base case with slower benefits, higher implementation costs and no carbon revenue. It should also distinguish production outcomes from quality and shipment outcomes. A single good harvest would not prove that the landscape intervention caused better delivery performance.
A project can remain worth funding even when its carbon case needs more work. That decision must rest on the operational evidence and the company’s objectives, without unsupported environmental claims.
6. Fund a pilot with a clear expansion decision
Moonbucks’ first approval would fund a bounded pilot, rather than commit the entire sourcing program. Before spending, Moonbucks would agree on participating farms, responsibilities and the evidence needed at review.
Its scorecard could track farmer participation, implementation costs and plant survival, alongside accepted coffee volumes and lot-quality results. Carbon measurements would follow the selected method. Farm-level traceability must connect the intervention to the actual sourcing relationship.
Suppose Moonbucks’ review later finds that storage changes explain most quality improvements, while the land measures need longer observation. Those findings would shape the next decision: expand the proven component, adjust the landscape work or pause further spending. They would not justify crediting all improvements to tree planting.
This gives nature-based carbon investments a practical place in a multi-year strategy. Funding increases as the evidence supports it, and the project can change direction before a larger commitment.
Discuss a sourcing opportunity with CCC
Carbon Credit Capital’s nature-based supply-chain investment service uses its Dual-Value Model to examine supply-chain economics alongside potential sustainability outcomes.
Schedule a consultation to discuss your sourcing exposure and the questions to resolve before allocating capital.
Sources
- Intergovernmental Panel on Climate Change (IPCC), Climate Change 2022: Mitigation of Climate Change, Chapter 7, Agriculture, Forestry and Other Land Uses, section 7.4.3.3 (Agroforestry).
- World Business Council for Sustainable Development (WBCSD), Nature-based Solutions Blueprint, 5 June 2024.
- Science Based Targets initiative (SBTi), Forest, Land and Agriculture Science-Based Target-Setting Guidance, version 1.2, March 2026, section 3.1.4, pp. 37–38.
- United Nations Environment Programme (UNEP), State of Finance for Nature 2023, 2023.
A plastic credit funds the collection of plastic waste in places where no formal system exists to collect it. Each credit represents a measured, independently audited quantity of plastic taken out of the environment or returned to use, tracked on a public registry.

EU carbon credit claims changed on 27 September 2026, the day the Directive (EU) 2024/825 began to apply across the European Union. The change is narrow. It changes how a company can talk about the credits it buys. A product can no longer be called neutral on the strength of compensation alone; however, every specific, evidenced statement about what a company measured, reduced, and funded stays fully available.




-
Climate Change1 year ago
Guest post: Why China is still building new coal – and when it might stop
-

 Greenhouse Gases2 years ago
嘉宾来稿:满足中国增长的用电需求 光伏加储能“比新建煤电更实惠”
-
Greenhouse Gases1 year ago
Guest post: Why China is still building new coal – and when it might stop
-

 Climate Change2 years ago
嘉宾来稿:满足中国增长的用电需求 光伏加储能“比新建煤电更实惠”
-

 Renewable Energy1 year ago
Sending Progressive Philanthropist George Soros to Prison?
-
Greenhouse Gases1 year ago
嘉宾来稿:探究火山喷发如何影响气候预测
-

 Climate Change2 years ago
Analysis: China’s CO2 falls 1% in Q2 2024 in first quarterly drop since Covid-19
-

 Climate Change1 year ago
嘉宾来稿:探究火山喷发如何影响气候预测