
The “wealthiest 10%” of people on the planet are “responsible” for 65% of the 0.61C increase in global average temperatures over 1990-2020, according to new research.
The study, published in Nature Climate Change, uses a field of climate science called “attribution” to determine the contribution of the world’s “wealthiest population groups” to climate change through the greenhouse gases they emit.
The authors also calculate the contribution of these high-income groups to the increasing frequency of heatwaves and droughts.
For example, the study finds the wealthiest 10% of people – defined as those who earn at least €42,980 (£36,605) per year – contributed seven times more to the rise in monthly heat extremes around the world than the global average.
In another finding, the Amazon rainforest faced a threefold increase in the likelihood of droughts over the period studied, most of which was driven by the wealthiest 10% of the world’s population.
The authors also explore country-level emissions, finding that from the wealthiest 10% in the US produced the emissions that caused a doubling in heat extremes across “vulnerable regions” globally.
One scientist not involved in the study tells Carbon Brief that efforts to attribute global warming to individual income groups is an “important step towards targeted policies” and could support climate litigation.
Emissions inequality
Humans emit more than 40bn tonnes of CO2 into the atmosphere every year. Developed countries are responsible for the majority of global emissions, as a result of the typically more carbon-intensive lifestyles of their residents.
Meanwhile, the most severe impacts of climate change are disproportionately felt by the poorest and most vulnerable people.
The new study uses an income and wealth inequality dataset from the World Inequality Database to track inequality over 1990-2019, showing how much the world’s wealthiest 10%, 1% and 0.1% of society have contributed to warming over 1990-2020. (For details on the method, see the modelling inequalities section below.)
The world’s wealthiest 10% all earn more than €42,980 (£36,605) per year, according to the database. Meanwhile, the world’s wealthiest 0.1% earn more than €537,770 (£458,011) per year.
Of the 0.61C increase in global average temperatures over 1990-2020, the authors estimate that 65% was due to the emissions of the wealthiest 10% of people on the planet. For the wealthiest 0.1%, the estimate is 8%.
The graph below shows how much global temperatures would have risen over 1990-2020 if everyone in the world emitted as much as the world’s poorest 50% (purple), middle 40% (green), richest 10% (orange), richest 1% (blue) and richest 0.1% (pink) people. The grey bar shows how much global temperatures actually rose.
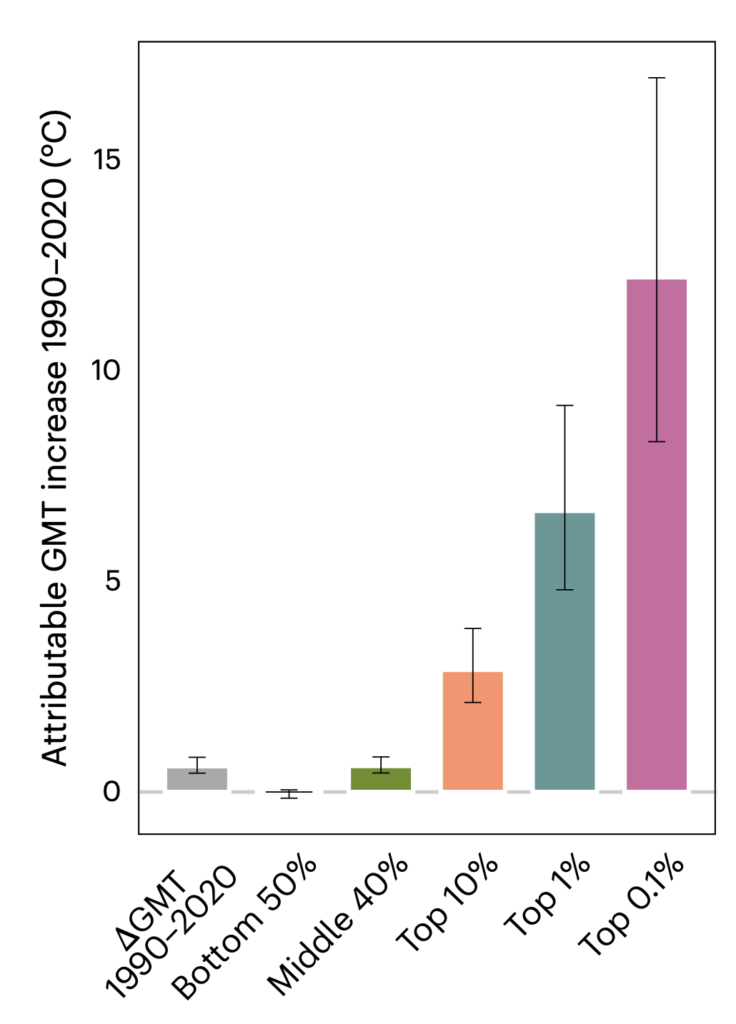
How global temperatures would have risen if everyone in the world emitted the world produced the same amount of emissions, on average, as individuals in the bottom 50% (purple), middle 40% (green), top 10% (orange), top 1% (blue) and top 0.1% (pink) of the world’s emitters. Source: Schöngart et al (2025).
The authors find that if the whole world had emitted as much as the wealthiest 10% of people over 1990-2020, global average temperatures would have risen by 2.9C, instead of 0.61C. If the global population had emissions as large as the wealthiest 0.1%, temperatures would have risen by 12.2C.
Meanwhile, the study calculates that if the whole world had emissions as low as the poorest 50%, global temperatures would have remained close to 1990 levels.
Hot and dry extremes
As greenhouse gas emissions cause the climate to warm, extreme weather events such as heatwaves and droughts are becoming more intense, frequent and long-lasting.
The authors use attribution – a field of climate science that aims to identify the “fingerprint” of global warming on these events – to determine the contribution of the emissions of the world’s wealthiest people to the increasing frequency of heatwaves and droughts.
The authors assess “extremely hot” and “extremely dry” months, defined as the most extreme 1% of months in a pre-industrial climate during the hottest month of the year regionally. (In a pre-industrial climate, only one of each extreme would be expected every 100 years on average.)
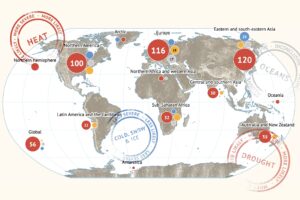
The graphs below show the number of additional heatwaves (left) and droughts (right) that have occurred since 1990 due to climate change in different regions of the world.
The full bar shows the total number of additional heatwaves due to human-cased climate change in each region. The green bar shows additional occurrences due to the wealthiest 1%. The green and orange bars combined show the wealthiest 10%.
The numbers in green and orange show how much the wealthiest 1% and 10% of the planet contributed to the extreme, compared to the global average. (For example, an orange number of 7.0 means that the wealthiest 10% of people contributed seven times more to the extreme event than the global average.)

The study finds that an average of 11.5 additional heat events observed in August – the month where the rise in heat extremes is, on average, most pronounced – are attributable to the wealthiest 10%.
It also calculates that emissions from this group resulted in, on average, an additional 2.3 droughts in the Amazon in October – the month with the strongest attributable drying trend in the region.
Highest emitters
The authors also assess the contributions of the wealthiest people to climate extremes on a country level, identifying the US, the EU, China and India as the world’s four highest emitting regions.
The graphic below shows the increase in frequency of one-in-100 year peak summer heat extremes in selected regions attributable to the wealthiest 10% of people (left) and 1% of people (right) in China (red), the US (pink), the EU (peach) and India (blue).
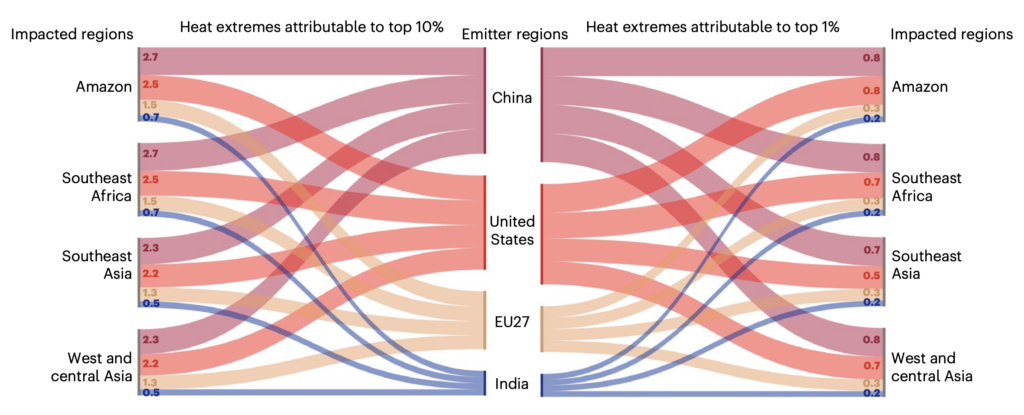
Emissions from the wealthiest 10% in the US resulted in an average of 1.3 extra heat events globally, the authors find. However, this increase is distributed unevenly across the globe.
For example, the authors find this income group was responsible for the emissions that contributed to 2.7 additional heat events in “heat-affected areas” such as the Amazon and south-east Africa.
Emissions from the wealthiest 10% of people in the EU resulted in an additional 1.5 heatwaves in both the Amazon and south-east Africa.
Meanwhile, the Amazon faces 2.1 more heat extremes in 2020 than in 1990 due to the emissions of the richest 1% in the US, China, EU and India.
While inequalities between one country or region and another are well documented, it should also be noted that “inequalities within developing countries are increasing”, Dr Carl Schleussner, study author and leader of the integrated climate impacts research group at the International Institute for Applied Systems Analysis (IIASA), tells Carbon Brief.
For example, he notes that the paper shows “very high levels” of emissions from “the Chinese middle and upper classes”.
However, he says that many existing global frameworks to address climate change “treat countries as a whole” and fail to “differentiate” between income groups within countries.
Schleussner argues that the study highlights the need for “progressive policies” for climate action, which involve “tackling particularly high emitters” in all countries.
Dr Sarah Schöngart, a researcher at ETH Zurich and lead author of the study, tells Carbon Brief that studies such as this could provide important evidence in loss and damage litigation.
Prof Jakob Zscheischler, an Earth system scientist at the Helmholtz Centre for Environmental Research who was not involved in the study, also highlights the ways the findings could be used in climate-change lawsuits. He tells Carbon Brief:
“Quantifying the contribution of individual income groups to global warming and changes in climate extremes is an important step towards targeted policies and further supports climate litigation. Supporting climate injustice with concrete numbers will hopefully help the most vulnerable and least responsible strengthen their case.”
Modelling inequalities
The study uses a range of methods to attribute changes in heat and drought to the emissions of particular wealth groups. To model global greenhouse gas emissions by wealth group, the paper uses a “wealth-based carbon inequality assessment” from a 2022 study.
(See Carbon Brief’s coverage of the 2022 study.)
The study uses income and wealth inequality dataset from the World Inequality Database to track inequality over 1990-2019. It combines economic data with information on per-capita carbon footprints – calculated using “input-output” methodologies combined with data from the “distributional national accounts” project.”
The model considers three factors. The first is private consumption – made up of emissions from the direct use of fossil fuels and emissions embedded into goods and services. The second includes emissions from government spending in that person’s country – such as government administration, public roads or defence. The final component of a person’s carbon footprint is from their investments.
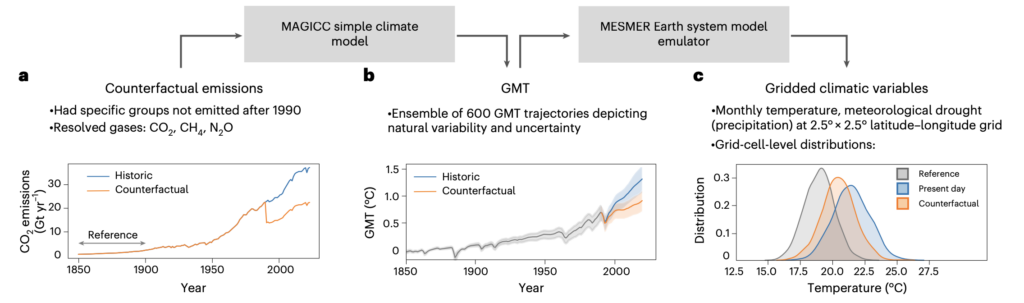
The authors then created a series of “counterfactual” emissions pathways, which imagine the world without the emissions of the wealthiest 10%, 1% and 0.1% of society, respectively. The emissions pathways include CO2, methane and nitrous oxide emissions, expressed as CO2-equivalent.
Lead author Schöngart tells Carbon Brief that including methane in the models is important, because it has “really high potency and near-term warming”. However, she notes that the team needed to make some assumptions about methane emissions – for example, assuming that each income group emits the same relative amount of methane compared to other greenhouse gas emissions.
Using a “simple” climate model called MAGICC, the authors model global average temperatures under these counterfactual emissions pathways. This allows them to calculate how much the planet would have warmed over 1990-2020 without the emissions of the 10%, 1% and 0.1% of society, respectively.
The authors use the global average temperature trends to produce temperature and rainfall data for every land-based grid square on Earth via a climate model emulator called MESMER.
Schöngart tells Carbon Brief that an emulator is “an approximation of an Earth system model” which “allows us to generate incredible amounts of data”, while using less computing power and taking less time to run.
The study authors then use attribution methods to identify how the emissions from the world’s wealthiest members of society have affected the frequency of heatwaves and droughts, by comparing the world as it is to a “counterfactual” world without human-caused climate change.
The graphic below shows these steps.
Earth system scientist Zscheischler praises the methods in the study. He tells Carbon Brief that “the main innovation of work lies in its novel combination of relatively simple emulators that capture the most important relationships between emissions and global warming and changes in extremes”.
He adds that emulators have been evaluated in other studies and are “trustworthy for this type of delicate analysis”.
Prof Wim Thiery – an associate professor at Vrije Universiteit Brussel, who was not involved in the study – also commends the use of emulators. He tells Carbon Brief that “producing the information presented in this study with a suite of full-blown Earth system models is impossible from a computational cost and human effort perspective”.
The post Two-thirds of global warming since 1990 caused by world’s ‘wealthiest 10%’ appeared first on Carbon Brief.
Two-thirds of global warming since 1990 caused by world’s ‘wealthiest 10%’
The Pine Island glacier in West Antarctica is one of the fastest-changing glaciers in the world.
Alongside its neighbour, the Thwaites glacier, it is responsible for almost half the sea level rise caused by melting ice sheets in Antarctica.
Scientists know the West Antarctic ice sheet – which includes Thwaites and Pine Island – is retreating because of warm water eroding the ice sheet from below.
But the extent to which this process has been driven by human-caused greenhouse gas emissions, as opposed to natural variations to the Earth’s climate, remains unknown.
Our study, published in the Cryosphere, looks at how human-caused warming has contributed to the retreat of the Pine Island glacier since pre-industrial times.
The research, the first attribution study of glacier retreat on Antarctica, finds that climate change has been responsible for around 4km – roughly a fifth – of the glacier’s retreat.
The West Antarctic ice sheet
Glaciers are frozen rivers of ice and snow that move slowly over land. They are found at high elevations on mountains and on ice sheets.
There are two ice sheets on Earth – covering Antarctica and Greenland. Both were formed over millennia, as layers of snow compressed into dense ice.
Ice sheets grow and shrink depending on temperature and snowfall conditions. In the past, when global temperatures were much colder than present day, vast ice sheets also covered large areas of North America, Scandinavia and Patagonia.
Today, human-driven climate change is accelerating the retreat of ice sheets. This is contributing to sea level rise and altering the Earth’s climate system by pumping vast quantities of fresh melt water into the ocean.
Our research looks at the Pine Island glacier, which is found on the western part of the Antarctic ice sheet.
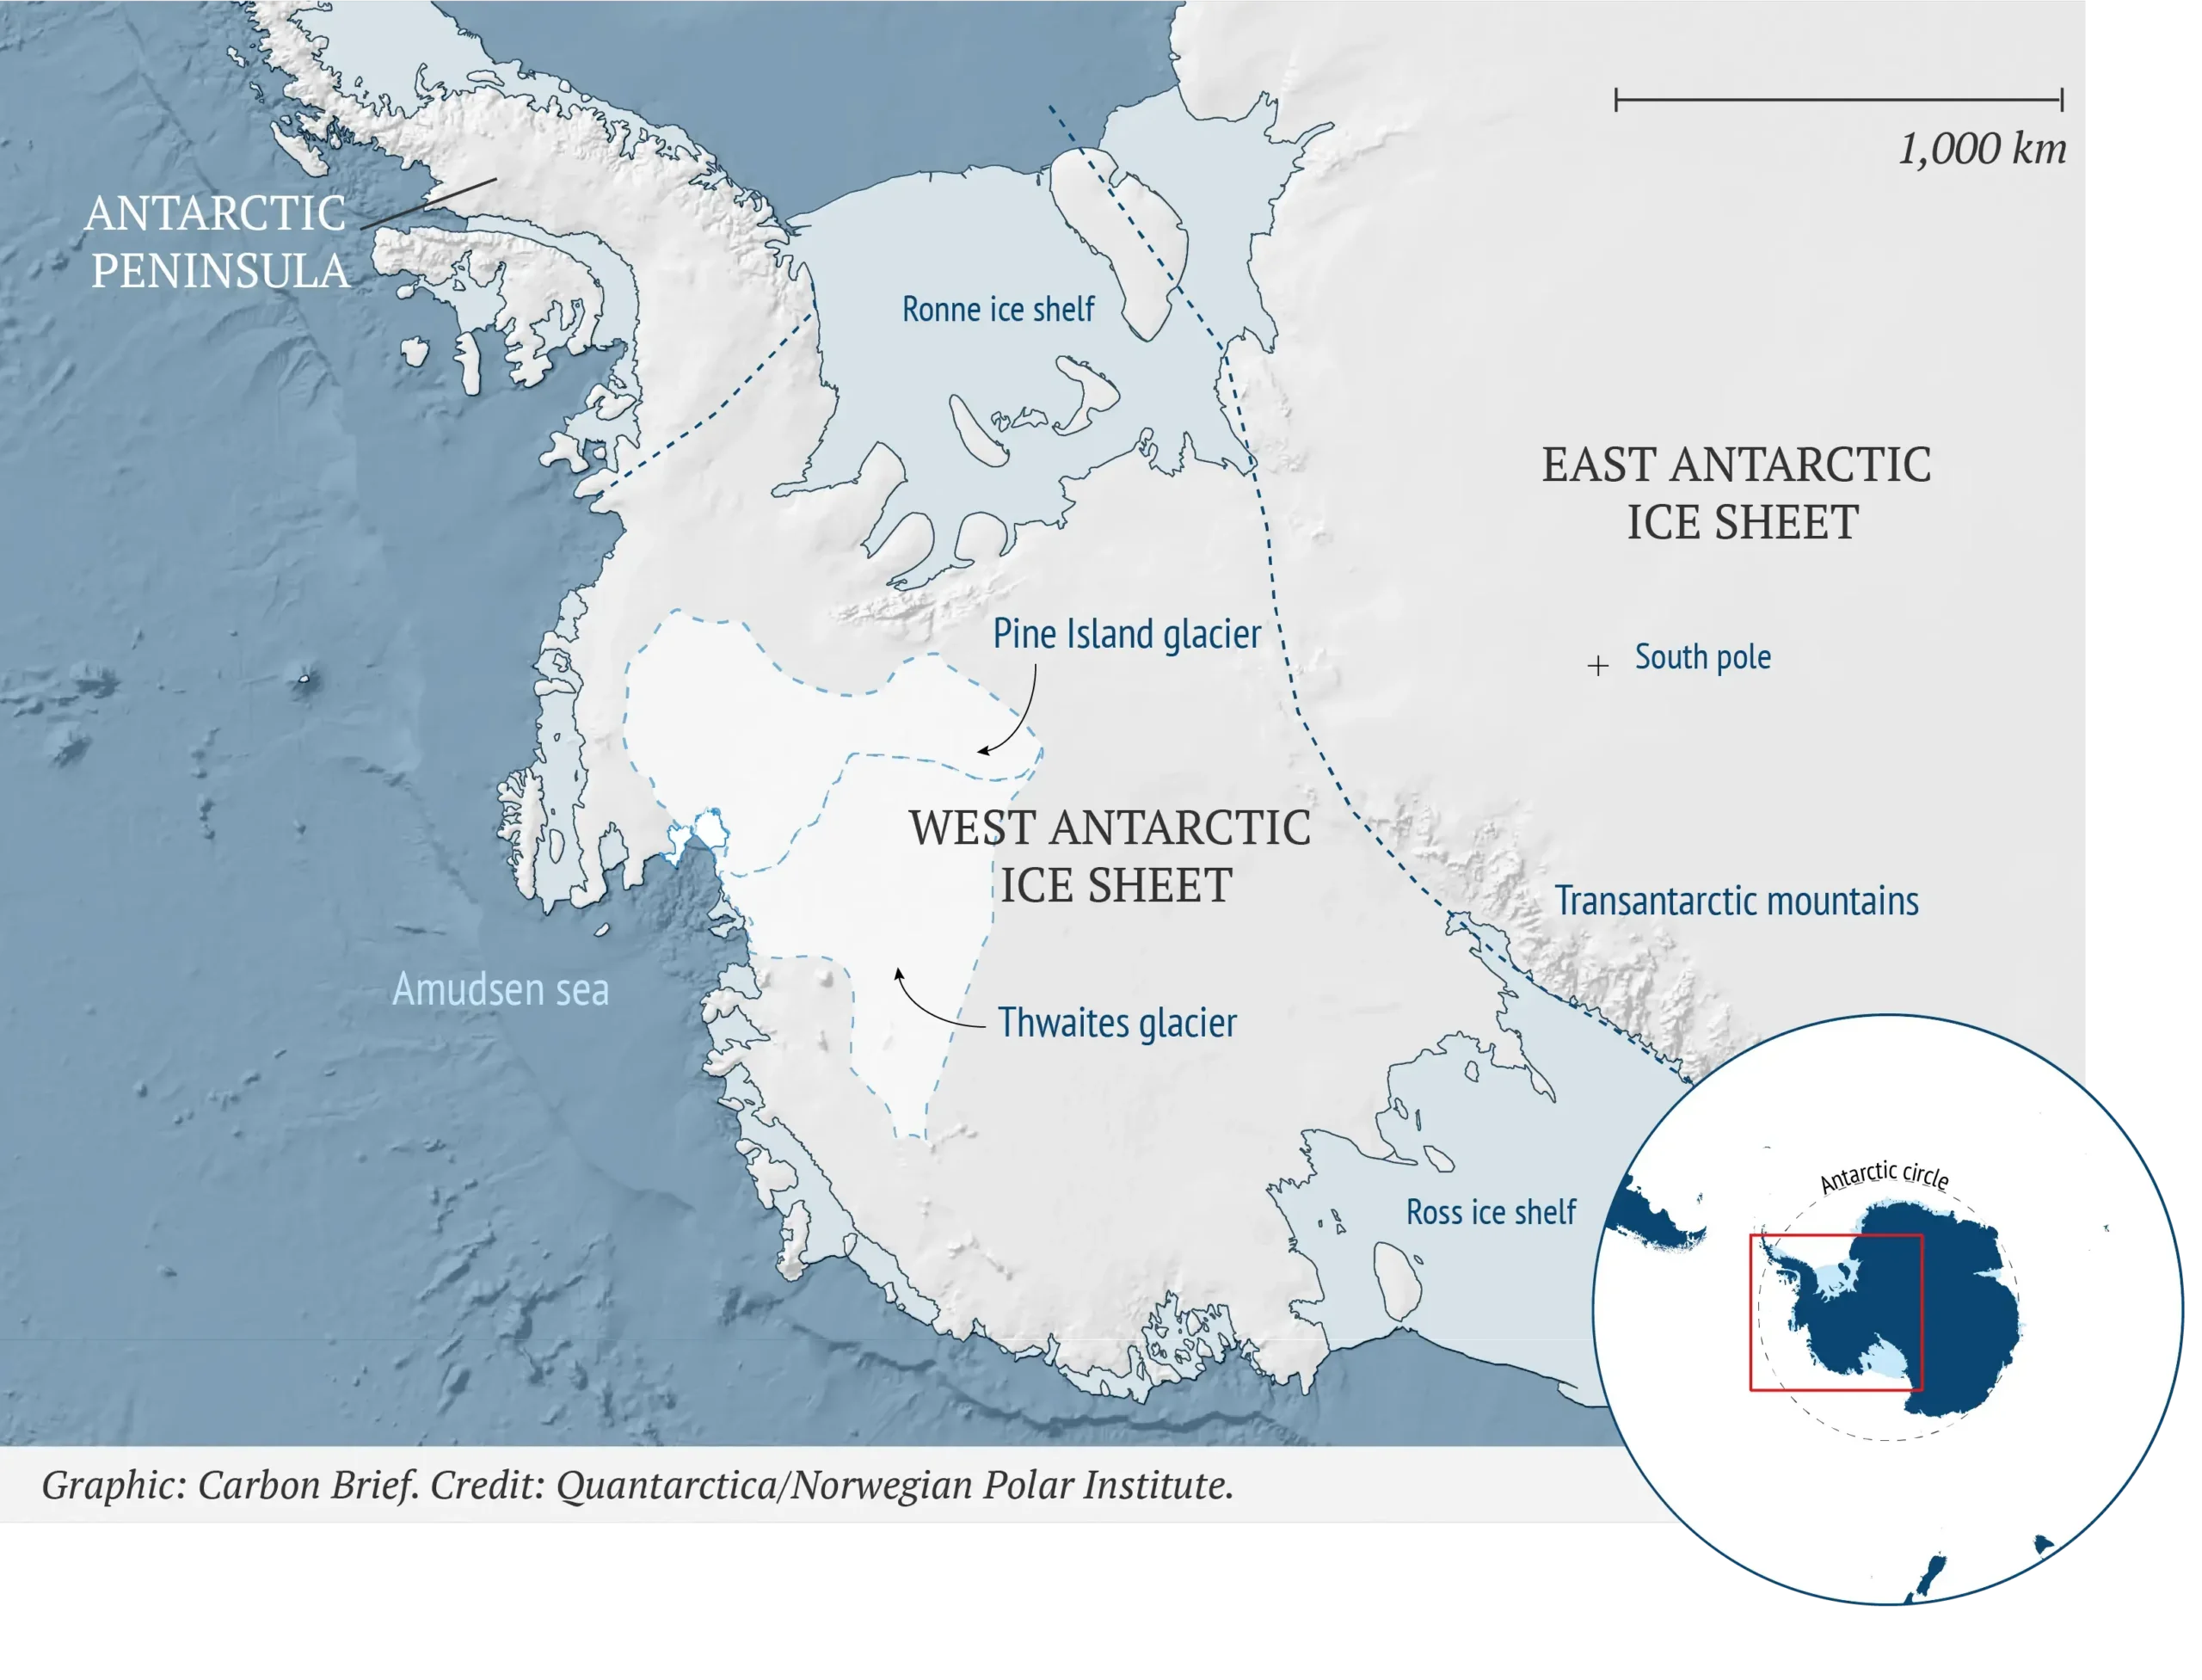
It is one of the fastest-melting glaciers in the world. Research has shown it has been responsible for a fifth of net ice loss from the West Antarctic ice sheet, which, in turn, has been responsible for almost all ice loss in Antarctica over the past 40 years.
At the coldest point of the last ice age – the “last glacial maximum” period around 20,000 years ago – the West Antarctic ice sheet was much bigger than it is today. Since then, it has retreated by approximately 500km – roughly the distance from Paris to London.
Most of this retreat took place between 10,000 and 20,000 years ago. For the past 10,000 years or so, the ice sheet has been about as big as it is today.
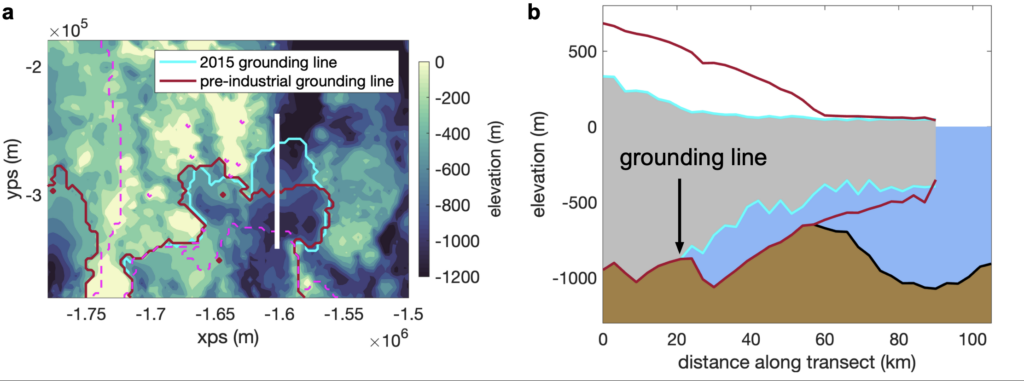
Sediment records beneath the Pine Island glacier reveal that, for hundreds of years until the 1940s, the glacier rested on a seabed ridge that is about 30km ahead of where it sits today.
The sediment records also tell us that the Pine Island glacier started to retreat in the 1940s. This coincided with a strong El Niño event, a recurring climate pattern in the tropical Pacific that drives up global temperatures, that brought a large pulse of warm water to the ice sheet.
This is illustrated in the figures below, which shows how the grounding line – the boundary between grounded and floating ice – of the Pine Island glacier shifted between pre-industrial times (red line) and 2015 (bright blue line).
The map on the left shows an aerial view of grounding line retreat from pre-industrial times (red) to 2015 (blue). The graphic on the right illustrates how the grounding line has shifted across a cross-section of the glacier.
Both illustrate how the glacier has contracted.
Climate reconstructions suggest that human-caused climate change only started to increase the amount of warm water reaching the West Antarctic ice sheet in the 1960s.
This indicates that climate change started to affect the melt rate in the region 20 years after the retreat had already been initiated.
In our research, we wanted to find out how important climate change was to the overall retreat since the 1940s.
Attributing ice sheet retreat
Currently, scientists do not know precisely how much of the retreat of the world’s ice sheets – and the associated sea level rise – is due to human-caused global warming.
Through the field of attribution science, the links between climate change and extreme weather and climate events, including heatwaves, wildfires and droughts, are routinely quantified by scientists.
In attribution studies, scientists typically use climate models to simulate the severity or frequency of an event in two worlds. The first is our existing, climate-changed world and the second is a “counterfactual” world that has not been affected by human-caused warming.
By comparing the model runs, scientists can assess how much climate change influenced an event.
To create these two modelled worlds in an Antarctic context, scientists need to run historical models for at least 200 years into the past. This is because ice sheets respond very slowly to changes in the climate, with very small changes year-on-year.
This presents a challenge, given the limited information available about ice sheet change before satellite records began in the 1970s.
To build a picture of the ice sheets prior to this, scientists have to rely on a few, sparse, palaeoclimate records – including sediment records and seafloor imprints – which tell us where ice was present in the past.
Reconstructing Pine Island’s past
To reconstruct the retreat of the Pine Island glacier – and, therefore, determine the role of climate change – we used a combination of physical climate models and machine learning.
First, we ran many simulations of our model under a range of different settings. This included variations in how important processes are represented, such as how the ice moves and interacts with the ocean.
Then, we compared the results of these simulations to modern satellite observations and older sediment records, allowing us to narrow down the settings that were most realistic. This gave us a set of plausible simulations that agreed with the available observational data.
However, to reconstruct the retreat in full, we needed to find all settings of our model that would agree with the observational data.
Because simulations take a lot of time to run, this was not possible.
Therefore, to fill the gaps and find all plausible simulations, we used machine learning to identify relationships between model settings and simulated glacier retreat.
This exercise allowed us to build a good picture of how the glacier actually retreated over the past 250 years. We call this our “reconstructed” scenario.
We then compared the glacier retreat in this reconstructed world with changes that took place in a counterfactual scenario where there had been no human-caused climate change.
In doing so, we were able to quantify the role that warming played in the shrinking of the Pine Island glacier since the 1940s.
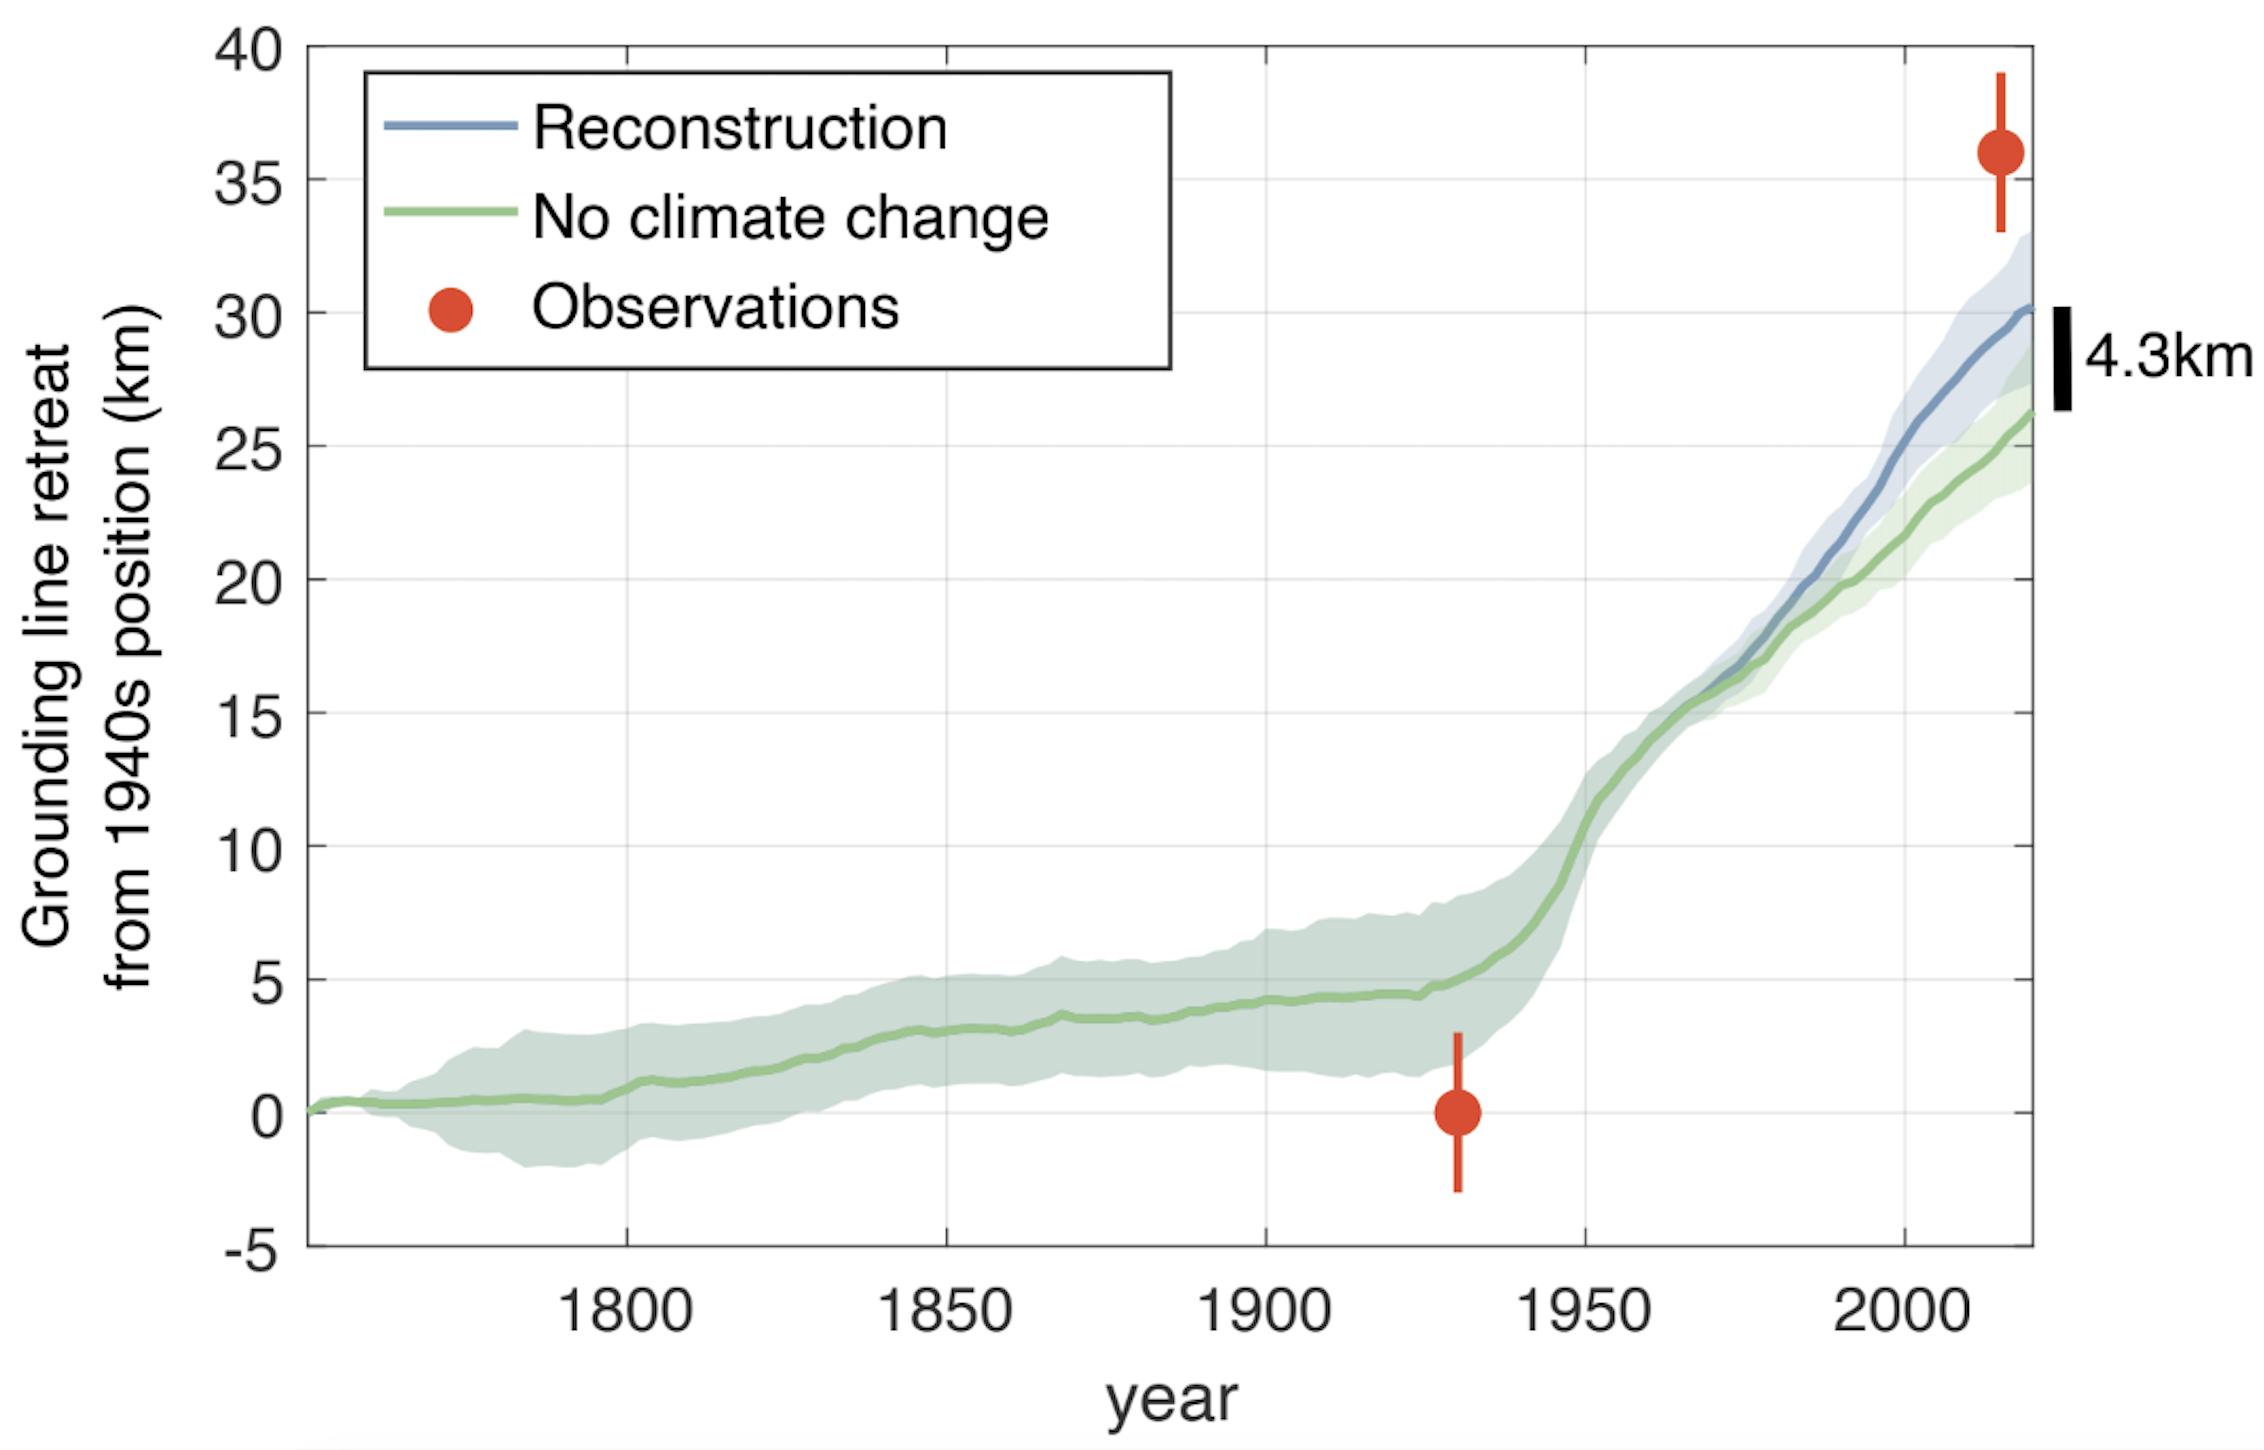
Overall, we estimate that warming has been responsible for around 4km – roughly a fifth – of the glacier’s retreat since 1940.
This is shown in the figure below, which shows how grounding line retreat in the reconstructed scenario (blue) is more extreme than projected by the counterfactual scenario (green).
Interpreting the numbers
Our work quantifies, for the first time, the role of climate change in the retreat of a glacier in the world’s ice sheets – directly linking greenhouse gas emissions with glacier decline.
We also find that the Pine Island glacier may have retreated even without climate change, just not as far. This is similar to how extreme weather events, such as drought or extreme rainfall, could still happen without climate change, just with less frequency or intensity.
One of the key challenges in our research arises from not knowing exactly how large the ice sheet was prior to satellite records.
Although the sediment records tell us where the ice was grounded – that is, what its footprint was – they do not tell us exactly how much ice there was.
This means we do not know exactly how to set up our model at the start of the simulations, which leads to uncertainty in our predictions.
Further work is underway to determine exactly how to best set up the simulations for future research.


The post Guest post: Climate change has caused one-fifth of Pine Island glacier retreat appeared first on Carbon Brief.
Guest post: Climate change has caused one-fifth of Pine Island glacier retreat
Ellen Davies is head of programmes at the African Climate Foundation and is based in Kenya. Wole Hammond is programme officer for adaptation and resilience at the foundation, based in Nigeria.
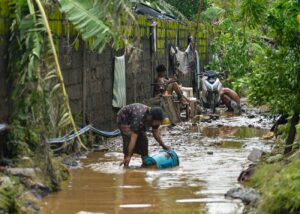
For generations, African communities have lived on the frontlines of climate disruption, managing erratic rainfall, prolonged droughts and the slow erosion of their livelihoods, which depend on predictable seasons.
When the rains failed across Southern Africa in 2024, it was but the latest chapter of a crisis already long underway. During that season, maize crop failures of 40-80% devastated farming communities in Zambia, Zimbabwe and Malawi, where roughly 70% of people depend on rain-fed agriculture. Governments already stretched by debt were forced to raid development budgets, trading long-term growth for emergency relief.
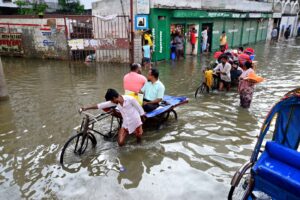
Then came the floods. In early 2026, parts of Mozambique, Zimbabwe and South Africa received over a year’s worth of rain in days. More than 2 million people were affected. In East Africa, drought has displaced nearly 62,000 people in Somalia this year alone, with nearly one in four Somalis now facing acute food insecurity.
This is what climate change looks like on the ground – not parts per million or diplomatic jargon, but whether a school stays open after floods cut off the road, whether a clinic can function in extreme heat, whether a country can still invest in its future when every year brings another disaster bill.
As Nigeria rails at loss and damage “mirage”, fund boss assures money is coming
Africa as a continent contributes the least to global emissions yet bears a disproportionate share of the consequences. Nine of the ten countries most vulnerable to climate change are African. As livelihoods collapse and rural economies fail, migration pressures will intensify, driven by climate change intersecting with poverty, conflict and constrained opportunity.
Chronic under-funding
Europe is only now beginning to experience, in more limited form, what African communities have navigated for decades with far less fiscal space, thinner insurance coverage and fewer resources for recovery. With El Niño conditions confirmed and a “super” version of the naturally occurring weather pattern possible later this year, the pressure is set to intensify further.
In Africa, climate action is fundamentally a development challenge where adaptation and mitigation must go hand in hand. Building a solar grid and flood-proofing the road that serves it are not separate agendas. Yet for too long, the global climate conversation has prioritised mitigation while leaving adaptation – the work of protecting lives, livelihoods and economies in a changing climate – chronically under-funded.
The result is three compounding gaps. A visibility gap: much of Africa’s adaptation work remains under-documented and under-recognised in global climate narratives. A financing gap: capital does not flow at the scale or speed required to the people and institutions best placed to use it. And a decision-making gap: too many solutions are still designed elsewhere and imported into African contexts, rather than backing African-led platforms to scale what is already working.
Live from LCAW – Raw diplomacy: Can new mineral alliances deliver a just energy transition?
Solutions ready for finance
The solutions exist. Rwanda’s green investment fund has mobilised climate finance at national scale through its own systems. Egypt’s Nexus of Water, Food and Energy programme has shown how integrated planning can stretch limited resources across interdependent systems.
Zambia’s Presidential Irrigation Initiative is building climate-resilient food production from the ground up. In Pata, Senegal, a solar irrigation project has unlocked agricultural production and created jobs, demonstrating how integrated investments in water, energy and livelihoods can deliver resilience and development gains simultaneously.
In South Africa, the African Climate Foundation’s work with the South African Local Government Association (SALGA) is supporting district municipalities to assess their climate risks and develop fit-for-purpose Climate Action Plans, building adaptation capacity where it is needed most – at the local level.
These are not pilot projects waiting to be validated. They are working systems waiting for investment.
Closing the gaps requires a decisive shift in posture from global finance, philanthropy and development institutions. It means backing country-led platforms that can prepare, aggregate and finance adaptation projects. It means investing in place-based initiatives grounded in local knowledge.
French court rules Total must revise climate plan to account for all emissions
It means fostering intra- and inter-continental collaboration, so that lessons from Kigali inform decisions in Nairobi and innovations in Lagos reach communities in Dakar. And it means treating adaptation as core economic infrastructure, not charitable relief.
Invest now for future gains
The economic case is clear. Every dollar invested in climate adaptation returns an estimated four dollars in benefits on average – and up to five in the poorest economies. Under-investment in African adaptation is as economically irrational as it is morally unjust.
The world depends on Africa’s food systems, its young workforce – the majority of the continent’s population is under 25 – and its minerals. Several African countries supply a substantial share of the copper, cobalt and other critical materials underpinning the global clean energy transition.
Drought in Zambia has already shown how climate stress can disrupt hydropower, electricity supply and mining output. A transition that depends on African minerals cannot afford to ignore African climate resilience.
The world can continue to under-fund adaptation and pay repeatedly for emergencies, instability and lost development. Or it can invest now in the people, institutions and systems already doing the work on the ground in Africa, not in solutions imported from elsewhere.
Africa has the agency, the knowledge and the platforms. What it needs is the finance to match. A super El Niño will not wait for consensus to form. Neither, frankly, should we.
The post Climate adaptation in Africa needs investment, not imported solutions appeared first on Climate Home News.
Climate adaptation in Africa needs investment, not imported solutions
Climate Change
DeBriefed 26 June 2026: Heat records broken across Europe | London climate action week | Introducing ‘Project Cosmos’
Welcome to Carbon Brief’s DeBriefed.
An essential guide to the week’s key developments relating to climate change.
This week
Record Europe heat
HOTTEST EVER: The UK broke its temperature record for June twice this week, while France recorded its hottest day ever two days in a row, reported the Guardian. The Times reported that temperatures reached 36.7C in Somerset on Thursday, as the “London Ambulance Service had its busiest-ever day for life-threatening emergencies”.
FRANCE FRYING: French newspaper Libération said that temperatures reached as high as 44.3C in the south-western commune of Pissos on Wednesday. Spain also recorded its highest daily average temperature for June, said BBC News. On Thursday, Switzerland also had its hottest June day, when temperatures reached 37C in four locations, reported SwissInfo.
CLIMATE LINK: CNN covered a rapid analysis from the World Weather Attribution service finding that fossil-fuelled climate change has made this heatwave the most severe and widespread in Europe’s history. Carbon Brief covered the broken heat records, explaining the influence of climate change.
‘Electrifying’ London talks
‘LONDON COOKING’: In a sweltering, packed-out event at London climate action week, UN chief António Guterres quipped that “London is not just calling, it’s cooking”, reported Edie. Guterres also used his address to release a “global call to action on methane” and to call on artificial intelligence companies to reveal their environmental impact and source their power solely from renewables by 2030, said the publication.
‘ELECTRIFY NOW’: Elsewhere, dozens of governments, led by the EU and the UK, committed to throwing “their political weight” behind a rapid electrification of the world’s economy, according to Climate Home News. A high-level summit in London’s Mansion House saw energy ministers and business leaders, joined by Guterres, in “calling for faster action to curb demand for oil, coal and gas by powering homes, industry and transport with clean electricity”.
FOSSIL TRANSITION: At the same event, ministers from Colombia and the Netherlands, the co-hosts of the world’s first summit on transitioning away from fossil fuels in April, unveiled a report on their key takeaways. It comes after the current Colombian government has been ousted by a presidential election defeat to a fossil-fuel-supporting Trump ally. Carbon Brief examined what this could mean for the world’s energy transition.
Around the world
- UK TARGET: The UK parliament has approved its “seventh carbon budget”, aimed at cutting emissions 87% below 1990 levels by 2040.
- TOTAL ACCOUNTABILITY: A French court has ordered oil-and-gas giant TotalEnergies to account for the emissions from the use of its products, following a case brought by a climate NGO, reported Le Monde.
- METHANE RULES: The US, Qatar and other major energy exporters have urged the EU to “rewrite planned methane emissions” rules for oil-and-gas imports, saying that the policy could disrupt fuel supplies to Europe, according to Reuters.
- CHINA MESSAGE: China’s special envoy for climate change, Liu Zhenmin, said at the World Economic Forum that energy shortages triggered by the Iran war should be a “lesson to countries to accelerate their energy transitions”, reported Bloomberg.
- US WEBSITE REVIVED: Former US government workers have “recreated a valuable climate-science website” shut down by the Trump administration last year, said the New York Times.
6,600 animals
The number of livestock that perished in transport during heat in England and Wales from June to August 2025, double the number killed the year before, reported Carbon Brief.
Latest climate research
- Some world regions are experiencing up to 50 additional heat stress days annually, when compared to 1950 | Nature Climate Change
- Projections of national land-use emissions to 2100 suggest the strongest “carbon sinks” will be in China and Indonesia, whereas Brazil and the Democratic Republic of the Congo will “dominate global sources” | Nature
- Most carbon-offset projects relying on “avoided deforestation” have “mixed, negligible or negative impacts relative to control areas” | Nature Climate Change
(For more, see Carbon Brief’s in-depth daily summaries of the top climate news stories on Monday, Tuesday, Wednesday, Thursday and Friday.)
Captured
The UK government’s official climate advisers, the Climate Change Committee (CCC), has released its latest progress report, emphasising that faster electrification is the best way to secure lower energy bills and stronger energy security. Electrification has shot up the agenda in recent months, with the COP31 presidency calling for countries to back a global goal for 35% of “final” energy to come from electricity by 2035. The text of the CCC’s latest report uses the word “electrification” far more often than previous editions, as shown in the figure above. See Carbon Brief’s in-depth breakdown of the CCC’s latest advice.
Spotlight
Introducing ‘Project Cosmos’
Carbon Brief explains how it built a major new database of climate science research and unveils a new ranking of the 500 most highly cited publications, authors and institutions in climate science.
This week, Carbon Brief launched Project Cosmos – the world’s largest and most complete database of climate change research.
The database features more than 1.8m academic papers, books and reports, capturing the vast body of human knowledge about climate change that has accumulated over more than a century of academic study.
The climate science “universe” is based on reports from the Intergovernmental Panel on Climate Change (IPCC), which are recognised as the world’s most authoritative summaries of the latest climate science.
Since its first report was published in 1990, humanity’s knowledge about human-caused climate change has ballooned. The IPCC has published six sets of reports in total – each one longer than the last.
In total, IPCC reports reference more than 100,000 other papers, books and reports. This is the core of our climate science universe. Carbon Brief then built on this core, by looking at four other sources of data. Read more about how the Cosmos database was created here.

Every single publication in the Cosmos database is linked to at least one other through references. Visualising these links reveals a “galaxy” of references.
In the image above, each colour and cluster reveals different topics and densities of research. Explore the galaxy in an interactive map.
Cosmos 500
As part of an initial wave of preliminary analysis to demonstrate the scope of the Project Cosmos database, Carbon Brief has ranked the 500 most highly cited publications, authors and institutions in the database.
The most highly cited climate scientist is Prof Philippe Ciais, who has spent almost four decades researching the planet’s carbon cycle – and the ways in which humans have been impacting its balance. Carbon Brief recently interviewed Ciais in Paris.
The US tops the tables for the most highly cited authors and institutions. Almost half of the 500 most highly-cited authors are from US institutions. This raises particular concerns for the future of climate science, as US climate scientists and institutions are coming under attack under the Trump administration.
Experts from global south countries account for only 4% of all authors in the Cosmos 500. China stands out as the most highly-cited global south country. Meanwhile, only 10% of authors in the Cosmos 500 are women.
There are many possibilities for future avenues of research using the Cosmos database. Over time, the database could be used to reveal, for example, how interest in different areas of climate science has changed over time, plus identify potential knowledge gaps and, thus, opportunities for future research.
Carbon Brief invites researchers – including academics, journalists and analysts – to submit their own proposals for co-authored studies, literature reviews and analytical projects. Proposals should be sent to cosmos AT carbonbrief DOT org.
This spotlight first appeared in Cited, Carbon Brief’s new fortnightly newsletter focused on climate research. Sign up for free.
Watch, read, listen
‘DOOMSDAY CULT’: OpenDemocracy reported on a “religious cult” spreading climate misinformation in “parliaments” and at “COP summits”.
‘WEDGES’ EXAMINED: ProPublica and Drilled released an investigation into how oil executives worked to influence a climate research paper from Princeton University known as “wedges”.
‘1976 to 2056’: A 30-minute YouTube video from the Met Office had climate scientists explaining how current UK temperatures compare to the infamous 1976 heatwave, and how extremes could worsen by 2056.
Coming up
- 29-30 June: Hamburg sustainability conference, Hamburg, Germany
- 29-30 June: Seventh global conference on climate and sustainable development goals synergies, Bangkok, Thailand
- 29-30 June: 11th annual global conference on energy efficiency, Montreal, Canada
Pick of the jobs
- Drilled, series editor | Salary: $4,000 a month (six-month contract). Location: US
- Met Office, ocean climate science manager | Salary: £54,515-£58,582. Location: Exeter, UK
- Grantham Research Institute on Climate Change and the Environment, research officer (climate science and law) | Salary: £43,277-£55,497. Location: London
DeBriefed is edited by Daisy Dunne. Please send any tips or feedback to debriefed@carbonbrief.org.
This is an online version of Carbon Brief’s weekly DeBriefed email newsletter. Subscribe for free here.
The post DeBriefed 26 June 2026: Heat records broken across Europe | London climate action week | Introducing ‘Project Cosmos’ appeared first on Carbon Brief.


-
Climate Change11 months ago
Guest post: Why China is still building new coal – and when it might stop
-
Greenhouse Gases11 months ago
Guest post: Why China is still building new coal – and when it might stop
-

 Greenhouse Gases2 years ago
嘉宾来稿:满足中国增长的用电需求 光伏加储能“比新建煤电更实惠”
-

 Climate Change2 years ago
嘉宾来稿:满足中国增长的用电需求 光伏加储能“比新建煤电更实惠”
-

 Renewable Energy8 months ago
Sending Progressive Philanthropist George Soros to Prison?
-
Climate Change2 years ago
Bill Discounting Climate Change in Florida’s Energy Policy Awaits DeSantis’ Approval
-

 Carbon Footprint2 years ago
US SEC’s Climate Disclosure Rules Spur Renewed Interest in Carbon Credits
-
Greenhouse Gases12 months ago
嘉宾来稿:探究火山喷发如何影响气候预测