

What is Lithium?
Lithium, hailed as the ‘white gold‘ of modern times, is reshaping battery technology. Known for its lightweight nature, unparalleled electrochemical potential, and high energy density, lithium stands at the forefront of energy storage, driving the global transition to renewable energy. Its journey from a basic mineral to a crucial battery component highlights its pivotal role in technological advancement and sustainable energy solutions.
Amid the push for net zero emissions by 2050, lithium assumes paramount importance. The soaring demand necessitates ramped-up production, urging advancements in mining, refining, and sustainable extraction and processing technologies.
As nations and industries align towards a greener future, lithium emerges as a linchpin in driving technical innovation and sustainability efforts. But before lithium turns out to be this important, it’s interesting that this unique element has a fascinating origin story.
Humanity’s interaction with lithium spans just over 200 years. In the 1790s, Brazilian scientist José Bonefácio de Andrada e Silva discovered two new minerals, petalite and spodumene, on the Swedish island of Utö.
Later, in 1817, Swedish scientist Johan August Arfwedson identified a new element in these minerals. Working in the lab of chemist Baron Jöns Jacob Berzelius, Arfwedson isolated a sulfate that did not contain any known alkali or alkaline earth metals. He named this new element lithium, derived from the Greek word “lithos,” meaning stone, due to its grey, stone-like appearance.
Where Does Lithium Come From?
Some of the lithium found in the rechargeable batteries of our smartphones, laptops, and EVs dates back almost 14 billion years ago.
The lithium cycle begins with magma that contains lithium rising to the Earth’s crust during volcanic activity. This magma cools and crystallizes into rocks such as granites or pegmatites. Over thousands of years, weathering breaks down these rocks, releasing lithium salts that flow into rivers. Most of this dissolved lithium ends up in the oceans.
However, in some high mountainous regions like the South American Andes, rivers terminate in closed basins. Here, water evaporation leaves behind lithium-enriched brine in salt flats, known as salars.

Besides these natural deposits, lithium can also be sourced from oilfield brines, geothermal brines, and clays. Although lithium is not rare, it is highly reactive and never found in its pure form in nature. It ranks as the 33rd most abundant element in the Earth’s crust, with an estimated 98 million tonnes.
What Are The Applications and Uses of Lithium?
Lithium stands out for its extraordinary properties. It is the lightest and least dense solid element on the periodic table, with a standard atomic weight of 6.94. Highly reactive, lithium metal ignites on contact with water, a familiar demonstration in chemistry labs.
Consequently, it is only found in mineral or salt forms in nature. In its metallic form, lithium is a soft, silvery-grey metal with excellent heat and electric conductivity, making it ideal for storing and transmitting energy.
Lithium is so soft it can be cut with a knife and has one of the lowest melting points (180.5 °C) and boiling points (1,347°C) among metals. Its high electrode potential and low atomic mass provide a high charge and power-to-weight ratio, which makes lithium especially suitable for use in rechargeable batteries.
Lithium Batteries: Powering the Future
A critical element in the production of rechargeable batteries, lithium is vital for electric vehicles (EVs), hybrids, laptops, and mobile phones. Lithium-ion batteries are favored by car manufacturers for their ability to store significant energy in compact spaces and quick recharge capabilities.

Notably, lithium iron phosphate batteries are esteemed for their safety and durability, making them ideal for stationary storage and secure EV applications.
In the realm of EVs and lithium-ion batteries, two primary types of lithium, lithium carbonate, and lithium hydroxide, dominate. Major lithium producers often supply both variants to meet the demands of EV manufacturers, alongside catering to other industries requiring diverse lithium applications.
Conversely, smaller lithium companies typically specialize in the production of a single lithium type.
Diverse Applications Beyond Batteries
The versatility of lithium goes beyond battery technology, impacting various sectors that leverage its unique properties. In aerospace, lithium’s lightweight yet robust characteristics enhance fuel efficiency and performance in aircraft and spacecraft.
Incorporating lithium into glass and ceramics yields stronger, more durable products with enhanced thermal resistance, ideal for sturdier and more efficient cookware, tiles, and household items.
Furthermore, lithium compounds serve as high-temperature lubricants, enduring extreme conditions to ensure smooth operation for heavy machinery and vehicles under intense stress and temperature. This wide array of applications underscores lithium’s pivotal role, not only in driving cleaner energy solutions like electric vehicles but also in propelling manufacturing processes and product functionalities across diverse industries.
The breadth of its applications underscores global dependence on lithium for technological advancements and sustainability initiatives. But how exactly is lithium produced or mined?
How is Lithium Mined?
Various ways are available to extract lithium, but two major ones exist to produce industrial lithium.
- Conventional Lithium Brine Extraction
The majority of commercial lithium production today comes from extracting lithium from underground brine reservoirs, primarily located in the Lithium Triangle of the Andes (Bolivia, Argentina, and Chile) and in China.

Lithium brine recovery is a straightforward but time-consuming process. Salt-rich water is pumped to the surface and into evaporation ponds. Over months, water evaporates, precipitating various salts and increasing lithium concentration in the remaining brine.
During evaporation, hydrated lime (Ca(OH)2) is added to remove unwanted elements like magnesium and boron. Once lithium concentration is sufficient, the brine is pumped to a recovery facility where the following steps occur:
- Brine purification to remove contaminants.
- Chemical treatment to precipitate desirable products and byproducts.
- Filtration to remove solids.
- Treatment with soda ash (Na2CO3) to precipitate lithium carbonate (Li2CO3).
- Washing and drying of lithium carbonate to produce the final product.
2. Hard Rock Mining
Hard rock mining, more complex and energy-intensive than brine extraction, involves extracting lithium from minerals such as spodumene, lepidolite, petalite, amblygonite, and eucryptite. Spodumene is the most abundant, providing most of the world’s mineral-derived lithium.

Australia leads in spodumene production, with operations also in Brazil, Portugal, southern Africa, and China. New mines are expected in North America and Finland by 2025. The process involves:
- Mining and crushing the ore.
- Roasting at 2012°F (1100°C), cooling to 140°F (65°C), milling, and roasting again with sulfuric acid at 482°F (250°C) (acid leaching).
- During acid leaching, lithium ions replace hydrogen in the acid, forming lithium sulfate and insoluble residue.
- Adding lime to remove magnesium.
- Using soda ash to precipitate lithium carbonate.
- Lime slurry may adjust pH to neutralize excess acid.
3. New Lithium Production Methods
In the US, commercial-scale lithium production mainly comes from a brine operation in Nevada. However, there’s growing pressure to increase domestic production to secure lithium supplies.
Opportunities for new methods include:
- Direct lithium extraction from geothermal brines (e.g., Salton Sea, CA) and produced water from shale gas fracking (Texas).
- Extraction from lithium-bearing clays in Nevada.
Various production methods are being tested, including:
- Acid leaching with sulfuric and hydrochloric acid.
- Using hydrated lime to remove impurities and neutralize waste before returning it to the environment.
These innovations aim to enhance domestic lithium production and ensure a stable supply of this critical metal.
What is The Current State of the Lithium Market?
In the rapidly evolving landscape of the lithium market, competition is fierce and dynamics are swiftly changing. With the price of lithium batteries constituting 40% of an electric vehicle’s production costs, major EV manufacturers like Tesla, Ford, and BYD are actively seeking cost-effective alternatives.
As global aspirations for emission-free transportation by 2050 intensify, about 30 nations have committed to phasing out the sale of new fuel-engine cars, driving demand for critical EV minerals.
China currently leads the lithium battery production market, but the United States and latecomer South Korea are aiming to challenge its dominance. Amid this dynamic environment, understanding the nuances of lithium is crucial. The next sections explore market and price dynamics, the key players, and the outlook associated with the burgeoning lithium industry.
Asia-Pacific’s Dominance and Its Global Impact
The global lithium market has been significantly shaped by the commanding influence of the Asia-Pacific region, spearheaded by economic powerhouses such as China, Japan, and Korea. Recognizing the transformative potential of lithium, especially in battery technology, these nations swiftly invested in the industry, initially targeting consumer electronics and later expanding into EVs.
Their strategic vision included not only production and processing but also the entire lithium supply chain, from extraction to advanced battery manufacturing. This comprehensive approach has granted them considerable leverage over global battery technology trends and pricing dynamics.
In contrast, North America has struggled to keep pace with this rapid progress. Hindered by a fragmented approach and a lack of cohesive strategy and investment, the region’s lithium industry lags behind its Asia-Pacific counterparts.
This disparity has hindered the development of a robust domestic lithium market in North America. This leaves the region vulnerable to supply fluctuations and pricing determinations driven by Asia-Pacific leaders.
China’s stronghold extends beyond LFP batteries, encompassing lithium-ion battery, cathode, and anode production, as well as lithium, cobalt, and graphite processing and refining.
Despite efforts by governments in Europe, the United States, and South Korea to develop domestic battery supply chains, the majority of the EV battery supply chain is expected to remain concentrated in China for the foreseeable future, maintaining its lead in global battery production capacity until 2030, as projected by the International Energy Agency (IEA).
The Shifting Trend in Lithium Batteries
Tesla and Ford Motor, along with other major automakers, have embraced lithium iron phosphate (LFP) batteries as a cost-effective alternative for some of their EVs, moving away from cobalt-based and nickel-based lithium-ion batteries prevalent in Europe and the US. LFP batteries, identified as the most economical lithium-ion battery type in 2022, now constitute around 40% of global EV production. Demand for this battery is projected to rise substantially in the coming years.
Tesla’s shift to LFP batteries at its Shanghai plant since October 2022 signals a broader industry trend. Its peers like Mercedes-Benz Group AG, Volkswagen AG, and Rivian Automotive Inc. also commit to integrating LFPs into their vehicles.
This shift is largely facilitated by Chinese manufacturers like Contemporary Amperex Technology (CATL) and BYD, which dominate the LFP market, accounting for 99% of global LFP battery production. CATL, in particular, stands as the world’s largest EV battery maker, supplying batteries to Tesla and various other automakers.
Understanding Lithium Prices: Key Factors and Trends
The global appetite for lithium has surged, propelled by the burgeoning battery industry and the widespread adoption of lithium-ion batteries in electric vehicles (EVs). This surge in demand casts a glaring spotlight on the current state of lithium supply, underscoring the escalating consumption rates worldwide.
In this segment, we delve into the intricate dynamics of various factors driving the market, examining how the industry is responding to this mounting need. Key factors such as supply and demand dynamics, mining capacities, geopolitical influences, and technological advancements play pivotal roles in shaping the delicate balance between supply and demand.
Understanding these factors is crucial for stakeholders in the lithium industry, from miners to battery manufacturers and investors. Here are the primary elements that impact lithium prices:
Navigating the Supply-Demand Dynamics
The lithium market exhibits characteristics of an immature market. The supply swings between deficit and surplus due to strong growth and infrastructure development challenges.
With rechargeable batteries constituting around 85% of global demand, the surge in EV uptake has led to soaring demand.
However, the slow pace of infrastructure development has hindered supply growth, resulting in price spikes in 2022. As EV subsidies decrease and prices normalize, we anticipate a controlled decline, settling around $20,000 per tonne by the decade’s end.
Therefore, any imbalance in the supply and demand equation directly affects prices. Any oversupply can depress prices until demand catches up.
Conversely, a surge in demand, driven by the EV boom, can outpace supply, pushing prices up. This is exactly what happened in November 2022 when a record-breaking lithium price rally happened, reaching over five-fold increase.

Unraveling Geopolitical Influences
Geopolitical factors significantly influence the lithium market due to the concentration of lithium reserves in specific regions. Countries like Australia, Chile, and Argentina hold substantial lithium reserves and are major players in the global supply chain. Political stability in these countries is crucial. Any political unrest or policy changes can disrupt supply and affect global prices.
Moreover, government policies regarding mining operations, environmental standards, and export regulations can also impact lithium production and prices. Favorable policies can boost production, while restrictive regulations can hinder it.
International trade policies, including tariffs and trade agreements, further influence the flow of lithium across borders. For example, trade tensions between major economies can lead to tariffs on lithium products, affecting global supply chains and prices.
This is what happen recently with the United States announcing its plan to increase tariffs on Chinese imports, including EVs, batteries, and solar cells.
Breaking Down Technological Developments
Advancements in technology have a dual impact on lithium prices by affecting both demand and supply.
- Battery Technology: Breakthroughs in battery technology can significantly influence lithium demand. The development of alternative battery chemistries, such as solid-state batteries or sodium-ion batteries, could reduce reliance on lithium, potentially decreasing its demand and price. On the other hand, innovations that enhance lithium-ion battery performance can boost demand.
- Extraction and Processing Technologies: Technological improvements in lithium extraction and processing can increase supply efficiency and reduce production costs. For example, advancements in direct lithium extraction (DLE) techniques can make it easier and more cost-effective to extract lithium from brine resources, positively impacting prices.
Disentangling Environmental Regulations
Environmental considerations are increasingly shaping the lithium market today.
Stricter environmental regulations on mining practices can limit lithium supply and drive up prices. Mining operations must comply with environmental standards to mitigate their impact on ecosystems and water resources, which can increase operational costs.
Furthermore, the growing emphasis on reducing the environmental footprint of lithium extraction is prompting the industry to adopt greener practices. These sustainable techniques, such as using renewable energy in mining operations and recycling water, may initially increase costs. However, they are expected to lead to long-term sustainability and potentially stabilize prices.
There is also rising pressure from consumers and investors for companies to adhere to environmental, social, and governance (ESG) criteria. Companies that prioritize sustainable and ethical practices may gain a competitive edge, influencing market dynamics and prices.
Quality Challenges in Battery-Grade Lithium Production
As lithium increasingly powers rechargeable batteries, ensuring high-quality lithium products for battery use becomes paramount. Producing battery-grade lithium involves intricate refining processes to meet stringent quality and purity standards.
New refineries typically start with lower-quality technical-grade lithium, necessitating refining improvements to achieve battery-grade purity. Consequently, despite an overall supply surplus, the battery-grade lithium market may face short-term constraints until refining operations are optimized.
What are the Top Lithium Producing Countries?
In 2023, three countries – Australia, Chile, and China – dominated global lithium production, collectively accounting for 88% of the total output.

Australia: Leading the Charge
Australia stands as the world’s top lithium producer, sourcing the mineral directly from hard-rock mines, particularly spodumene. Over the past decade, Australia witnessed a remarkable surge in production. In 2013, output stood at 13,000 metric tons, soaring to an impressive 86,000 metric tons by 2023.
Chile: Brine Extraction Expert
Chile follows closely behind Australia in lithium production, albeit with more modest growth. The South American nation primarily extracts lithium from brine sources, with production climbing from 13,500 tonnes in 2013 to 44,000 metric tons in 2023.
China: Closing the Gap
China, also harnessing lithium from brine, has been steadily approaching Chile’s production levels. From a modest 4,000 metric tons in 2013, China ramped up domestic production to 33,000 metric tons in 2023.
Additionally, Chinese companies have expanded their influence in the global lithium market, with three of them ranking among the top lithium mining entities. Tianqi Lithium, the largest among them, holds a significant stake in Greenbushes, the world’s largest hard-rock lithium mine in Australia.
Argentina: A Rising Contender
Argentina emerges as the fourth-largest lithium producer, tripling its output over the past decade. With increased investments from international players, Argentina aims to further enhance its lithium production capacity.
With major producers scaling up to meet the surging demand, particularly from the clean energy sector like electric vehicle batteries, the lithium market recently experienced a surplus. This oversupply led to a significant price collapse of over 80% from the record highs witnessed in late 2022.
How to Invest in Lithium? Stocks, ETFs, and Derivatives
Due to the nascent stage of the lithium market, the range of investment products available is relatively limited compared to other commodities. Nevertheless, investors can still tap into this dynamic market through two primary avenues: lithium stocks and lithium ETFs.
Lithium Stocks:
Investing in individual stocks remains one of the most direct ways to gain exposure to the lithium industry. However, it’s crucial to recognize that stocks serve as proxies for the market’s performance.
The soaring costs of lithium don’t always translate into corresponding increases in lithium stock prices. Establishing new mining operations can be capital-intensive, and ultimately, a stock’s valuation hinges on the company’s financial health. Despite this caveat, lithium stocks have demonstrated robust performance over the past five years.
Investing in lithium stocks offers several benefits. Firstly, individual lithium stocks provide significant earning potential if the company performs well. Additionally, many lithium stocks pay dividends, offering investors regular income that can be reinvested to bolster portfolio growth.
Moreover, some lithium producers have alternative revenue streams, which can help mitigate the volatility associated with lithium prices. However, investing in lithium stocks also entails certain risks. For instance, putting all investments into one or two lithium stocks can result in a lack of diversification in the portfolio.
Furthermore, the return on lithium stocks is heavily dependent on the financial health of the company, necessitating regular updates on the company’s fundamentals and thorough research.
Lithium ETFs
For investors seeking exposure to the lithium market without the time-intensive task of researching individual stocks, lithium exchange-traded funds (ETFs) offer a convenient option. These ETFs track an index composed of a diversified collection of lithium stocks, providing you with instant access to a broad portfolio that includes both lithium producers and manufacturers.
Here are two prominent lithium ETFs:
- Global X Lithium & Battery Tech ETF (LIT): LIT comprises 39 different lithium and battery stocks. With $4.5 billion in assets under management, this ETF charges an annual fee of 0.75%.
- Amplify Lithium & Battery Technology ETF (BATT): BATT is solely focused on lithium battery providers. Holding $194 million in assets, this ETF charges an annual fee of 0.59%.
Investing in lithium ETFs presents its own set of benefits. ETFs provide instant diversification across a broad range of lithium-focused stocks, thereby reducing the risk associated with individual stock selection. Also, ETFs spread investment risk across a large portfolio of stocks, making them less risky than individual stocks.
Furthermore, similar to individual stocks, some lithium ETFs offer dividend schemes, providing investors with the opportunity for positive cash flow. Nevertheless, there are risks associated with investing in lithium ETFs as well.
For example, during upward trends in the lithium market, returns from ETFs may not be as substantial as those from individual stocks. And take note, ETFs are not free products; providers charge investors a percentage fee for operating and maintaining the ETF.
Direct Investment Through Commodities Market
For those interested in direct investment, lithium can be traded in the commodities market through futures and options. These derivatives allow you to buy and sell access to lithium as a material, though they come with significant risk and volatility, making them unsuitable for inexperienced investors.
Futures Contracts
A futures contract is an agreement to buy or sell a commodity at a future date for a specified price. There are two types:
Standard Futures Contracts: You commit to buying the actual commodity. If you hold the contract until expiration, you must purchase the physical lithium.
Cash Settlement Futures Contracts: Instead of exchanging the physical commodity, the parties settle the contract’s value in cash.
Options Contracts
Options contracts allow you to trade the value of an asset, with the added flexibility of choosing whether to execute the contract at expiration. This differs from futures contracts, which must be executed regardless of market conditions. When buying an options contract, you pay an upfront fee known as a “premium.”
Investing in lithium offers several pathways, including stocks of lithium producers or users, funds that aggregate lithium-related equities, and direct commodity trading through futures and options. Each method carries different levels of risk and complexity, catering to various investor preferences and experience levels.
Who are the Major Lithium Companies?
1. ALBEMARLE: Market cap: US$14 billion
Albemarle, based in North Carolina, stands as the largest lithium company by market cap and the world’s leading lithium producer, boasting over 7,000 global employees. Following a 2022 realignment, Albemarle now operates two primary business units, with a particular focus on lithium-ion battery and energy transition markets under its Albemarle Energy Storage unit. This division oversees lithium carbonate, hydroxide, and metal production.
With operations spanning Chile, Australia, and the US, Albemarle holds a diverse portfolio of lithium mines and facilities. In Chile, the company produces lithium carbonate at its La Negra conversion plants, leveraging brine from the Salar de Atacama.
In the US, Albemarle aims to bolster domestic production in line with the Inflation Reduction Act. It owns the Silver Peak lithium brine operations in Nevada’s Clayton Valley, set to double lithium production by 2025. Albemarle received a $90 million critical materials award from the US Department of Defense in September 2023 to enhance domestic lithium production and support the EV battery supply chain.
Additionally, the company plans to revive the Kings Mountain lithium mine in North Carolina, backed by US government funding. Albemarle also plans to develop the Albemarle Technology Park in North Carolina for advanced R&D in lithium innovation.
2. SQM: Market cap: US$12.07 billion
SQM, a chemicals giant operates in over 20 countries, serving customers across 110 nations. The company’s diverse business areas span lithium, potassium, and specialty plant nutrition.
Primarily operating in Chile, SQM extracts brine from the Salar de Atacama and processes lithium chloride into lithium carbonate and hydroxide at its Salar del Carmen lithium plants near Antofagasta. The company is expanding production at Salar del Carmen from 180,000 MT to 210,000 MT, initiating this year.
To mitigate environmental impact, SQM announced a $1.5 billion investment in the Salar Futuro project, focusing on advanced evaporation technologies, direct lithium extraction, and a seawater desalination plant.
Despite uncertainty stemming from Chile’s National Lithium Strategy, SQM’s existing contracts, extending through 2030, are expected to be respected by the government. In early 2024, a partnership formed between SQM and state-owned mining company CODELCO, with CODELCO holding a majority control stake.
In Australia, SQM is developing the Mount Holland lithium project, recognized as one of the world’s largest hard-rock deposits, in partnership with Wesfarmers. Anticipating lithium hydroxide production to commence by H1 2025, SQM’s lithium carbonate capacity was projected to reach 210,000 tons by the beginning of 2024.
3. Tianqi Lithium: Market cap: US$10.43 billion
Tianqi Lithium is a subsidiary of Chengdu Tianqi Industry Group based in China. As the world’s largest hard-rock lithium producer, Tianqi Lithium operates assets in Australia, Chile, and China. The company holds a notable stake in SQM, having acquired a 2.1% share in 2016, later increasing it to 23.77%.
In Australia, Tianqi owns the Greenbushes mine, acquired in 2012 through the purchase of Talison Lithium. The company also developed a lithium hydroxide plant in Western Australia’s Kwinana Industrial Area, commencing production in Q3 2019. Subsequent output began in mid-2021.
Rising lithium prices and its Hong Kong listing in 2022, which raised approximately US$1.7 billion, contributed to Tianqi’s buoyancy. Commercial production at Kwinana’s Train 1 commenced in December 2022, with Train 2 anticipated to start in 2024. Once operational, the hydroxide plant is projected to produce 48,000 MT per year, utilizing lithium from Greenbushes.
In February of the current year, Tianqi Lithium updated its total mineral reserves at Greenbushes to 447 million tonnes, with an average lithium oxide grade of 1.5%, equivalent to about 16 million tonnes of lithium carbonate.

What is In Store for Lithium?
Forecasting lithium supply beyond the end of the decade presents challenges due to limited visibility into existing, planned, and potential projects. While projections until 2030 can be reasonably accurate, the landscape becomes murkier.
On the demand side, projections suggest that it will tremendously to almost 4 million tonnes, as shown below. But of course, as discussed earlier, various trends impact this demand trajectory.

Incentive pricing becomes a critical factor in determining the attractiveness of new projects. With an estimated 1.5 million tonnes of supply, the fully allocated cost of lithium would be around $15,000 per tonne, suggesting market pricing would exceed this threshold.
Navigating the Immaturity of the Lithium Market
Forecasting the future of the lithium market is hindered by its relative immaturity. Lack of globally accepted specifications and pricing anchors complicates pricing dynamics.
Lithium products, akin to specialty chemicals, require precise specifications, yet the industry’s growth trajectory impedes standardization efforts. While greater standardization is anticipated in the future, it will evolve gradually.
According to Bloomberg estimates, demand for lithium-ion batteries will increase tenfold over the next decade. This surge in demand is largely driven by the global commitment of over 100 countries to achieve net zero emissions within the coming decades.

As part of this commitment, many nations are turning to the electrification of transportation as a crucial solution to reduce GHG emissions and combat climate change. This shift towards electrification underscores the growing importance of lithium-ion batteries in powering EVs and other clean energy technologies.
The Role of Partnerships in Shaping the Lithium Industry
In 2022, a significant portion of lithium supply was dominated by a handful of companies. However, future industry dynamics are expected to witness a decline in their market share, as smaller firms expand and new ventures emerge.
While horizontal integration may not be a prevailing trend, vertical integration is poised to play a pivotal role. Partnerships between miners and refiners offer mutual benefits, enabling risk-sharing and capital investment in new projects.
Collaborative efforts between upstream and downstream operations enhance expertise, improve margins, and capture a larger market share. Such partnerships, exemplified by ventures like Pilbara Minerals and POSCO in South Korea and SQM and Wesfarmers in Western Australia, are anticipated to become increasingly common in the industry’s future landscape.
Conclusion
The evolution of lithium, from its discovery over two centuries ago to its pivotal role in powering modern technology, underscores its significance in shaping our present and future. As the world accelerates towards a sustainable energy paradigm, lithium emerges as the linchpin of this transition, fueling advancements in battery technology and driving the proliferation of electric vehicles and renewable energy storage solutions.
The post The Ultimate Guide to Lithium and Lithium Prices appeared first on Carbon Credits.
Since the Industrial Revolution, human activities have left a significant and growing mark on the natural world. Pollution, carbon emissions, and altered land use have degraded ecosystems, contaminated water supplies, and pushed global temperatures to record highs. These are not distant consequences. They affect the air people breathe, the food they eat, and the stability of the climate every community depends on.
Understanding the environmental effects of industry is the first step toward meaningful change. When we grasp the full picture of how industrial practices damage the planet, we can make better decisions at every level, from individual choices to corporate policy to government regulation.
This guide covers the origins of industrial pollution, its specific environmental impacts, which industries carry the heaviest footprint, and the solutions that are already making a difference. We also highlight companies leading by example and explain how businesses of all sizes can take action today.
How Did the Industrial Revolution Cause Environmental Pollution?
The Industrial Revolution began in England in the 18th century before spreading through Europe and across the world. Nations shifted from agrarian economies to industrial ones, and fossil fuels were burned on a massive scale to power that transition. The environmental deterioration that followed has been compounding ever since.
Land use changed dramatically alongside industrial growth. As factories and urban centers expanded, farmland shrank and agriculture itself became industrialized. Industrial farming introduced fossil-fuel-powered machinery, synthetic fertilizers, pesticides, and concentrated livestock operations. The result was soil deterioration, widespread air and water pollution, and a significant rise in greenhouse gas emissions from the agricultural sector alone.
Deforestation and urbanization compounded the damage by eliminating natural carbon sinks. Forests and wetlands that once absorbed carbon dioxide from the atmosphere were cleared for development, removing the land’s natural ability to absorb carbon and leaving more greenhouse gases concentrated in the air.
The numbers tell the story clearly. Atmospheric CO2 was consistently around 280 parts per million before industrialization began. According to the IEA, CO2 concentrations reached approximately 427 parts per million in 2025, more than 50% above pre-industrial levels, with total energy-related emissions hitting a record high of nearly 38.4 billion tonnes. That figure has risen every decade since the Industrial Revolution began.
Industrialization continues today in developing nations, many of which lack the financial infrastructure to adopt clean energy and rely instead on coal, oil, and petroleum to power their growing economies. Even many developed nations remain heavily dependent on polluting industries, continuing to add to global greenhouse gas concentrations.
What Are the Environmental Impacts of Industry?
Industrial pollution creates environmental damage at every scale, from local waterways to the global atmosphere. The consequences affect ecosystems, human health, and the long-term stability of the climate. Below are the three primary categories of environmental impact driven by industry.
Pollution
Industry causes pollution across water, air, and soil, the three foundations of life on Earth. Each type of pollution carries its own chain of consequences.
Water pollution occurs in both freshwater systems and oceans. Water used in industrial processes becomes contaminated when it contacts metals, chemicals, or radioactive waste, and that water is often discharged into rivers and waterways. The result is contaminated drinking water, damaged aquatic ecosystems, and crops irrigated with polluted water that can become harmful to consume. Globally, 80% of wastewater is still released untreated into the environment.
Air pollution is any physical, biological, or chemical change to the atmosphere that reduces air quality. Gas, smoke, and fine particulate matter from burning coal or natural gas cause respiratory and cardiovascular disease in humans and threaten ecosystems globally. Air pollution now contributes to approximately 7.9 million premature deaths per year worldwide, making it one of the leading environmental causes of mortality. Airborne contaminants also cause acid rain, which ruins crops and acidifies freshwater bodies.
Soil pollution occurs when chemical levels in the ground exceed safe thresholds and present a threat to human health or ecosystems. Soil becomes polluted through industrial waste, chemical pesticides and fertilizers, oil spills, and landfills. Heavy metal contamination from industrial waste currently affects an estimated 20% of global agricultural land. Contaminated soil reduces crop yields, harms wildlife, and can lead to serious health problems in humans and animals living in affected areas.
Ecological Consequences
Pollution and altered land use place severe strain on ecosystems in ways that ripple outward for generations. Three interconnected effects stand out.
Habitat destruction results from deforestation, urban expansion, and industrial development. When natural habitats are destroyed or fragmented, plants and animals lose the environments they need to survive. Species are pushed into shrinking territories, forcing greater competition for resources and raising extinction risks. According to current data, 33% of global soils are degraded due to pollution and erosion, compressing the productive land available to both agriculture and wildlife.
Slower environmental recovery is another consequence of the cumulative strain on ecosystems. Natural disasters like wildfires and hurricanes are growing more frequent and severe as the climate shifts, and ecosystems already weakened by pollution and habitat loss take longer to recover from each new event. Industrial accidents, such as oil spills or chemical leaks, add further damage that can persist in an environment for decades.
Biodiversity loss continues to accelerate as species go extinct at rates far above natural baselines. The combination of habitat destruction, pollution, climate change, and resource depletion creates overlapping pressures that many species cannot adapt to quickly enough.
Atmospheric Changes
Industrial practices release large quantities of greenhouse gases into the atmosphere, driving global warming and climate change. These two phenomena are distinct but deeply linked.
Global warming occurs when greenhouse gases like CO2 and methane accumulate in the atmosphere and trap heat that would otherwise radiate into space. Burning fossil fuels is the primary driver of CO2 buildup. Agricultural practices and landfills release significant quantities of methane, a greenhouse gas with more than 80 times the short-term warming power of CO2.
Climate change is the broader set of consequences that follows from global warming. Rising temperatures shift rainfall patterns, intensify storms, accelerate glacial melting, raise sea levels, and make agricultural conditions less predictable. Every fraction of a degree of additional warming increases these risks. The remaining carbon budget for limiting warming to 1.5 degrees Celsius is now projected to be exhausted by 2029 at current emission rates.
What Industries Have the Largest Environmental Impact?

Some industries carry a disproportionately large environmental footprint. Researchers evaluate environmental impact across six key components: greenhouse gas emissions, water use, waste generation, land and water pollutants, air pollutants, and natural resource use. The industries that dominate these categories are as follows.
Energy and electric utilities are the most polluting sector on Earth, generating approximately 15.83 billion tonnes of greenhouse gas emissions annually. The energy sector ranks highest in four of the six environmental impact categories: greenhouse gas emissions, waste, air pollutants, and natural resource use. As long as coal and natural gas remain central to electricity generation, this sector will continue to lead all others in environmental damage.
Transport is the second most polluting industry globally, responsible for around 8.43 billion tonnes of greenhouse gas emissions each year. Road transport accounts for the majority of that figure, while aviation and shipping contribute significantly. The sector is under growing pressure to electrify and adopt cleaner fuels.
Manufacturing and construction generate approximately 6.3 billion tonnes of emissions annually and consume vast quantities of raw materials including metals, sand, and timber. This sector appears across all six environmental impact categories, reflecting its broad footprint across pollution, resource use, and land disruption.
Food production ranks as the highest non-utility industry in water use and land and water pollutants. Industrial agriculture is responsible for the majority of freshwater withdrawals globally and is a leading driver of deforestation, soil degradation, and chemical runoff into waterways.
How Can the Environmental Impact of Industry Be Reduced?
Meaningful solutions to industrial pollution already exist. The challenge is implementing them at speed and scale. Below are the most impactful approaches available to businesses and industries today.
Better Waste Management
Improperly handled industrial waste is one of the most direct and preventable causes of environmental pollution. When waste is not treated and disposed of correctly, it contaminates waterways, soil, and groundwater. Industries that invest in proper waste treatment and disposal systems can eliminate a significant portion of their local environmental impact. This is also an area where regulation has historically produced measurable results.
Improved Recycling and Water Reuse
Unnecessary pollution occurs when recyclable materials and reusable water are instead discarded. Industrial water recycling, for example, keeps contaminated water within closed systems rather than releasing it into rivers and oceans. Expanding recycling programs across manufacturing sectors reduces both raw material extraction and waste generation, addressing two environmental problems at once.
Greenhouse Gas Mitigation and Carbon Offsetting
Reducing greenhouse gas emissions from industrial processes is the single most important lever for slowing climate change. Switching to renewable or clean energy cuts emissions at the source. Gas capture programs reduce methane and other potent greenhouse gases that would otherwise escape from operations like landfills and agricultural sites. For emissions that cannot yet be eliminated, verified carbon offset programs allow businesses to fund reforestation, methane capture, and renewable energy projects that compensate for their remaining footprint. Understanding the social cost of carbon helps businesses make the case internally for these investments.
Smarter Land Use
Industrial site selection and land management have lasting ecological consequences. Businesses should choose locations that minimize habitat disruption and avoid high-risk areas where accidents like fires or spills could cause catastrophic environmental damage. Reducing resource extraction on sensitive lands and funding environmental restoration projects, including reforestation and wetland rehabilitation, helps offset the land-use impact of ongoing operations. Carbon removal credits are one mechanism businesses can use to support these restoration efforts directly.
Advancing Technology
Older industrial technologies are often energy-inefficient and generate disproportionately high levels of pollution. Upgrading to newer equipment and processes allows industries to reduce emissions and resource consumption simultaneously. Switching to renewable energy, adopting AI-driven energy management, and investing in cleaner production technologies are all practical steps that industries can take now. The companies seeing the most progress are those that have embedded sustainability goals into their technology roadmaps rather than treating them as separate initiatives.
Environmental Awareness and Impact Assessment
Education and measurement underpin all other solutions. Industries that conduct regular environmental impact assessments, track their resource consumption and emissions, and train employees on sustainability practices are better positioned to identify problems early and respond effectively. Measuring and managing your carbon footprint is as essential for businesses as financial reporting, and increasingly, regulators and investors are requiring exactly that.
What Companies Are Reducing Their Environmental Impact?
Several major companies have made substantial commitments to reducing their environmental footprint and serve as benchmarks for the rest of the corporate world. Their progress, and in some cases their setbacks, offer useful lessons for any business navigating the transition to more sustainable operations.
Microsoft has been carbon neutral since 2012 and has set more ambitious targets since then. The company’s 2025 Environmental Sustainability Report outlines its goals to become carbon negative, water positive, and zero waste by 2030. Microsoft charges an internal carbon fee to business units and reinvests those funds into carbon reduction and removal initiatives. The company achieved its goal to protect more land than it uses by 2025 and has invested in renewable energy across 16 countries, including its first large-scale nuclear energy agreement.
Intel aims to be net positive on water use and achieve 100% renewable energy for its global operations by 2030. Intel links a percentage of employee compensation to corporate sustainability metrics, recognizing that achieving environmental goals requires company-wide participation rather than top-down mandates alone.
Alphabet (Google) has made significant progress on data center efficiency, reducing data center energy emissions by 12% in 2024 despite a 27% increase in overall electricity consumption, driven largely by AI workloads. Google’s data centers now provide six times more computing capacity per unit of electricity compared to five years ago. In 2024, Google signed agreements for more than 8 gigawatts of clean energy, the highest annual volume in the company’s history. The company has also pioneered AI-driven cooling systems for its data centers that dramatically reduce energy waste. It is worth noting that all three of these companies face the growing challenge of rising energy demand from AI infrastructure, a reminder that sustainability commitments require continuous adaptation as business models evolve.
Changing the Environmental Impact of Industry
More than two centuries of large-scale industrial activity have given us a clear view of the consequences. Pollution, ecological damage, and atmospheric change are not side effects we can manage around. They are the defining environmental challenge of our time, and the window for meaningful action is narrowing.
The good news is that solutions are no longer theoretical. Renewable energy is now cost-competitive with fossil fuels in most markets. Carbon capture and offset programs are funding real-world emissions reductions. Companies across every sector are finding that sustainable practices often improve efficiency and reduce long-term costs alongside their environmental benefits.
Whether you run a business or simply want to understand your own role in this picture, the path forward starts with knowing where you stand. Visit Terrapass to learn how you can measure your carbon footprint, reduce your emissions, and support verified projects that make a difference.
Brought to you by terrapass.com
The post The Environmental Impact of Industry: Causes, Effects & Solutions appeared first on Terrapass.
Humanity is consuming natural resources faster than the planet can replenish them, and the gap is growing. The result is environmental degradation, economic risk, and a shrinking inheritance for future generations. With the global population still rising and consumption habits in wealthy nations showing little sign of slowing, addressing overconsumption has never been more urgent.
This guide explains what overconsumption of natural resources means, which resources are most at risk, how it harms the environment, and what individuals and industries can do about it.
Key Takeaways
- Earth Overshoot Day 2026 falls on July 30, the point at which humanity exhausts the planet’s entire annual ecological budget with five months still remaining in the year.
- Humanity is currently using nature 73% faster than Earth’s ecosystems can regenerate, the equivalent of consuming 1.73 planets simultaneously. This is the highest level of ecological overshoot ever recorded.
- The two most consumed natural resources on Earth are water and sand.
- North Americans consume an average of 90 kilograms of natural resources per person per day, nine times more than the average African.
- Transitioning to renewable energy, sustainable agriculture, and circular economy practices are the most effective paths forward.
What Is Overconsumption of Natural Resources?
Overconsumption occurs when humans extract or use natural resources faster than the planet can replenish them. When this happens, ecosystems cannot recover from excessive resource extraction, leading to biodiversity loss and long-term deterioration of the natural world. Once a resource is fully depleted from a region, it is often gone permanently.
The logging industry is a clear example. Timber is used for construction, paper manufacturing, and fuel. Billions of people depend on it for shelter, heat, and cooking. But overconsumption of timber leads to deforestation. Since 1990, the world has lost 420 million hectares of forest land, and between 2001 and 2025, total global tree cover loss reached 540 million hectares driven primarily by agricultural expansion, logging, and infrastructure development.
The stakes are not abstract. When essential resources like clean water, fertile land, and building materials disappear, the consequences fall hardest on the most vulnerable communities around the world.
How Does Overconsumption Affect Natural Resources?
Natural resources need time to replenish. Forests must regrow after logging. Fish populations must recover after commercial fishing. Aquifers refill slowly after extraction. When human demand exceeds these regeneration rates, the consequences compound over time.
A useful benchmark is Earth Overshoot Day, the calendar date each year when humanity’s demand for ecological resources exceeds what Earth can regenerate in that same year. In 1972, overshoot day fell on December 31, meaning humanity was living within the planet’s means. By 2026, it falls on July 30, the highest level of ecological overshoot in human history. From that point on, we operate on ecological credit for the rest of the year, drawing down natural capital in forests, fisheries, freshwater systems, and the atmosphere’s capacity to absorb CO₂.
Understanding this dynamic is central to understanding how climate change and resource depletion are connected and why action on both fronts is urgent.
What is an ecological footprint?
An ecological footprint measures the land and water area a human population requires to produce the resources it consumes and absorb the waste it generates. When a nation’s footprint exceeds its biocapacity, it runs an ecological deficit. More than 80% of the global population lives in countries currently running such a deficit.
What Natural Resources Are We Consuming?
Natural resources fall into two broad categories: non-renewable and renewable. Both are under pressure from overconsumption, though for different reasons.
Non-Renewable Resources
Non-renewable resources form over millions of years and cannot be meaningfully replenished on human timescales. They include fossil fuels like oil, coal, and natural gas, as well as mined materials such as metals, ores, diamonds, sand, and other raw materials.
Relying heavily on non-renewables carries serious economic risk. More than 80% of the world’s energy still comes from oil, coal, and natural gas. The consequences of burning fossil fuels extend well beyond supply risk. They include greenhouse gas emissions, air pollution, and accelerating climate change. If fossil fuels became too scarce or expensive to extract, the disruption to the global economy would be severe, with no ready substitute available at the same scale.
Demand for critical minerals like lithium, cobalt, and copper is also expected to surge dramatically in coming decades, driven by the transition to electric vehicles and renewable energy infrastructure. Even the green energy transition has its own resource demands to manage carefully.
Renewable Resources
 5")
Renewable resources replenish naturally in a much shorter timeframe. They include solar and wind energy, food crops, fish, animals, and lumber.
Wind and sunlight are effectively limitless as energy sources. We can use them without depleting them, which is why transitioning to sustainable energy sources is such a critical lever for reducing overall resource pressure. Biological renewables like fish populations and forests, however, must be carefully managed to avoid overexploitation.
Fish stocks are a pressing concern. The FAO reported that 35.5% of global fish stocks were overfished in 2025, continuing an upward trend from previous years. Overfishing doesn’t just reduce the catch available today. It disrupts marine food webs, causes biodiversity loss, and threatens the livelihoods of coastal communities worldwide.
Overconsumption also degrades fertile agricultural land. As soil quality deteriorates and water becomes scarcer, the capacity to feed a growing global population comes under increasing strain.
How Does Consumption of Natural Resources Vary by Country?
Resource consumption is closely correlated with national wealth. Wealthier nations consume 10 times more natural resources than developing countries.
North America leads global per-capita consumption. The average North American uses 90 kilograms of resources per day, compared to 45 kilograms for the average European and just 10 kilograms for the average African resident. According to Scientific American, over a single lifetime, one American will consume 53 times as many goods and services as a person from China and as many natural resources as 35 residents of India.
This disparity matters because it shapes where solutions need to be concentrated. High-consumption nations bear disproportionate responsibility for driving global resource depletion and have the greatest capacity to change. Understanding your own carbon footprint is a meaningful first step toward making that change personal.
How Does Overconsumption of Natural Resources Affect the Environment?
The environmental impacts of resource-intensive industries are wide-ranging and interconnected. Some are direct. Deforestation removes habitat and releases stored carbon. Others work through a longer chain, as industries that harvest natural resources generate greenhouse gas emissions that accelerate climate change, which in turn threatens the very resource systems we depend on.
Consider the construction industry. It requires metals mined from the Earth, sand and lumber as building materials, and fossil fuels to power its machinery. Each of these inputs carries its own environmental cost including habitat disruption, water use, and carbon emissions, and they compound across the full supply chain.
Atmospheric greenhouse gas concentrations have risen from 367 parts per million CO₂ equivalent in 1972 to an estimated 547 parts per million in 2026, according to NOAA estimates. The accumulated ecological debt from overshoot since the early 1970s now equals approximately 20.6 years of the planet’s full biological productivity.
Protecting land and ocean ecosystems and transitioning to sustainable energy sources represents humanity’s best opportunity to reverse this trend. For businesses already thinking about their role in this, carbon offsets can support reforestation and emissions reduction projects that directly address the damage overconsumption has caused.
What Are the Most Consumed Natural Resources?
The two natural resources consumed in the greatest quantities globally are water and sand.
Sand
Sand is the world’s second most consumed natural resource, used primarily in concrete for construction. Global urbanization drives an enormous appetite for it, and humanity extracts approximately 50 billion tons of sand each year. The consequences include the deterioration of river systems and ocean habitats as sand is removed in vast quantities.
Water
Water is the most consumed natural resource on Earth. It is essential for drinking, agriculture, cooking, industrial processes, and electricity generation. Despite water covering 70% of the planet’s surface, 97.5% of that water is ocean water. Accessible freshwater is a genuinely finite resource.
The numbers reveal the scale of the problem. About 4 billion people, nearly two-thirds of the global population, experience severe water scarcity for at least one month each year. Agriculture accounts for roughly 70% of all global freshwater withdrawals. According to the BBC, 21 of Earth’s 35 major aquifers are already receding. Climate change is deepening the crisis by intensifying droughts and altering rainfall patterns precisely where demand is growing fastest.
The global carbon cycle is tightly linked to freshwater availability. Warming temperatures and disrupted precipitation patterns are a direct consequence of the same fossil fuel overconsumption that drives resource depletion more broadly.
How Can We Slow the Overconsumption of Natural Resources?
 6")
Slowing overconsumption requires action at multiple levels: policy, industry, and individual behavior. The most impactful changes involve moving away from non-renewable resources, improving efficiency across industries, and embracing the principles of a circular economy, in which materials are reused and regenerated rather than consumed and discarded.
Transition to renewable energy. New technologies continue to lower the cost and improve the efficiency of renewable energy sources like wind and solar. Accelerating this transition reduces fossil fuel burning and the extraction pressures that come with it. Renewable Energy Credits (RECs) are one accessible way for households and businesses to support clean power today.
Sustainable agriculture and fisheries management. More efficient food production, better fisheries regulation, and reduced food waste can protect natural lands and fish populations while feeding a growing global population. Reducing meat consumption is one of the highest-impact dietary changes an individual can make.
Water desalination and conservation. Desalination technology can convert ocean water into freshwater suitable for drinking and agriculture, reducing pressure on strained freshwater systems. Conservation measures in agriculture, which is by far the dominant user of freshwater, can make an outsized difference.
Circular economy practices. Designing products for longevity, repairability, and recyclability reduces the total volume of resources extracted and the waste generated. This model is gaining traction across manufacturing, construction, and packaging industries and is increasingly recognized as one of the most commercially viable paths to sustainability.
Carbon offsetting. For emissions and resource use that cannot yet be eliminated, verified carbon offsets fund projects that reduce deforestation, capture methane, and support renewable energy development. Terrapass carbon offset projects include reforestation, REDD+, landfill gas capture, and residential solar installation.
Individual action. Each person can meaningfully reduce their ecological footprint by being conscious of consumption habits. Buying less, choosing durable goods, reducing food waste, and reusing materials wherever possible all add up. Use the Terrapass carbon calculator to understand exactly where your personal footprint comes from and take targeted action.
Frequently Asked Questions
What are the main natural resources being overconsumed?
The most overconsumed resources include freshwater, sand, fossil fuels (oil, coal, and natural gas), timber from forests, and fish stocks. Fertile agricultural land and minerals like lithium and cobalt are also under increasing pressure.
Which country consumes the most natural resources per person?
North Americans, and Americans in particular, consume the most natural resources per capita. The average North American uses 90 kilograms of resources per day, compared to 45 kilograms in Europe and 10 kilograms in Africa.
What is Earth Overshoot Day and why does it matter?
Earth Overshoot Day marks the point in the calendar year when humanity has used up all the ecological resources the planet can regenerate that year. In 2026, it falls on July 30, the highest level of ecological overshoot ever recorded. Everything consumed after that date draws down ecological reserves, accelerating long-term depletion.
How does overconsumption drive climate change?
Overconsumption drives climate change primarily through the extraction and burning of fossil fuels, deforestation (which releases stored carbon), and industrial processes that generate greenhouse gas emissions. Understanding how the carbon cycle works helps explain why reducing consumption and offsetting emissions are two sides of the same solution.
How can individuals reduce their impact?
The most effective individual actions include reducing home energy use, minimizing food waste, consuming less meat, and buying durable goods over disposable ones. Calculating your carbon footprint is a good starting point, and offsetting unavoidable emissions through Terrapass helps fund real-world emissions reductions.
What is a circular economy?
A circular economy is an economic model designed to eliminate waste by keeping materials in use for as long as possible through reuse, repair, remanufacturing, and recycling. It contrasts with the dominant take-make-dispose model that drives overconsumption and is increasingly seen as one of the most practical large-scale responses to ecological overshoot.
Taking Action to Protect Natural Resources
Overconsumption is depleting the natural systems that all human life depends on. The data is stark. In 2026, humanity hit the highest level of ecological overshoot ever recorded, and the real human footprint is still growing.
The solutions exist. Renewable energy, sustainable resource management, and a shift toward circular economic models can collectively move us back toward a world that operates within planetary limits. Technology continues to improve our capacity to do more with less, from precision agriculture to advanced water treatment to verified carbon markets.
Systemic change is essential, but individual choices also matter. A world of responsibly consumed resources is a world of greater health, stability, and opportunity for everyone including future generations.
Learn how Terrapass can help you reduce your carbon footprint and offset your consumption.
Brought to you by terrapass.com
The post Overconsumption of Natural Resources: Causes, Effects & Solutions (2026) appeared first on Terrapass.
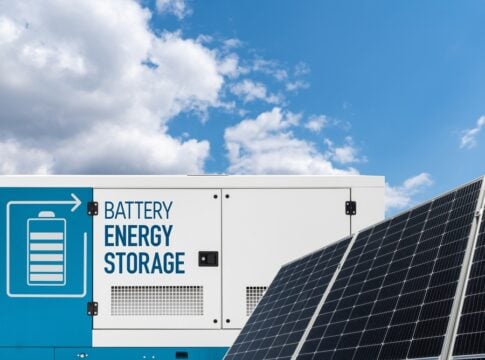
As electricity demand rises and renewable energy grows in the U.S., battery storage is key. Waymo has launched a battery repurposing program to give retired electric vehicle (EV) batteries a new purpose in the power sector.
Waymo is working with B2U Storage Solutions to turn used batteries from its all-electric fleet into large-scale energy storage systems. Instead of recycling these batteries after use, Waymo will repurpose them to store electricity and support local power grids.
This program reflects a commitment to the circular economy, keeping products useful before recycling.
Adam Lenz, Head of Sustainability & Environment at Waymo, said:
“Our shared fleet of EVs provide a massive opportunity to support the growth of clean energy on the electricity grid while expanding the circular economy. Through this partnership, we can repurpose our batteries for local grid storage and ensure our batteries continue to provide economic and environmental value to the community long after they’ve retired from the road.”
Turning Old EV Batteries Into Energy Assets
EV batteries often retain significant storage capacity after their driving days. While their performance may drop for vehicles, many can still serve well in energy storage projects.
The press release says that retired Waymo batteries will join grid-connected energy storage systems through this partnership. These systems will store electricity from renewable sources like solar and wind.
During peak renewable generation, especially when solar production is high, the batteries will absorb excess electricity. Later, when demand increases in the evening, this stored energy can flow back into the grid.
This process helps balance electricity supply and demand, making renewable energy more reliable.
B2U specializes in second-life battery storage technology. They will manage the batteries during their second use and ensure proper recycling when they reach the end of their life.
Here’s a picture to show how B2U’s storage works.

This collaboration creates a complete lifecycle pathway for EV batteries—from vehicle use to energy storage and finally recycling.
Supporting Growing Demand for Battery Storage
This initiative comes at a time of rapid growth in renewable energy and battery storage in the U.S.
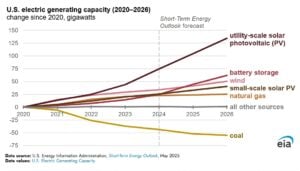
- According to the U.S. Energy Information Administration (EIA), developers plan to add 86 gigawatts (GW) of new utility-scale electricity generation capacity by 2026. If completed, it would be a record increase.
Solar energy will account for over half of these additions, with battery storage the second-largest category. Wind energy also plays a significant role in this growth.
In 2025, the U.S. power sector added 53 GW of new capacity, the highest since 2002. Meanwhile, battery storage installations keep increasing.
- They also expect to add about 24 GW of utility-scale battery storage in 2026, surpassing the previous record of 15 GW installed in 2025. Over the last five years, more than 40 GW of battery storage capacity has been added to the grid.
Texas, California, and Arizona are expected to account for around 80% of the planned battery storage in 2026.
The Grid Advantage of Reusing EV Batteries
Repurposing EV batteries offers crucial benefits for power systems and communities.
First, it extends the useful life of battery materials. Making lithium-ion batteries requires a lot of critical minerals and energy. Second-use batteries maximize the value of those materials.
Second, second-life batteries can lower energy storage costs. Since the batteries have already served in transportation, utilities can access storage capacity at lower costs than buying new systems.
Third, repurposing helps reduce electronic waste. Companies can keep batteries in use for several more years, easing pressure on waste management.
- Most importantly, battery storage boosts grid reliability. Renewable sources like solar and wind don’t produce electricity constantly. Energy storage systems fill this gap by storing power when production is high and delivering it when demand rises.
As renewable energy grows, these storage systems will be vital for stable electricity networks.
Freeman Hall, CEO of B2U Storage Solutions, said:
“This agreement marks a significant milestone in B2U’s mission to provide integrated repurposing services to the automotive industry. By extending the use of these batteries as grid storage, we are monetizing the full potential of EV batteries, now providing crucial stability to the power grid as energy demand continues to grow.”
First Deployments Planned for Texas and California
The first battery storage projects in the Waymo-B2U partnership will focus on Texas and California. Waymo already provides public autonomous ride-hailing services in these states.
Both states lead in renewable energy deployment. California increasingly relies on clean electricity and often has periods where renewable generation exceeds demand. Texas continues to lead the nation in new solar installations.
Waymo plans to repurpose old EV batteries into stationary storage systems. This will help manage renewable energy growth and improve local electricity infrastructure.
The company believes this initiative could deploy hundreds of megawatts of storage capacity in these regions. As autonomous EVs retire, their batteries could continue to provide value long after leaving the road.
This partnership shows how transportation electrification and clean energy can work together. Instead of viewing used EV batteries as waste, Waymo and B2U are transforming them into valuable energy assets. These assets support grid reliability, renewable energy integration, and a sustainable circular economy.
Waymo’s Broader Sustainability Efforts
The battery repurposing program is part of Waymo’s larger sustainability strategy. The company operates one of the largest fleets of fully autonomous electric vehicles, providing over 500,000 paid EV trips each week. These trips help cut emissions by replacing conventional vehicles with electric ones.
- Waymo estimates that every 500,000 weekly trips prevent about 530 tons of carbon dioxide emissions.
It also measures emissions avoided through its autonomous electric service. This framework evaluates the environmental benefits of electric, autonomous, and shared mobility solutions.
Additionally, the company reports its greenhouse gas emissions through parent company Alphabet as part of broader environmental efforts.
The post Waymo and B2U Unlock a Second Life for EV Batteries with Grid-Scale Storage appeared first on Carbon Credits.


-
Greenhouse Gases10 months ago
Guest post: Why China is still building new coal – and when it might stop
-
Climate Change10 months ago
Guest post: Why China is still building new coal – and when it might stop
-

 Greenhouse Gases2 years ago
嘉宾来稿:满足中国增长的用电需求 光伏加储能“比新建煤电更实惠”
-

 Climate Change2 years ago
嘉宾来稿:满足中国增长的用电需求 光伏加储能“比新建煤电更实惠”
-
Climate Change2 years ago
Bill Discounting Climate Change in Florida’s Energy Policy Awaits DeSantis’ Approval
-

 Renewable Energy8 months ago
Sending Progressive Philanthropist George Soros to Prison?
-

 Carbon Footprint2 years ago
US SEC’s Climate Disclosure Rules Spur Renewed Interest in Carbon Credits
-
Greenhouse Gases11 months ago
嘉宾来稿:探究火山喷发如何影响气候预测