

What is Lithium?
Lithium, hailed as the ‘white gold‘ of modern times, is reshaping battery technology. Known for its lightweight nature, unparalleled electrochemical potential, and high energy density, lithium stands at the forefront of energy storage, driving the global transition to renewable energy. Its journey from a basic mineral to a crucial battery component highlights its pivotal role in technological advancement and sustainable energy solutions.
Amid the push for net zero emissions by 2050, lithium assumes paramount importance. The soaring demand necessitates ramped-up production, urging advancements in mining, refining, and sustainable extraction and processing technologies.
As nations and industries align towards a greener future, lithium emerges as a linchpin in driving technical innovation and sustainability efforts. But before lithium turns out to be this important, it’s interesting that this unique element has a fascinating origin story.
Humanity’s interaction with lithium spans just over 200 years. In the 1790s, Brazilian scientist José Bonefácio de Andrada e Silva discovered two new minerals, petalite and spodumene, on the Swedish island of Utö.
Later, in 1817, Swedish scientist Johan August Arfwedson identified a new element in these minerals. Working in the lab of chemist Baron Jöns Jacob Berzelius, Arfwedson isolated a sulfate that did not contain any known alkali or alkaline earth metals. He named this new element lithium, derived from the Greek word “lithos,” meaning stone, due to its grey, stone-like appearance.
Where Does Lithium Come From?
Some of the lithium found in the rechargeable batteries of our smartphones, laptops, and EVs dates back almost 14 billion years ago.
The lithium cycle begins with magma that contains lithium rising to the Earth’s crust during volcanic activity. This magma cools and crystallizes into rocks such as granites or pegmatites. Over thousands of years, weathering breaks down these rocks, releasing lithium salts that flow into rivers. Most of this dissolved lithium ends up in the oceans.
However, in some high mountainous regions like the South American Andes, rivers terminate in closed basins. Here, water evaporation leaves behind lithium-enriched brine in salt flats, known as salars.

Besides these natural deposits, lithium can also be sourced from oilfield brines, geothermal brines, and clays. Although lithium is not rare, it is highly reactive and never found in its pure form in nature. It ranks as the 33rd most abundant element in the Earth’s crust, with an estimated 98 million tonnes.
What Are The Applications and Uses of Lithium?
Lithium stands out for its extraordinary properties. It is the lightest and least dense solid element on the periodic table, with a standard atomic weight of 6.94. Highly reactive, lithium metal ignites on contact with water, a familiar demonstration in chemistry labs.
Consequently, it is only found in mineral or salt forms in nature. In its metallic form, lithium is a soft, silvery-grey metal with excellent heat and electric conductivity, making it ideal for storing and transmitting energy.
Lithium is so soft it can be cut with a knife and has one of the lowest melting points (180.5 °C) and boiling points (1,347°C) among metals. Its high electrode potential and low atomic mass provide a high charge and power-to-weight ratio, which makes lithium especially suitable for use in rechargeable batteries.
Lithium Batteries: Powering the Future
A critical element in the production of rechargeable batteries, lithium is vital for electric vehicles (EVs), hybrids, laptops, and mobile phones. Lithium-ion batteries are favored by car manufacturers for their ability to store significant energy in compact spaces and quick recharge capabilities.

Notably, lithium iron phosphate batteries are esteemed for their safety and durability, making them ideal for stationary storage and secure EV applications.
In the realm of EVs and lithium-ion batteries, two primary types of lithium, lithium carbonate, and lithium hydroxide, dominate. Major lithium producers often supply both variants to meet the demands of EV manufacturers, alongside catering to other industries requiring diverse lithium applications.
Conversely, smaller lithium companies typically specialize in the production of a single lithium type.
Diverse Applications Beyond Batteries
The versatility of lithium goes beyond battery technology, impacting various sectors that leverage its unique properties. In aerospace, lithium’s lightweight yet robust characteristics enhance fuel efficiency and performance in aircraft and spacecraft.
Incorporating lithium into glass and ceramics yields stronger, more durable products with enhanced thermal resistance, ideal for sturdier and more efficient cookware, tiles, and household items.
Furthermore, lithium compounds serve as high-temperature lubricants, enduring extreme conditions to ensure smooth operation for heavy machinery and vehicles under intense stress and temperature. This wide array of applications underscores lithium’s pivotal role, not only in driving cleaner energy solutions like electric vehicles but also in propelling manufacturing processes and product functionalities across diverse industries.
The breadth of its applications underscores global dependence on lithium for technological advancements and sustainability initiatives. But how exactly is lithium produced or mined?
How is Lithium Mined?
Various ways are available to extract lithium, but two major ones exist to produce industrial lithium.
- Conventional Lithium Brine Extraction
The majority of commercial lithium production today comes from extracting lithium from underground brine reservoirs, primarily located in the Lithium Triangle of the Andes (Bolivia, Argentina, and Chile) and in China.

Lithium brine recovery is a straightforward but time-consuming process. Salt-rich water is pumped to the surface and into evaporation ponds. Over months, water evaporates, precipitating various salts and increasing lithium concentration in the remaining brine.
During evaporation, hydrated lime (Ca(OH)2) is added to remove unwanted elements like magnesium and boron. Once lithium concentration is sufficient, the brine is pumped to a recovery facility where the following steps occur:
- Brine purification to remove contaminants.
- Chemical treatment to precipitate desirable products and byproducts.
- Filtration to remove solids.
- Treatment with soda ash (Na2CO3) to precipitate lithium carbonate (Li2CO3).
- Washing and drying of lithium carbonate to produce the final product.
2. Hard Rock Mining
Hard rock mining, more complex and energy-intensive than brine extraction, involves extracting lithium from minerals such as spodumene, lepidolite, petalite, amblygonite, and eucryptite. Spodumene is the most abundant, providing most of the world’s mineral-derived lithium.

Australia leads in spodumene production, with operations also in Brazil, Portugal, southern Africa, and China. New mines are expected in North America and Finland by 2025. The process involves:
- Mining and crushing the ore.
- Roasting at 2012°F (1100°C), cooling to 140°F (65°C), milling, and roasting again with sulfuric acid at 482°F (250°C) (acid leaching).
- During acid leaching, lithium ions replace hydrogen in the acid, forming lithium sulfate and insoluble residue.
- Adding lime to remove magnesium.
- Using soda ash to precipitate lithium carbonate.
- Lime slurry may adjust pH to neutralize excess acid.
3. New Lithium Production Methods
In the US, commercial-scale lithium production mainly comes from a brine operation in Nevada. However, there’s growing pressure to increase domestic production to secure lithium supplies.
Opportunities for new methods include:
- Direct lithium extraction from geothermal brines (e.g., Salton Sea, CA) and produced water from shale gas fracking (Texas).
- Extraction from lithium-bearing clays in Nevada.
Various production methods are being tested, including:
- Acid leaching with sulfuric and hydrochloric acid.
- Using hydrated lime to remove impurities and neutralize waste before returning it to the environment.
These innovations aim to enhance domestic lithium production and ensure a stable supply of this critical metal.
What is The Current State of the Lithium Market?
In the rapidly evolving landscape of the lithium market, competition is fierce and dynamics are swiftly changing. With the price of lithium batteries constituting 40% of an electric vehicle’s production costs, major EV manufacturers like Tesla, Ford, and BYD are actively seeking cost-effective alternatives.
As global aspirations for emission-free transportation by 2050 intensify, about 30 nations have committed to phasing out the sale of new fuel-engine cars, driving demand for critical EV minerals.
China currently leads the lithium battery production market, but the United States and latecomer South Korea are aiming to challenge its dominance. Amid this dynamic environment, understanding the nuances of lithium is crucial. The next sections explore market and price dynamics, the key players, and the outlook associated with the burgeoning lithium industry.
Asia-Pacific’s Dominance and Its Global Impact
The global lithium market has been significantly shaped by the commanding influence of the Asia-Pacific region, spearheaded by economic powerhouses such as China, Japan, and Korea. Recognizing the transformative potential of lithium, especially in battery technology, these nations swiftly invested in the industry, initially targeting consumer electronics and later expanding into EVs.
Their strategic vision included not only production and processing but also the entire lithium supply chain, from extraction to advanced battery manufacturing. This comprehensive approach has granted them considerable leverage over global battery technology trends and pricing dynamics.
In contrast, North America has struggled to keep pace with this rapid progress. Hindered by a fragmented approach and a lack of cohesive strategy and investment, the region’s lithium industry lags behind its Asia-Pacific counterparts.
This disparity has hindered the development of a robust domestic lithium market in North America. This leaves the region vulnerable to supply fluctuations and pricing determinations driven by Asia-Pacific leaders.
China’s stronghold extends beyond LFP batteries, encompassing lithium-ion battery, cathode, and anode production, as well as lithium, cobalt, and graphite processing and refining.
Despite efforts by governments in Europe, the United States, and South Korea to develop domestic battery supply chains, the majority of the EV battery supply chain is expected to remain concentrated in China for the foreseeable future, maintaining its lead in global battery production capacity until 2030, as projected by the International Energy Agency (IEA).
The Shifting Trend in Lithium Batteries
Tesla and Ford Motor, along with other major automakers, have embraced lithium iron phosphate (LFP) batteries as a cost-effective alternative for some of their EVs, moving away from cobalt-based and nickel-based lithium-ion batteries prevalent in Europe and the US. LFP batteries, identified as the most economical lithium-ion battery type in 2022, now constitute around 40% of global EV production. Demand for this battery is projected to rise substantially in the coming years.
Tesla’s shift to LFP batteries at its Shanghai plant since October 2022 signals a broader industry trend. Its peers like Mercedes-Benz Group AG, Volkswagen AG, and Rivian Automotive Inc. also commit to integrating LFPs into their vehicles.
This shift is largely facilitated by Chinese manufacturers like Contemporary Amperex Technology (CATL) and BYD, which dominate the LFP market, accounting for 99% of global LFP battery production. CATL, in particular, stands as the world’s largest EV battery maker, supplying batteries to Tesla and various other automakers.
Understanding Lithium Prices: Key Factors and Trends
The global appetite for lithium has surged, propelled by the burgeoning battery industry and the widespread adoption of lithium-ion batteries in electric vehicles (EVs). This surge in demand casts a glaring spotlight on the current state of lithium supply, underscoring the escalating consumption rates worldwide.
In this segment, we delve into the intricate dynamics of various factors driving the market, examining how the industry is responding to this mounting need. Key factors such as supply and demand dynamics, mining capacities, geopolitical influences, and technological advancements play pivotal roles in shaping the delicate balance between supply and demand.
Understanding these factors is crucial for stakeholders in the lithium industry, from miners to battery manufacturers and investors. Here are the primary elements that impact lithium prices:
Navigating the Supply-Demand Dynamics
The lithium market exhibits characteristics of an immature market. The supply swings between deficit and surplus due to strong growth and infrastructure development challenges.
With rechargeable batteries constituting around 85% of global demand, the surge in EV uptake has led to soaring demand.
However, the slow pace of infrastructure development has hindered supply growth, resulting in price spikes in 2022. As EV subsidies decrease and prices normalize, we anticipate a controlled decline, settling around $20,000 per tonne by the decade’s end.
Therefore, any imbalance in the supply and demand equation directly affects prices. Any oversupply can depress prices until demand catches up.
Conversely, a surge in demand, driven by the EV boom, can outpace supply, pushing prices up. This is exactly what happened in November 2022 when a record-breaking lithium price rally happened, reaching over five-fold increase.

Unraveling Geopolitical Influences
Geopolitical factors significantly influence the lithium market due to the concentration of lithium reserves in specific regions. Countries like Australia, Chile, and Argentina hold substantial lithium reserves and are major players in the global supply chain. Political stability in these countries is crucial. Any political unrest or policy changes can disrupt supply and affect global prices.
Moreover, government policies regarding mining operations, environmental standards, and export regulations can also impact lithium production and prices. Favorable policies can boost production, while restrictive regulations can hinder it.
International trade policies, including tariffs and trade agreements, further influence the flow of lithium across borders. For example, trade tensions between major economies can lead to tariffs on lithium products, affecting global supply chains and prices.
This is what happen recently with the United States announcing its plan to increase tariffs on Chinese imports, including EVs, batteries, and solar cells.
Breaking Down Technological Developments
Advancements in technology have a dual impact on lithium prices by affecting both demand and supply.
- Battery Technology: Breakthroughs in battery technology can significantly influence lithium demand. The development of alternative battery chemistries, such as solid-state batteries or sodium-ion batteries, could reduce reliance on lithium, potentially decreasing its demand and price. On the other hand, innovations that enhance lithium-ion battery performance can boost demand.
- Extraction and Processing Technologies: Technological improvements in lithium extraction and processing can increase supply efficiency and reduce production costs. For example, advancements in direct lithium extraction (DLE) techniques can make it easier and more cost-effective to extract lithium from brine resources, positively impacting prices.
Disentangling Environmental Regulations
Environmental considerations are increasingly shaping the lithium market today.
Stricter environmental regulations on mining practices can limit lithium supply and drive up prices. Mining operations must comply with environmental standards to mitigate their impact on ecosystems and water resources, which can increase operational costs.
Furthermore, the growing emphasis on reducing the environmental footprint of lithium extraction is prompting the industry to adopt greener practices. These sustainable techniques, such as using renewable energy in mining operations and recycling water, may initially increase costs. However, they are expected to lead to long-term sustainability and potentially stabilize prices.
There is also rising pressure from consumers and investors for companies to adhere to environmental, social, and governance (ESG) criteria. Companies that prioritize sustainable and ethical practices may gain a competitive edge, influencing market dynamics and prices.
Quality Challenges in Battery-Grade Lithium Production
As lithium increasingly powers rechargeable batteries, ensuring high-quality lithium products for battery use becomes paramount. Producing battery-grade lithium involves intricate refining processes to meet stringent quality and purity standards.
New refineries typically start with lower-quality technical-grade lithium, necessitating refining improvements to achieve battery-grade purity. Consequently, despite an overall supply surplus, the battery-grade lithium market may face short-term constraints until refining operations are optimized.
What are the Top Lithium Producing Countries?
In 2023, three countries – Australia, Chile, and China – dominated global lithium production, collectively accounting for 88% of the total output.

Australia: Leading the Charge
Australia stands as the world’s top lithium producer, sourcing the mineral directly from hard-rock mines, particularly spodumene. Over the past decade, Australia witnessed a remarkable surge in production. In 2013, output stood at 13,000 metric tons, soaring to an impressive 86,000 metric tons by 2023.
Chile: Brine Extraction Expert
Chile follows closely behind Australia in lithium production, albeit with more modest growth. The South American nation primarily extracts lithium from brine sources, with production climbing from 13,500 tonnes in 2013 to 44,000 metric tons in 2023.
China: Closing the Gap
China, also harnessing lithium from brine, has been steadily approaching Chile’s production levels. From a modest 4,000 metric tons in 2013, China ramped up domestic production to 33,000 metric tons in 2023.
Additionally, Chinese companies have expanded their influence in the global lithium market, with three of them ranking among the top lithium mining entities. Tianqi Lithium, the largest among them, holds a significant stake in Greenbushes, the world’s largest hard-rock lithium mine in Australia.
Argentina: A Rising Contender
Argentina emerges as the fourth-largest lithium producer, tripling its output over the past decade. With increased investments from international players, Argentina aims to further enhance its lithium production capacity.
With major producers scaling up to meet the surging demand, particularly from the clean energy sector like electric vehicle batteries, the lithium market recently experienced a surplus. This oversupply led to a significant price collapse of over 80% from the record highs witnessed in late 2022.
How to Invest in Lithium? Stocks, ETFs, and Derivatives
Due to the nascent stage of the lithium market, the range of investment products available is relatively limited compared to other commodities. Nevertheless, investors can still tap into this dynamic market through two primary avenues: lithium stocks and lithium ETFs.
Lithium Stocks:
Investing in individual stocks remains one of the most direct ways to gain exposure to the lithium industry. However, it’s crucial to recognize that stocks serve as proxies for the market’s performance.
The soaring costs of lithium don’t always translate into corresponding increases in lithium stock prices. Establishing new mining operations can be capital-intensive, and ultimately, a stock’s valuation hinges on the company’s financial health. Despite this caveat, lithium stocks have demonstrated robust performance over the past five years.
Investing in lithium stocks offers several benefits. Firstly, individual lithium stocks provide significant earning potential if the company performs well. Additionally, many lithium stocks pay dividends, offering investors regular income that can be reinvested to bolster portfolio growth.
Moreover, some lithium producers have alternative revenue streams, which can help mitigate the volatility associated with lithium prices. However, investing in lithium stocks also entails certain risks. For instance, putting all investments into one or two lithium stocks can result in a lack of diversification in the portfolio.
Furthermore, the return on lithium stocks is heavily dependent on the financial health of the company, necessitating regular updates on the company’s fundamentals and thorough research.
Lithium ETFs
For investors seeking exposure to the lithium market without the time-intensive task of researching individual stocks, lithium exchange-traded funds (ETFs) offer a convenient option. These ETFs track an index composed of a diversified collection of lithium stocks, providing you with instant access to a broad portfolio that includes both lithium producers and manufacturers.
Here are two prominent lithium ETFs:
- Global X Lithium & Battery Tech ETF (LIT): LIT comprises 39 different lithium and battery stocks. With $4.5 billion in assets under management, this ETF charges an annual fee of 0.75%.
- Amplify Lithium & Battery Technology ETF (BATT): BATT is solely focused on lithium battery providers. Holding $194 million in assets, this ETF charges an annual fee of 0.59%.
Investing in lithium ETFs presents its own set of benefits. ETFs provide instant diversification across a broad range of lithium-focused stocks, thereby reducing the risk associated with individual stock selection. Also, ETFs spread investment risk across a large portfolio of stocks, making them less risky than individual stocks.
Furthermore, similar to individual stocks, some lithium ETFs offer dividend schemes, providing investors with the opportunity for positive cash flow. Nevertheless, there are risks associated with investing in lithium ETFs as well.
For example, during upward trends in the lithium market, returns from ETFs may not be as substantial as those from individual stocks. And take note, ETFs are not free products; providers charge investors a percentage fee for operating and maintaining the ETF.
Direct Investment Through Commodities Market
For those interested in direct investment, lithium can be traded in the commodities market through futures and options. These derivatives allow you to buy and sell access to lithium as a material, though they come with significant risk and volatility, making them unsuitable for inexperienced investors.
Futures Contracts
A futures contract is an agreement to buy or sell a commodity at a future date for a specified price. There are two types:
Standard Futures Contracts: You commit to buying the actual commodity. If you hold the contract until expiration, you must purchase the physical lithium.
Cash Settlement Futures Contracts: Instead of exchanging the physical commodity, the parties settle the contract’s value in cash.
Options Contracts
Options contracts allow you to trade the value of an asset, with the added flexibility of choosing whether to execute the contract at expiration. This differs from futures contracts, which must be executed regardless of market conditions. When buying an options contract, you pay an upfront fee known as a “premium.”
Investing in lithium offers several pathways, including stocks of lithium producers or users, funds that aggregate lithium-related equities, and direct commodity trading through futures and options. Each method carries different levels of risk and complexity, catering to various investor preferences and experience levels.
Who are the Major Lithium Companies?
1. ALBEMARLE: Market cap: US$14 billion
Albemarle, based in North Carolina, stands as the largest lithium company by market cap and the world’s leading lithium producer, boasting over 7,000 global employees. Following a 2022 realignment, Albemarle now operates two primary business units, with a particular focus on lithium-ion battery and energy transition markets under its Albemarle Energy Storage unit. This division oversees lithium carbonate, hydroxide, and metal production.
With operations spanning Chile, Australia, and the US, Albemarle holds a diverse portfolio of lithium mines and facilities. In Chile, the company produces lithium carbonate at its La Negra conversion plants, leveraging brine from the Salar de Atacama.
In the US, Albemarle aims to bolster domestic production in line with the Inflation Reduction Act. It owns the Silver Peak lithium brine operations in Nevada’s Clayton Valley, set to double lithium production by 2025. Albemarle received a $90 million critical materials award from the US Department of Defense in September 2023 to enhance domestic lithium production and support the EV battery supply chain.
Additionally, the company plans to revive the Kings Mountain lithium mine in North Carolina, backed by US government funding. Albemarle also plans to develop the Albemarle Technology Park in North Carolina for advanced R&D in lithium innovation.
2. SQM: Market cap: US$12.07 billion
SQM, a chemicals giant operates in over 20 countries, serving customers across 110 nations. The company’s diverse business areas span lithium, potassium, and specialty plant nutrition.
Primarily operating in Chile, SQM extracts brine from the Salar de Atacama and processes lithium chloride into lithium carbonate and hydroxide at its Salar del Carmen lithium plants near Antofagasta. The company is expanding production at Salar del Carmen from 180,000 MT to 210,000 MT, initiating this year.
To mitigate environmental impact, SQM announced a $1.5 billion investment in the Salar Futuro project, focusing on advanced evaporation technologies, direct lithium extraction, and a seawater desalination plant.
Despite uncertainty stemming from Chile’s National Lithium Strategy, SQM’s existing contracts, extending through 2030, are expected to be respected by the government. In early 2024, a partnership formed between SQM and state-owned mining company CODELCO, with CODELCO holding a majority control stake.
In Australia, SQM is developing the Mount Holland lithium project, recognized as one of the world’s largest hard-rock deposits, in partnership with Wesfarmers. Anticipating lithium hydroxide production to commence by H1 2025, SQM’s lithium carbonate capacity was projected to reach 210,000 tons by the beginning of 2024.
3. Tianqi Lithium: Market cap: US$10.43 billion
Tianqi Lithium is a subsidiary of Chengdu Tianqi Industry Group based in China. As the world’s largest hard-rock lithium producer, Tianqi Lithium operates assets in Australia, Chile, and China. The company holds a notable stake in SQM, having acquired a 2.1% share in 2016, later increasing it to 23.77%.
In Australia, Tianqi owns the Greenbushes mine, acquired in 2012 through the purchase of Talison Lithium. The company also developed a lithium hydroxide plant in Western Australia’s Kwinana Industrial Area, commencing production in Q3 2019. Subsequent output began in mid-2021.
Rising lithium prices and its Hong Kong listing in 2022, which raised approximately US$1.7 billion, contributed to Tianqi’s buoyancy. Commercial production at Kwinana’s Train 1 commenced in December 2022, with Train 2 anticipated to start in 2024. Once operational, the hydroxide plant is projected to produce 48,000 MT per year, utilizing lithium from Greenbushes.
In February of the current year, Tianqi Lithium updated its total mineral reserves at Greenbushes to 447 million tonnes, with an average lithium oxide grade of 1.5%, equivalent to about 16 million tonnes of lithium carbonate.

What is In Store for Lithium?
Forecasting lithium supply beyond the end of the decade presents challenges due to limited visibility into existing, planned, and potential projects. While projections until 2030 can be reasonably accurate, the landscape becomes murkier.
On the demand side, projections suggest that it will tremendously to almost 4 million tonnes, as shown below. But of course, as discussed earlier, various trends impact this demand trajectory.

Incentive pricing becomes a critical factor in determining the attractiveness of new projects. With an estimated 1.5 million tonnes of supply, the fully allocated cost of lithium would be around $15,000 per tonne, suggesting market pricing would exceed this threshold.
Navigating the Immaturity of the Lithium Market
Forecasting the future of the lithium market is hindered by its relative immaturity. Lack of globally accepted specifications and pricing anchors complicates pricing dynamics.
Lithium products, akin to specialty chemicals, require precise specifications, yet the industry’s growth trajectory impedes standardization efforts. While greater standardization is anticipated in the future, it will evolve gradually.
According to Bloomberg estimates, demand for lithium-ion batteries will increase tenfold over the next decade. This surge in demand is largely driven by the global commitment of over 100 countries to achieve net zero emissions within the coming decades.

As part of this commitment, many nations are turning to the electrification of transportation as a crucial solution to reduce GHG emissions and combat climate change. This shift towards electrification underscores the growing importance of lithium-ion batteries in powering EVs and other clean energy technologies.
The Role of Partnerships in Shaping the Lithium Industry
In 2022, a significant portion of lithium supply was dominated by a handful of companies. However, future industry dynamics are expected to witness a decline in their market share, as smaller firms expand and new ventures emerge.
While horizontal integration may not be a prevailing trend, vertical integration is poised to play a pivotal role. Partnerships between miners and refiners offer mutual benefits, enabling risk-sharing and capital investment in new projects.
Collaborative efforts between upstream and downstream operations enhance expertise, improve margins, and capture a larger market share. Such partnerships, exemplified by ventures like Pilbara Minerals and POSCO in South Korea and SQM and Wesfarmers in Western Australia, are anticipated to become increasingly common in the industry’s future landscape.
Conclusion
The evolution of lithium, from its discovery over two centuries ago to its pivotal role in powering modern technology, underscores its significance in shaping our present and future. As the world accelerates towards a sustainable energy paradigm, lithium emerges as the linchpin of this transition, fueling advancements in battery technology and driving the proliferation of electric vehicles and renewable energy storage solutions.
The post The Ultimate Guide to Lithium and Lithium Prices appeared first on Carbon Credits.
Carbon Footprint
Philippines Taps Blue Carbon and Biodiversity Credits to Protect Coasts and Climate

The Philippines is stepping up efforts to protect its coastal ecosystems. The government recently advanced its National Blue Carbon Action Partnership (NBCAP) Roadmap. This plan aims to conserve and restore mangroves, seagrass beds, and tidal marshes. It also explores biodiversity credits — a new market linked to nature conservation.
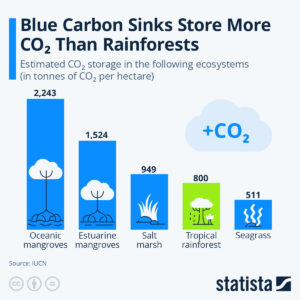
Blue carbon refers to the carbon stored in coastal and marine ecosystems. These habitats can hold large amounts of carbon in plants and soil. Mangroves, for example, store carbon at much higher rates than many land forests. Protecting them reduces greenhouse gases in the atmosphere.
Biodiversity credits are a related concept. They reward actions that protect or restore species and ecosystems. They work alongside carbon credits but focus more on ecosystem health and species diversity. Markets for biodiversity credits are being discussed globally as a complement to carbon markets.
Why the Philippines Is Targeting Blue Carbon
The Philippines is rich in coastal ecosystems. It has more than 327,000 hectares of mangroves along its shores. These areas protect coastlines from storms, support fisheries, and store carbon.
Mangroves and seagrasses also support high levels of biodiversity. Many fish, birds, and marine species depend on these habitats. Restoring these ecosystems helps conserve species and supports local food systems.
The NBCAP Roadmap was handed over to the Department of Environment and Natural Resources (DENR) during the Philippine Mangrove Conference 2026. The roadmap is a strategy to protect blue carbon ecosystems while linking them to climate goals and local livelihoods.
DENR Undersecretary, Atty. Analiza Rebuelta-Teh, remarked during the turnover:
“This Roadmap reflects the Philippines’ strong commitment to advancing blue carbon accounting and delivering tangible impact for coastal communities.”
Edwina Garchitorena, country director of ZSL Philippines, which will oversee its implementation, also commented:
“The handover of the NBCAP Roadmap to the DENR represents a turning point in advancing blue carbon action and strengthening the Philippines’ leadership in coastal conservation in the region.”
The plan highlights four main pillars:
- Science, technology, and innovation.
- Policy and governance.
- Communication and community engagement.
- Finance and sustainable livelihoods.
These pillars aim to strengthen coastal resilience, support community well‑being, and align blue carbon action with national climate commitments.
What Blue Carbon Credits Could Mean for Markets
Globally, blue carbon markets are growing. These markets allow coastal restoration projects to sell carbon credits. Projects that preserve or restore mangroves, seagrass meadows, and tidal marshes can generate credits. Buyers pay for these credits to offset emissions.
According to Grand View Research, the global blue carbon market was valued at US$2.42 million in 2025. It is projected to reach US$14.79 million by 2033, growing at a compound annual growth rate (CAGR) of almost 25%.
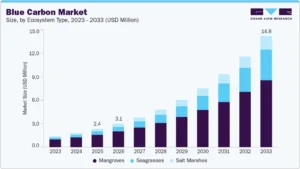
The Asia Pacific region led the market in 2025, with 39% of global revenue, due to its extensive coastal ecosystems and government support. Within the market, mangroves accounted for 68% of revenue, reflecting their high carbon storage capacity.
Blue carbon credits belong to the voluntary carbon market. Companies purchase these credits to offset emissions they can’t eliminate right now. Buyers are often motivated by sustainability goals and environmental, social, and corporate governance (ESG) standards.
Experts at the UN Environment Programme say these blue habitats can capture carbon 4x faster than forests:
Why Biodiversity Credits Matter: Rewarding Species, Strengthening Ecosystems
Carbon credits aim to cut greenhouse gases. In contrast, biodiversity credits focus on saving species and habitats. These credits reward projects that improve ecosystem health and may be used alongside carbon markets to attract finance for nature.
Biodiversity credits are particularly relevant in the Philippines, one of 17 megadiverse countries. The nation is home to thousands of unique plant and animal species. Supporting biodiversity through market mechanisms can strengthen conservation efforts while also supporting local communities.
Globally, biodiversity credit markets are still developing. Organizations such as the Biodiversity Credit Alliance are creating standards to ensure transparency, equity, and measurable outcomes. They want to link private investment to good environmental outcomes. They also respect the rights of local communities and indigenous peoples.
These markets complement carbon markets. They can support conservation efforts. This boosts ecosystem resilience and protects species while also capturing carbon.
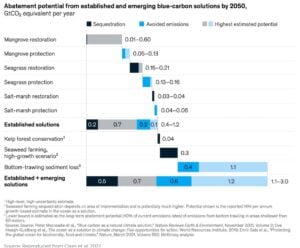
Together with blue carbon credits, they form part of a broader nature-based solution to climate change and biodiversity loss. A report by the Ecosystem Marketplace estimates the potential carbon abatement for every type of blue carbon solution by 2050.
Science, Policy, and Funding: The Roadblocks Ahead
Building blue carbon and biodiversity credit markets is not easy. There are several challenges ahead for the Philippines.
One key challenge is measurement and verification. To sell carbon or biodiversity credits, projects must prove they deliver real and measurable benefits. This requires science‑based methods and monitoring systems.
Another challenge is finance. Case studies reveal that creating a blue carbon action roadmap in the Philippines may need around US$1 million. This funding will help set up essential systems and support initial actions.
Policy frameworks are also needed. Laws and rules must support credit issuance, protect local rights, and ensure fair sharing of benefits. Coordination across government agencies, local communities, and investors will be important.
Stakeholder engagement is key. The NBCAP Roadmap and related forums involve scientists, policymakers, civil society, and private sector partners. This teamwork approach makes sure actions are based on science, inclusive, and fair in the long run.
Looking Ahead: Coastal Conservation as Climate Strategy
Blue carbon and biodiversity credits could provide multiple benefits for the Philippines. Protecting and restoring coastal habitats reduces greenhouse gases, conserves species, and supports local economies. Coastal ecosystems also provide natural defenses against storms and rising seas.
If blue carbon and biodiversity credit markets grow, they could fund coastal conservation at scale while supporting global climate targets. Biodiversity credits could further enhance ecosystem protection by linking nature’s intrinsic value to market mechanisms.
The market also involves climate finance and corporate buyers looking for quality credits. Additionally, international development partners focused on coastal resilience may join in.
For the Philippines, the next few years will be critical. Implementing the NBCAP roadmap, establishing credit systems, and strengthening governance could unlock new opportunities for climate action, sustainable development, and regional leadership in blue carbon finance.
The post Philippines Taps Blue Carbon and Biodiversity Credits to Protect Coasts and Climate appeared first on Carbon Credits.

The global electric vehicle (EV) market is gaining speed again. A sharp rise in oil prices, triggered by the recent U.S.–Iran conflict in early 2026, has changed how consumers think about fuel and mobility. What looked like a slow market just months ago is now showing strong signs of recovery.
According to SNE Research’s latest report, this sudden shift in energy markets is pushing EV adoption faster than expected. Rising gasoline costs and uncertainty about future oil supply are driving buyers toward electric cars. As a result, the EV transition is no longer gradual—it is accelerating.
Oil Price Shock Changes Consumer Behavior
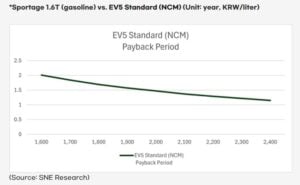
The conflict in the Middle East sent oil markets into turmoil. Gasoline prices jumped quickly, rising from around 1,600–1,700 KRW per liter to as high as 2,200 KRW. This sudden spike acted as a wake-up call for many drivers.
Consumers who once hesitated to switch to EVs are now rethinking their choices. High and unstable fuel prices have made traditional gasoline vehicles less attractive. At the same time, EVs now look more cost-effective and reliable over the long term.
SNE Research noted that even if oil prices stabilize later, the fear of future spikes will remain. This uncertainty is a key driver behind early EV adoption. People no longer want to depend on volatile fuel markets.
EV Growth Forecasts Get a Major Boost
SNE Research has revised its global EV outlook. The firm now expects faster adoption across the decade.
- EV market penetration is projected to reach 29% in 2026, up from an earlier estimate of 27%.
- By 2027, the share could jump to 35%, instead of the previously expected 30%.
- Most importantly, EVs are now expected to cross 50% of new car sales by 2030, earlier than prior forecasts.

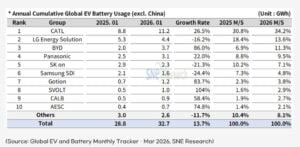
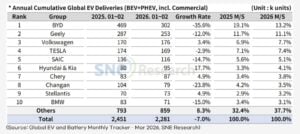
The post Global EV Sales Set to Hit 50% by 2030 Amid Oil Shock While CATL Leads Batteries appeared first on Carbon Credits.
Carbon Footprint
AI Data Centers Power Crisis: Massive Energy Demand Threatens Emissions Targets and Latest Delays Signal Market Shift

The rapid growth of artificial intelligence (AI) is creating a new challenge for global energy systems. AI data centers now require far more electricity than traditional computing facilities. This surge in demand is putting pressure on power grids and raising concerns about whether climate targets can still be met.
Large AI data centers typically need 100 to 300 megawatts (MW) of continuous power. In contrast, conventional data centers use around 10-50 MW. This makes AI facilities up to 10x more energy-intensive, depending on the scale and workload.
AI Data Centers Are Driving a Sharp Rise in Power Demand
The increase is happening quickly. The International Energy Agency estimates that global data center electricity use reached about 415 terawatt-hours (TWh) in 2024. That number could rise to more than 1,000 TWh by 2026, largely driven by AI applications such as machine learning, cloud computing, and generative models. 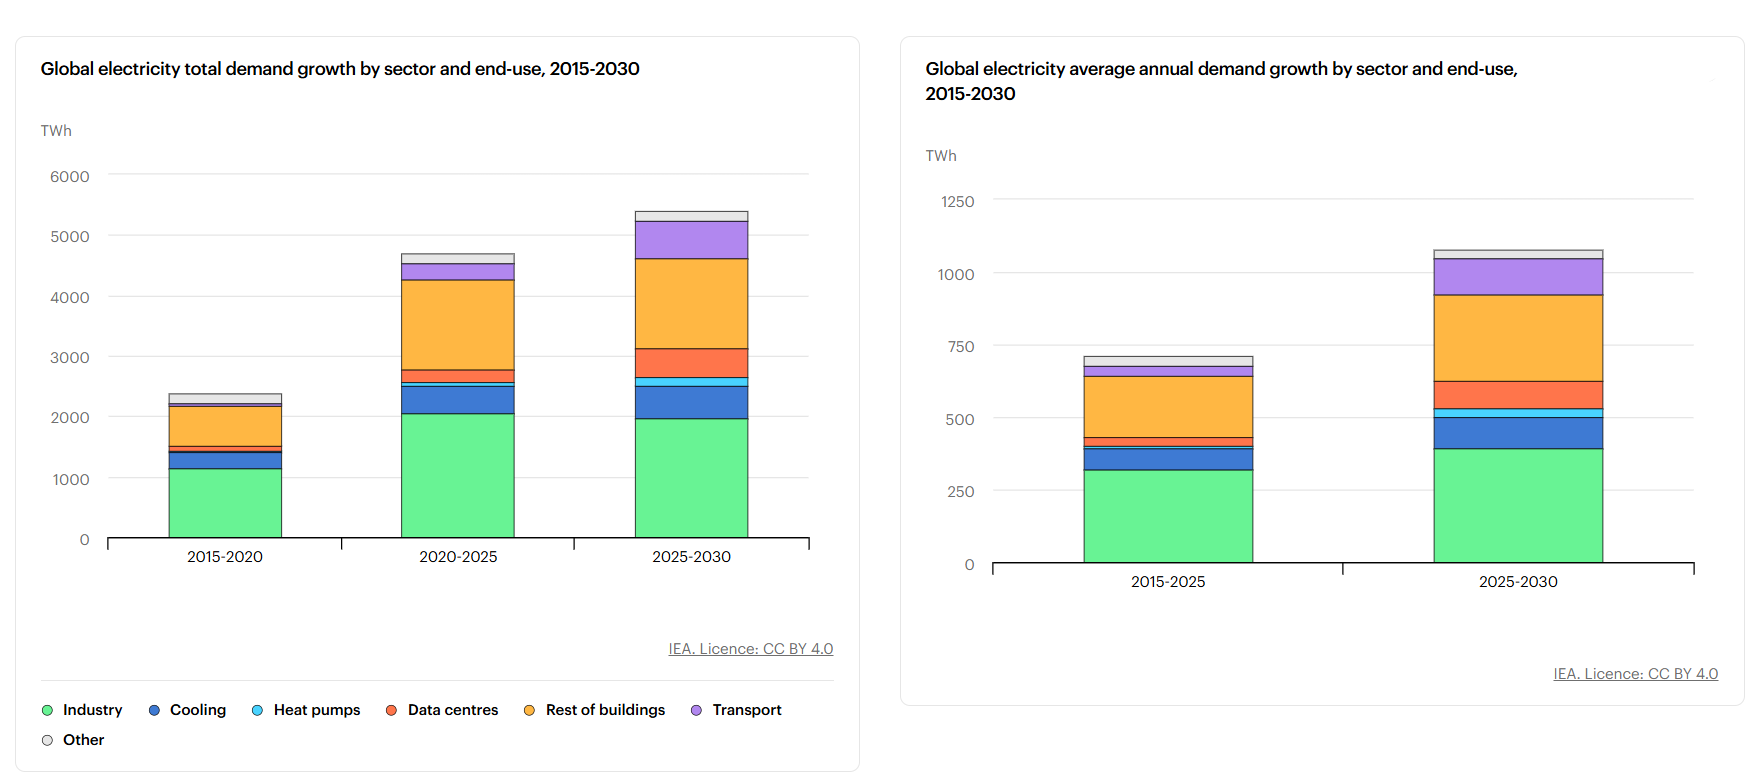
At that level, data centers would consume as much electricity as an entire mid-sized country like Japan.
In the United States, the impact is also growing. Data centers could account for 6% to 8% of total electricity demand by 2030, based on utility projections and grid operator estimates. AI is expected to drive most of that increase as companies continue to scale infrastructure to support new applications.
Training large AI models is especially energy-intensive. Some estimates say an advanced model can use millions of kilowatt-hours (kWh) just for training. For instance, training GPT-3 needs roughly 1.287 million kWh, and Google’s PaLM at about 3.4 million kWh. Analytical estimates suggest training newer models like GPT-4 may require between 50 million and over 100 million kWh.
That is equal to the annual electricity use of hundreds of households. When combined with ongoing usage, known as inference, total energy consumption rises even further.
This rapid growth is creating a gap between electricity demand and available supply. It is also raising questions about how the technology sector can expand while staying aligned with global climate goals.
The Grid Bottleneck: Why Data Centers Are Waiting Years for Power
Power demand from AI is rising faster than grid infrastructure can support. Utilities in key regions are now facing a surge in interconnection requests from technology companies building new data centers.
This has led to delays in several major projects. In many cases, developers must wait years before they can secure enough electricity to operate. These delays are becoming more common in established tech hubs where grid capacity is already stretched.
The main constraints include:
- Limited transmission capacity in high-demand areas,
- Slow grid upgrades and long permitting timelines, and
- Regulatory systems not designed for AI-scale demand.
Grid stability is another concern. AI data centers require constant and uninterrupted power. Even short disruptions can affect performance and reliability. This makes it more difficult for utilities to balance supply and demand, especially during peak periods.
In some regions, utilities are struggling to manage the size and concentration of new loads. A single large data center can use as much electricity as a small city. When several projects are planned in the same area, the pressure on local infrastructure increases significantly.
As a result, some companies are rethinking their expansion strategies. Projects may be delayed, scaled down, or moved to new locations where energy is more accessible. These shifts could slow the pace of AI deployment, at least in the short term.
Renewable Energy Growth Faces a Reality Check
Technology companies have made strong commitments to clean energy. Many aim to power their operations with 100% renewable electricity. This is part of their larger environmental, social, and governance (ESG) goals.
For example, Microsoft plans to become carbon negative by 2030, meaning it will remove more carbon than it emits. Google is targeting 24/7 carbon-free energy by 2030, which goes beyond annual matching to ensure clean power is used at all times. Amazon has committed to reaching net-zero carbon emissions by 2040 under its Climate Pledge.
Despite these targets, AI data centers present a difficult challenge. They need reliable electricity around the clock, while renewable energy sources such as wind and solar are not always available. Output can vary depending on weather conditions and time of day.
To maintain stable operations, many facilities rely on a mix of energy sources. This often includes grid electricity, which may still be partly generated from fossil fuels. In some cases, natural gas backup systems are used more frequently than planned.
Battery storage can help balance supply and demand. However, long-duration storage remains expensive and is not yet widely deployed at the scale needed for large AI facilities. This creates both technical and financial barriers.
Thus, there is a growing gap between corporate clean energy goals and real-world energy use. Closing that gap will require faster deployment of renewable energy, improved storage solutions, and more flexible grid systems.
Carbon Credits Use Surge as Tech Tries to Close the Emissions Gap
The mismatch between AI growth and clean energy supply is also affecting carbon markets. Many technology companies are increasing their use of carbon credits to offset emissions linked to data center operations.
According to the World Bank’s State and Trends of Carbon Pricing 2025, carbon pricing now covers over 28% of global emissions. But carbon prices vary widely—from under $10 per ton in some systems to over $100 per ton in stricter markets. This gap is pushing companies toward voluntary carbon markets.

The Ecosystem Marketplace report shows rising demand for high-quality credits, especially carbon removal rather than avoidance credits. But supply is still limited.
Costs are especially high for engineered removals. The IEA estimates that direct air capture (DAC) costs today range from about $600 to over $1,000 per ton of CO₂. It may fall to $100–$300 per ton in the future, but supply is still very small.
Companies are focusing on credits that:
- Deliver verified emissions reductions,
- Support long-term carbon removal, and
- Align with ESG and net-zero commitments.
At the same time, many firms are taking a more active role in energy development. Instead of relying only on offsets, they are investing directly in renewable energy projects. This includes funding new solar and wind farms, as well as entering long-term power purchase agreements.
These investments help secure a dedicated clean energy supply. They also reduce long-term exposure to carbon markets, which can be volatile and subject to changing standards.
Companies Are Adapting Their Energy Strategies: The New AI Energy Playbook
AI companies are changing how they design and operate data centers to manage rising energy demand. Here are some of the key strategies:
- Energy efficiency improvements (new hardware and cooling systems) that reduce data center power use.
- More efficient AI chips, specialized processors, that drive performance gains.
- Advanced cooling systems that cut energy waste and can help cut total power use per workload by 20% to 40%.
- Data center location strategy is shifting, where facilities are built in regions with stronger renewable energy access.
- Infrastructure is becoming more distributed, where firms deploy smaller data centers across multiple locations to balance demand and improve resilience.
- Long-term renewable energy contracts are expanding, which helps companies secure power at stable prices.
A Turning Point for Energy and Climate Goals
The rise of AI is creating both risks and opportunities for the global energy transition. In the short term, increased electricity demand could lead to higher emissions if fossil fuels are used to fill supply gaps.
At the same time, AI is driving major investment in clean energy and infrastructure. The long-term outcome will depend on how quickly clean energy systems can scale.
If renewable supply, storage, and grid capacity keep pace with AI growth, the technology sector could help accelerate the shift to a low-carbon economy. If progress is too slow, however, AI could become a major new source of emissions.
Either way, AI is now a central force shaping global energy demand, infrastructure investment, and the future of carbon markets.
The post AI Data Centers Power Crisis: Massive Energy Demand Threatens Emissions Targets and Latest Delays Signal Market Shift appeared first on Carbon Credits.


-
Climate Change8 months ago
Guest post: Why China is still building new coal – and when it might stop
-
Greenhouse Gases8 months ago
Guest post: Why China is still building new coal – and when it might stop
-

 Greenhouse Gases2 years ago
嘉宾来稿:满足中国增长的用电需求 光伏加储能“比新建煤电更实惠”
-
Climate Change2 years ago
Bill Discounting Climate Change in Florida’s Energy Policy Awaits DeSantis’ Approval
-

 Climate Change2 years ago
嘉宾来稿:满足中国增长的用电需求 光伏加储能“比新建煤电更实惠”
-
Climate Change Videos2 years ago
The toxic gas flares fuelling Nigeria’s climate change – BBC News
-

 Renewable Energy6 months ago
Sending Progressive Philanthropist George Soros to Prison?
-

 Carbon Footprint2 years ago
US SEC’s Climate Disclosure Rules Spur Renewed Interest in Carbon Credits