
Tesla today released its third-quarter 2025 results. The company posted $28.1 billion in revenue, up 12 % compared with a year ago. Net income narrowed sharply to $1.4 billion, down roughly 37 % from the same quarter in 2024. The gross margin stood at about 18 %, down from 19.8 % a year earlier.
Vehicle deliveries reached a record 497,099 units, driven largely by strong demand ahead of the U.S. federal EV tax-credit expiration. Energy storage deployments grew, but Tesla reported a revenue drop.
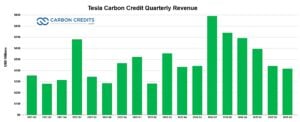
More notably, sales from regulatory credits, also known as carbon credits, fell to $417 million, down 44% from last year.
Tesla highlighted operational strength in production and clean energy expansion. It also recognized outside pressures. These included falling carbon credit sales, higher costs, and a more competitive EV market. All of these factors affected profit margins.
CEO Elon Musk said Tesla is “staying focused on cost control and scaling clean energy.” He added that the company is improving factory automation and AI systems while expanding into new markets.
Carbon Credits Lose Power
Tesla’s carbon credit sales fell again in Q3. The company earned $417 million from selling credits, down 44% compared with $739 million a year earlier.
For years, these credits have provided Tesla with extra income. The company makes money by selling zero-emission vehicles. Then, it sells the credits to automakers that don’t meet emission standards.
Major buyers include Stellantis (formerly Fiat Chrysler) and General Motors. They use Tesla’s credits to reduce higher fleet emissions. In Europe, Toyota, Ford, Mazda, and Subaru have joined pooling arrangements linked to Tesla and other EV makers. These credit deals remain a key income source for Tesla, even as rival automakers expand their own EV lineups.
Between 2019 and 2024, Tesla made more than $11.8 billion in credit sales. But as other automakers launch more electric models, demand for Tesla’s credits is declining. Analysts say this trend will continue as the EV market matures and countries tighten credit systems.
However, expected revenues will gradually decline. This will happen as global manufacturers meet stricter carbon standards and depend less on external credits.
Tesla’s CFO noted that while carbon credit income still helps overall results, it is now a smaller part of the company’s total revenue. The company’s goal is to rely on vehicle and energy product sales instead of external credits in the long run.
ESG Edge: Tesla’s Ongoing Climate Impact
Tesla continues to lead in cutting transportation-related emissions through its EVs and renewable energy systems. In 2025, the company estimated that its global fleet helped avoid more than 20 million tons of CO₂ compared with gas-powered vehicles.
Its Gigafactories use renewable power where possible. For example:
- The Nevada Gigafactory sources most of its electricity from solar panels and nearby renewables.
- The Texas Gigafactory plans to reach 100% renewable electricity by 2026.
- The Berlin-Brandenburg Gigafactory uses energy from wind and solar farms in Germany.
In 2024, Tesla said its operations emitted around 1.6 million tons of CO₂-equivalent, mostly from manufacturing. However, it aims to reach net-zero operations by 2030, partly through on-site renewables and energy efficiency upgrades.
The company’s battery recycling program also expanded this year. Tesla said it processed over 10,000 tons of battery materials in 2025, recovering more than 90% of key metals such as nickel, lithium, and cobalt. This helps reduce both mining demand and production costs.
Market Reaction and Stock Outlook
Tesla’s stock traded lower after the Q3 results. Investors focused on shrinking profit margins and weaker credit income. Shares fell about 4% in after-hours trading following the announcement.
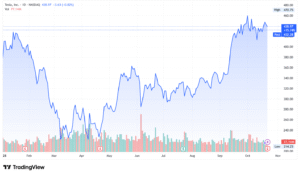
However, analysts noted that Tesla’s strong vehicle deliveries and growing energy business remain long-term positives. The company still holds about $29 billion in cash, giving it flexibility for new factory investments and product launches.
Tesla is also developing new products that could shape its next growth phase:
- Cybertruck deliveries are ramping up, with full-scale production expected in 2026.
- The next-generation “Redwood” compact EV is under development, targeting a lower-price market.
- The Dojo AI supercomputer continues to expand to improve autonomous-driving systems.
Analysts project that Tesla’s annual deliveries could reach 1.9 million units in 2025, up from 1.8 million in 2024. But the company must maintain cost control and increase battery supply to stay competitive.
Tesla remains the top global EV brand, but its market share is shrinking. Companies like BYD, Hyundai, Volkswagen, and GM are expanding fast. BYD alone sold over 3 million EVs in 2024, close to Tesla’s total deliveries.

Costs are another challenge. Prices for lithium and nickel, key battery metals, have been volatile. Benchmark Mineral Intelligence reported that lithium carbonate prices rose nearly 25% in early 2025 after a sharp fall in 2024.
Tesla is working to reduce these risks through in-house battery production and supply deals. It is also developing its “Optimus” robot and expanding its Full Self-Driving (FSD) software, which could bring new recurring revenue in the future.
Policy Shifts and the Carbon Economy
Tesla’s position in carbon markets is also tied to global climate policy trends. The federal EV tax credits ended in 2025 after new legislation. The change removed the $7,500 credit for many new EV buyers and the $4,000 used-EV credit.
This shift reduces a key buyer incentive in the U.S. and may affect EV demand and pricing going forward. Meanwhile, in Europe, new carbon border taxes could make manufacturing outside the region more costly.
Globally, voluntary carbon markets are growing by about 20% each year. However, regulators are pushing for stricter verification standards.
Tesla’s carbon credit decline fits a broader pattern—many automakers are now earning their own credits instead of buying them. The shift signals progress toward wider EV adoption but also limits a once-steady source of profit for Tesla.
Beyond Cars: Tesla’s Clean Energy Expansion
Beyond cars, Tesla’s energy division remains a major growth area. The company is scaling up battery-storage products like Powerwall for homes and Megapack for utilities.
In 2025, global installations of Tesla’s energy storage exceeded 40 GWh, up 16% year over year. These systems help stabilize power grids and integrate renewable energy.
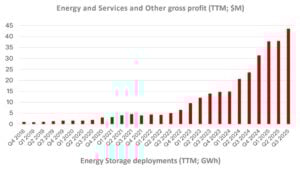
Tesla also said its solar installations reached 280 MW in the quarter, a 9% increase. Although still a small part of total revenue, solar and storage help diversify the business as the company moves closer to its clean-energy mission.
Looking forward, Tesla plans to:
- Increase battery recycling capacity by 50% by 2026.
- Expand Megapack production in California and China.
- Develop lower-cost energy products for homes and small businesses.
These steps aim to make Tesla not just an automaker but a full-scale clean energy company.
Bottom Line: Growth Meets Reality
Tesla’s Q3 2025 results show solid growth but shrinking profits. Vehicle deliveries set a new record, and the energy business expanded. Yet, weaker margins and falling carbon credit sales highlight growing challenges for Tesla.
From an ESG perspective, Tesla remains a major player in global decarbonization. Its EVs and clean energy systems continue to reduce emissions worldwide. But maintaining that leadership will depend on cost discipline, stable policies, and innovation in both batteries and AI systems.
As the company enters the final quarter of 2025, investors will watch closely for signs of margin recovery and progress on new product lines. The next few quarters will show whether Tesla can balance fast growth with profitability, while staying true to its sustainability mission.
FURTHER READINGS:
- Tesla (TSLA) Stock Rises Over $450, Hits Record $1.5T Market Cap as Q3 Delivery Test Looms
- Tesla’s AI5 Chip Challenges NVIDIA’s Dominance in AI Hardware Innovation
- Tesla Shifts From EVs to AI: Musk Says Robots Will be 80% of Company Value
The post Tesla (TSLA) Stock Slips After Q3 Results as Carbon Credit Revenue Plunges 44% appeared first on Carbon Credits.
Every business carbon footprint report ends with a number, the amount of carbon emissions produced by the business, less the amount of carbon reduced and offset, given in tonnes of CO₂. Many of the people who sign off on that number, including those who paid for it, cannot picture what it represents on the ground. A tonne is a unit of mass. CO₂ is invisible. The link between the amount offset in the report and a real piece of restored forest somewhere in the world is almost never indicated.
![]()
Americans are paying more for insurance, electricity, taxes, and home repairs every year. What many people may not realize is that climate change is already one of the drivers behind those rising costs.
For many households, climate change is no longer just an environmental issue. It is becoming a cost-of-living issue. While climate impacts like melting glaciers and shrinking polar ice can feel distant from everyday life, the financial effects are already showing up in monthly budgets across the country.
Today, a larger share of household income is consumed by fixed costs such as housing, insurance, utilities, and healthcare. (3) Climate change and climate inaction are adding pressure to many of those expenses through higher disaster recovery costs, rising energy demand, infrastructure repairs, and increased insurance risk.
The goal of this article is to help connect climate change to the everyday financial realities people already experience. Regardless of where someone stands on climate policy, it is important to recognize that climate change is already increasing costs for households, businesses, and taxpayers across the United States.
More conservative estimates indicate that the average household has experienced an increase of about $400 per year from observed climate change, while less conservative estimates suggest an increase of $900.(1) Those in more disaster-prone regions of the country face disproportionate costs, with some households experiencing climate-related costs averaging $1,300 per year.(1) Another study found that climate adaptation costs driven by climate change have already consumed over 3% of personal income in the U.S. since 2015.(9) By the end of the century, housing units could spend an additional $5,600 on adaptation costs.(1)
Whether we realize it or not, Americans are already paying for climate change through higher insurance premiums, energy costs, taxes, and infrastructure repairs. These growing expenses are often referred to as climate adaptation costs.
Without meaningful climate action, these costs are expected to continue rising. Choosing not to invest in climate action is also choosing to spend more on climate adaptation.
Here are a few ways climate change is already increasing the cost of living:
- Higher insurance costs from more frequent and severe storms
- Higher energy use during longer and hotter summers
- Higher electricity rates tied to storm recovery and grid upgrades
- Higher government spending and taxpayer-funded disaster recovery costs
The real debate is not whether climate change costs money. Americans are already paying for it. The question is where we want those costs to go. Should we invest more in climate action to help reduce future climate adaptation costs, or continue paying growing recovery and adaptation expenses in everyday life?
How Climate Change Is Increasing Insurance Costs
There is one industry that closely tracks the financial impact of natural disasters: insurance. Insurance companies are focused on assessing risk, estimating damages, and collecting enough revenue to cover losses and remain financially stable.
Comparing the 20-year periods 1980–1999 and 2000–2019, climate-related disasters increased 83% globally from 3,656 events to 6,681 events. The average time between billion-dollar disasters dropped from 82 days during the 1980s to 16 days during the last 10 years, and in 2025 the average time between disasters fell to just 10 days. (6)
According to the reinsurance firm Munich Re, total economic losses from natural disasters in 2024 exceeded $320 billion globally, nearly 40% higher than the decade-long annual average. Average annual inflation-adjusted costs more than quadrupled from $22.6 billion per year in the 1980s to $102 billion per year in the 2010s. Costs increased further to an average of $153.2 billion annually during 2020–2024, representing another 50% increase over the 2010s. (6)
In the United States, billion-dollar weather and climate disasters have also increased significantly. The average number of billion-dollar disasters per year has grown from roughly three annually during the 1980s to 19 annually over the last decade. In 2023 and 2024, the U.S. recorded 28 and 27 billion-dollar disasters respectively, both setting new records. (6)
The growing impact of climate change is one reason insurance costs continue to rise. “There are two things that drive insurance loss costs, which is the frequency of events and how much they cost,” said Robert Passmore, assistant vice president of personal lines at the Property Casualty Insurers Association of America. “So, as these events become more frequent, that’s definitely going to have an impact.” (8)
After adjusting for inflation, insurance costs have steadily increased over time. From 2000 to 2020, insurance costs consistently grew faster than the Consumer Price Index due to rising rebuilding costs and weather-related losses.(3) Between 2020 and 2023 alone, the average home insurance premium increased from $75 to $360 due to climate change impacts, with disaster-prone regions experiencing especially steep increases.(1) Since 2015, homeowners in some regions affected by more extreme weather have seen home insurance costs increased by nearly 57%.(1) Some insurers have also limited or stopped offering coverage in high-risk areas.(7)
For many families, rising insurance costs are no longer occasional financial burdens. They are becoming recurring monthly expenses tied directly to growing climate risk.
How Rising Temperatures Increase Household Energy Costs

The financial impacts of climate change extend beyond insurance. Rising temperatures are also changing how much energy Americans use and how utilities plan for future electricity demand.
Between 1950 and 2010, per capita electricity use increased 10-fold, though usage has flattened or slightly declined since 2012 due to more efficient appliances and LED lighting. (3) A significant share of increased energy demand comes from cooling needs associated with higher temperatures.
Over the last 20 years, the United States has experienced increasing Cooling Degree Days (CDD) and decreasing Heating Degree Days (HDD). Nearly all counties have become warmer over the past three decades, with some areas experiencing several hundred additional cooling degree days, equivalent to roughly one additional degree of warmth on most days. (1) This trend reflects a warming climate where air conditioning demand is increasing while heating demand generally declines. (4)
As temperatures continue rising, households are expected to spend more on cooling than they save on heating. The U.S. Energy Information Administration (EIA) projects that by 2050, national Heating Degree Days will be 11% lower while Cooling Degree Days will be 28% higher than 2021 levels. Cooling demand is projected to rise 2.5 times faster than heating demand declines. (5)
These projections come from energy and infrastructure experts planning for future electricity demand and grid capacity needs. Utilities and grid operators are already preparing for higher peak summer electricity loads caused by rising temperatures. (5)
Longer and hotter summers also affect how homes and buildings are designed. Buildings constructed for past climate conditions may require upgrades such as larger air conditioning systems, stronger insulation, and improved ventilation to remain comfortable and energy efficient in the future. (10)
For many households, this means higher monthly utility bills and potentially higher long-term home improvement costs as temperatures continue to rise.
How Climate Change Affects Electricity Rates
On an inflation-adjusted basis, average U.S. residential electricity rates are slightly lower today than they were 50 years ago. (2) However, climate-related damage to utility infrastructure is creating new upward pressure on electricity costs.
Electric utilities rely heavily on above-ground poles, wires, transformers, and substations that can be damaged by hurricanes, storms, floods, and wildfires. Repairing and upgrading this infrastructure often requires substantial investment.
As a result, utilities are increasing electricity rates in response to wildfire and hurricane events to fund infrastructure repairs and future mitigation efforts. (1) The average cumulative increase in per-household electricity expenditures due to climate-related price changes is approximately $30. (1)
While this increase may appear modest today, utility costs are expected to rise further as climate-related infrastructure damage becomes more frequent and severe.
How Climate Disasters Increase Government Spending and Taxes
Extreme weather events also damage public infrastructure, including roads, schools, bridges, airports, water systems, and emergency services infrastructure. Recovery and rebuilding costs are often funded through taxpayer dollars at the federal, state, and local levels.
The average annual government cost tied to climate-related disaster recovery is estimated at nearly $142 per household. (1) States that frequently experience hurricanes, wildfires, tornadoes, or flooding can face even higher public recovery costs.
These expenses affect taxpayers whether they personally experience a disaster or not. Climate-related recovery spending can increase pressure on public budgets, emergency management systems, and infrastructure funding nationwide.
Reducing Climate Costs Through Climate Action
While this article focuses on the growing financial costs associated with climate change, the issue is not only about money for many people. It is also about recognizing our environmental impact and taking responsibility for reducing it in order to help preserve a healthy planet for future generations.
While individuals alone cannot solve climate change, collective action can help reduce future climate adaptation costs over time.
For those interested in taking action, there are three important steps:
- Estimate your carbon footprint to better understand the emissions connected to your lifestyle and activities.
- Create a plan to gradually reduce emissions through energy efficiency, cleaner technologies, and more sustainable choices.
- Address remaining emissions by supporting verified carbon reduction projects through carbon credits.
Carbon credits are one of the most cost-effective tools available for climate action because they help fund projects that generate verified emission reductions at scale. Supporting global emission reduction efforts can help reduce the long-term impacts and costs associated with climate change.
Visit Terrapass to learn more about carbon footprints, carbon credits, and climate action solutions.
The post How Climate Change Is Raising the Cost of Living appeared first on Terrapass.


-
Climate Change10 months ago
Guest post: Why China is still building new coal – and when it might stop
-
Greenhouse Gases10 months ago
Guest post: Why China is still building new coal – and when it might stop
-

 Greenhouse Gases2 years ago
嘉宾来稿:满足中国增长的用电需求 光伏加储能“比新建煤电更实惠”
-

 Climate Change2 years ago
嘉宾来稿:满足中国增长的用电需求 光伏加储能“比新建煤电更实惠”
-
Climate Change2 years ago
Bill Discounting Climate Change in Florida’s Energy Policy Awaits DeSantis’ Approval
-

 Renewable Energy7 months ago
Sending Progressive Philanthropist George Soros to Prison?
-

 Carbon Footprint2 years ago
US SEC’s Climate Disclosure Rules Spur Renewed Interest in Carbon Credits
-
Greenhouse Gases11 months ago
嘉宾来稿:探究火山喷发如何影响气候预测