

Last year was the hottest the Earth has experienced since the start of global temperature records in the mid-1800s – and likely for many thousands of years before.
The year 2024 was the first in which average global temperatures at the surface of the planet exceeded 1.5C above pre-industrial levels in the majority of leading datasets.
While reaching 1.5C in an individual year is not equivalent to a breach of the Paris Agreement’s 1.5C limit – which refers to long-term warming – it nevertheless indicates that the world is quickly approaching this internationally agreed threshold.
Here, Carbon Brief examines the latest data across the Earth’s oceans, atmosphere, cryosphere and surface temperature. (Use the links below to navigate between sections.)
Noteworthy findings from this 2024 review include…
- Global surface temperatures: It was the warmest year on record by a large margin – at between 1.46C and 1.62C above pre-industrial levels across different temperature datasets and 1.55C in the World Meteorological Organization (WMO) synthesis.
- Exceptional monthly temperatures: Global temperatures set a new record each month between January and June, extending a 15-month record-setting stretch which began in 2023.
- Warmest over land: Global temperatures over the world’s land regions – where humans live and primarily experience climate impacts – were a record 2.3C above pre-industrial levels.
- Warmest over oceans: Global sea surface temperatures set a new record at 1.1C above pre-industrial levels.
- Ocean heat content: It was the warmest year on record for ocean heat content. In 2024, the oceans added 25 times more heat than all annual human energy use.
- Regional warming: It was the warmest year on record in more than 100 countries – including China, Canada, Mexico, Germany, Brazil, Greece, Malaysia and South Korea – and in areas where a total of 3.3 billion people live.
- Unusual warmth: The specific causes behind the exceptionally warm, record-setting temperatures in both 2023 and 2024 remain an open scientific question, with human-caused greenhouse gases, variability in El Niño and changes in the reflectivity of clouds all playing a role.
- Comparison with climate models: Observations for 2024 are above the central estimate of climate model projections in the Intergovernmental Panel on Climate Change (IPCC) sixth assessment report, but well within the model range.
- Heating of the atmosphere: It was the warmest year in the lower troposphere – the lowest part of the atmosphere – by a large margin.
- Sea level rise: Sea levels reached new record highs, with notable acceleration over the past three decades.
- Shrinking glaciers and ice sheets: Cumulative ice loss from the world’s glaciers and from the Greenland ice sheet reached a new record high in 2024, contributing to sea level rise.
- Greenhouse gases: Concentrations reached record levels for carbon dioxide (CO2), methane and nitrous oxide.
- Sea ice extent: Arctic sea ice saw its seventh-lowest minimum extent on record, while Antarctic sea ice was at the second-lowest level on record for much of the year.
- Looking ahead to 2025: Carbon Brief predicts that global average surface temperatures in 2025 are likely to be the third warmest on record after 2024 and 2023, at around 1.4C above pre-industrial levels. However, large uncertainties remain given how exceptionally and unexpectedly warm the past two years have been.
Record warm surface temperatures
Global surface temperatures set a new record in 2024, surpassing the record set in 2023 by around 0.11C. It was unambiguously the warmest year since records began in the mid-1800s. 2024 was far warmer than any year prior to 2023, exceeding the previous record (set in 2016) by a massive 0.26C.
The figure below shows global surface temperature records from five different datasets: NASA, NOAA, the Met Office Hadley Centre/University of East Anglia’s (UEA) HadCRUT5, Berkeley Earth and Copernicus ERA5.
Other surface temperature datasets not shown – including JRA-3Q, the AIRS satellite data and the Japanese Meteorological Agency – also show 2024 as the warmest year on record.
Annual global average surface temperatures over 1850-2024. Data from NASA GISTEMP, NOAA GlobalTemp, Hadley/UEA HadCRUT5, Berkeley Earth and Copernicus ERA5. Temperature records are aligned over the 1981-2010 period and use the WMO approach to calculate warming relative to the pre-industrial (1850-1900) baseline. Chart by Carbon Brief.
Global surface temperature records can be calculated back to 1850, though some groups such as NASA GISTEMP choose to start their records in 1880 when more data was available.
Prior to 1850, records exist for some specific regions, but are not sufficiently widespread to calculate global temperatures with high accuracy (though work is ongoing to identify and digitise additional records to extend these further back in time).
These longer surface temperature records are created by combining ship- and buoy-based measurements of ocean sea surface temperatures with temperature readings of the surface air temperature from weather stations on land. (Copernicus ERA5 and JRA-3Q are an exception, as they use weather model-based reanalysis to combine lots of different data sources over time.)
Some differences between temperature records are apparent early in the record, particularly prior to 1900 when observations are more sparse and results are more sensitive to how different groups fill in the gaps between observations. However, there is strong agreement between the different temperature records for the period since 1970, as shown in the figure below.

Annual global average surface temperatures as in the prior chart, but showing the period from 1970-2024. Chart by Carbon Brief.
Global temperatures in 2024 clearly stand out as much warmer than anything that has come before, above even the exceptionally warm temperatures of 2023. This can be seen in the figure below from Berkeley Earth. Each shaded curve represents the annual average temperature for that year. The further that curve is to the right, the warmer it was.
The width of each year’s curve reflects the uncertainty in the annual temperature values, which is caused by factors such as changes in measurement techniques and the fact that some parts of the world have fewer measurement locations than others.

The year 2024 was the warmest on record for both the world’s land and ocean regions. Global average land temperatures were around 2.3C above pre-industrial levels in the Berkeley Earth dataset, while global ocean temperatures exceeded 1.1C.
The figure below shows land (red) and ocean (blue) temperatures along with their respective confidence intervals, relative to pre-industrial levels, in the Berkeley Earth surface temperature record.

Global land regions – where the global human population lives – has been warming around 70% faster than the oceans – and 40% faster than the global average in the years since 1970.
2024 started off quite hot, boosted by an El Niño event that peaked at the start of the year. The first six months of the year set new all-time monthly records, extending a run of 15 record-setting months that started in July 2023. The latter part of the year remained warm, and was only slightly exceeded by the exceptionally hot temperatures experienced in the second half of 2023.
The figure below shows each month of 2024 in black, compared to all prior years since 1940. Each year is coloured based on the decade in which it occurred, with the clear warming over time visible, as well as the margin by which both 2023 and 2024 exceeded past years.
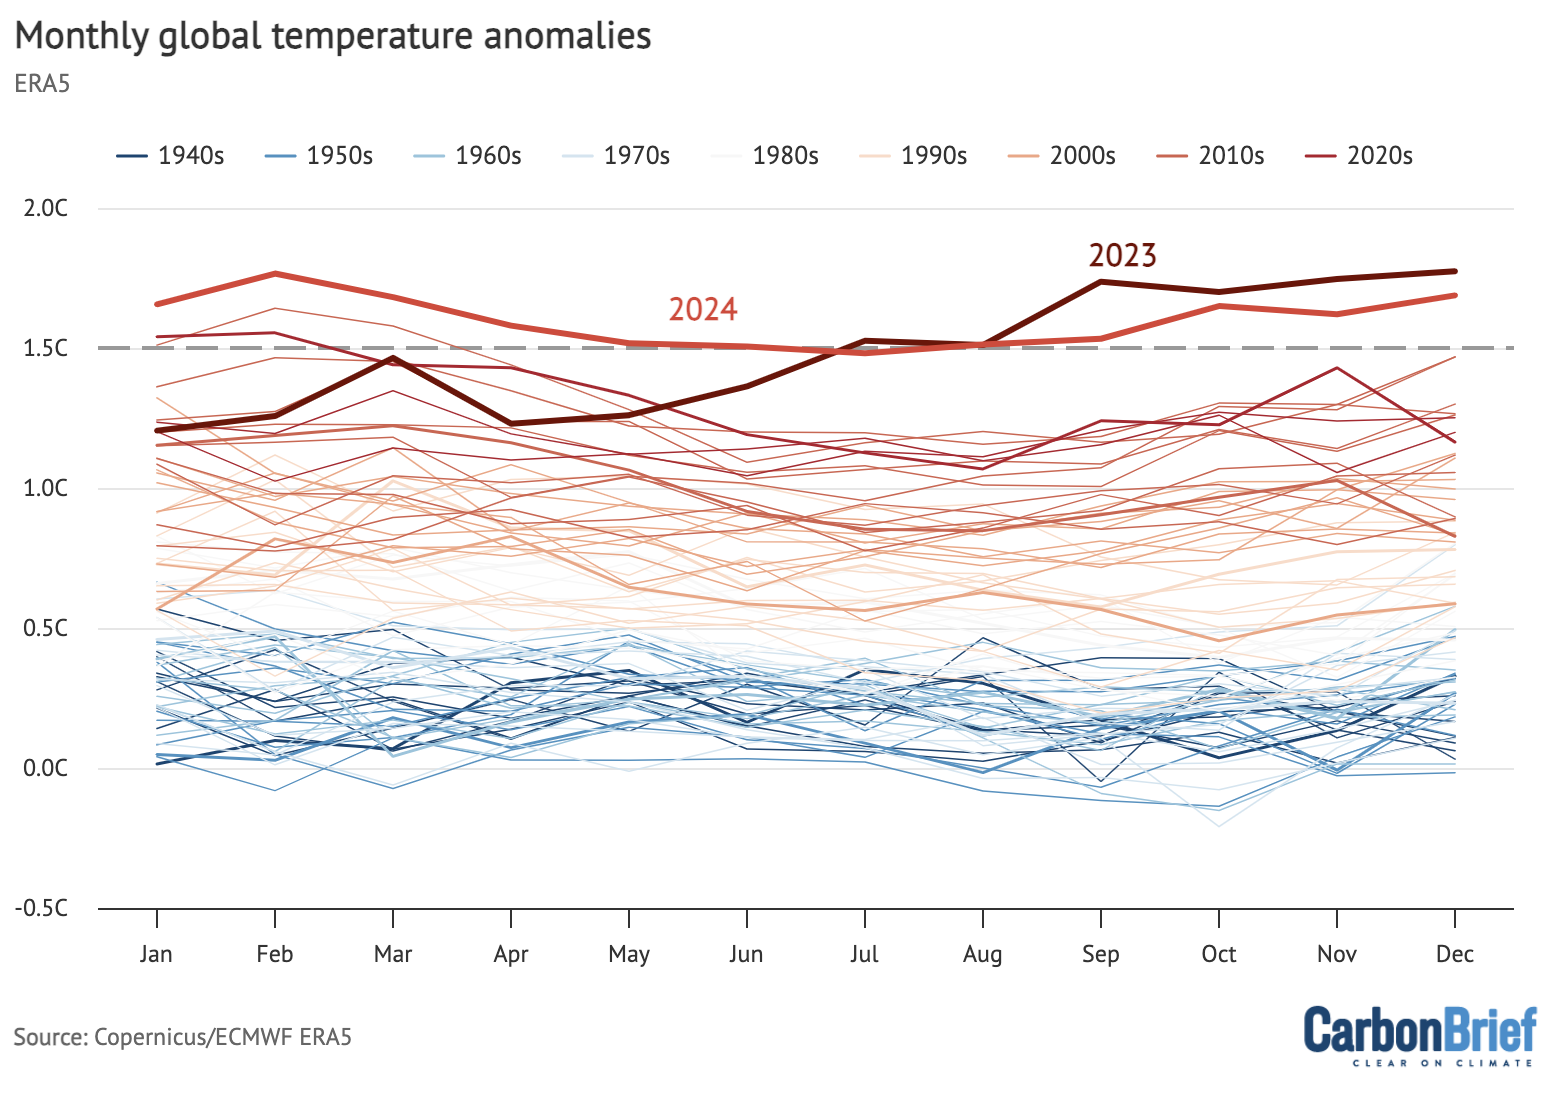
Monthly global surface temperatures for each year since 1940, with anomalies shown relative to the pre-industrial 1850-1900 period using data from Copernicus/ECMWF ERA5. Chart by Carbon Brief.
First year above 1.5C in most records
In the 2015 Paris Agreement, countries agreed to work to limit global temperatures to “well below 2C” and to pursue efforts to limit the temperature increase to 1.5C above pre-industrial levels”.
While the agreement did not specifically define how to measure the breach of these climate targets, the goals have been widely interpreted (including by the IPCC) to refer to temperature averages over 20 years.
In other words, the limits refer to long-term warming, rather than an individual year that includes the short-term influence of natural fluctuations in the climate, such as El Niño.
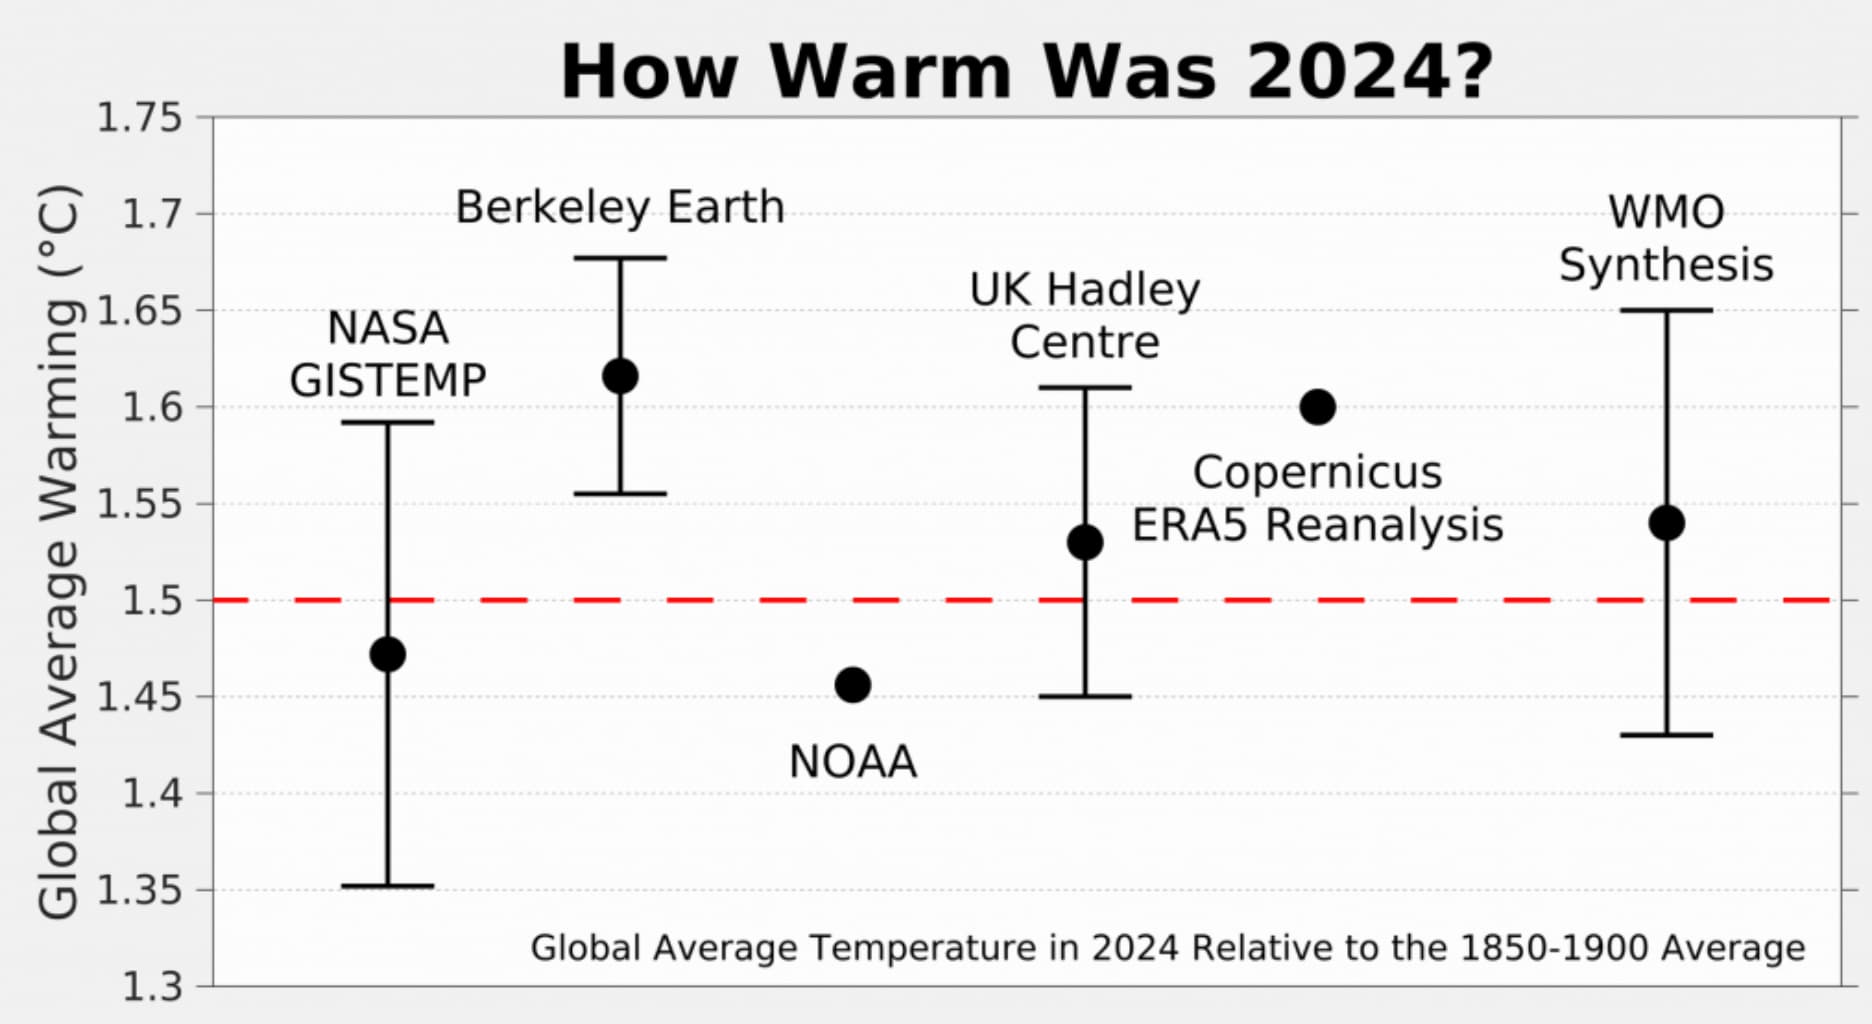
However, a single year exceeding 1.5C still represents a grim milestone and a sign that the world is quickly approaching the target. And, in the majority of datasets in 2024, global surface temperatures exceeded 1.5C for the first time. (In the Berkeley Earth dataset, 2023 was actually the first year above 1.5C.)
| Temperature record | 2024 temperatures relative to preindustrial |
|---|---|
| NASA GISTEMP | 1.47C |
| Hadley/UAE HadCRUT5 | 1.53C |
| NOAA GlobalTemp | 1.46C |
| Berkeley Earth | 1.62C |
| Copernicus/ECMWF | 1.60C |
| JRA-3Q | 1.59C |
| Japanese Meteorological Agency | 1.52C |
Global temperature anomalies for 2024 relative to pre-industrial temperatures (1850-1900).
NOAA and NASA were the only organisations to report global temperatures below 1.5C – and by just a few hundredths of a degree. Berkeley Earth, Copernicus and JRA-3Q all estimated that temperatures were around 1.6C.
This year, the World Meteorological Organization (WMO) provided a synthesis of the different global surface temperature records – incorporating NASA, Hadley, NOAA, Berkeley, Copernicus and JRA-3Q data – which is a useful tool to provide a best-estimate across the different groups. It finds that 2024 was the first year above 1.5C, coming in at 1.55C compared to 1.45C in 2023.
The figure below shows various temperature records along with their published uncertainty range (where available), alongside the WMO synthesis estimate.
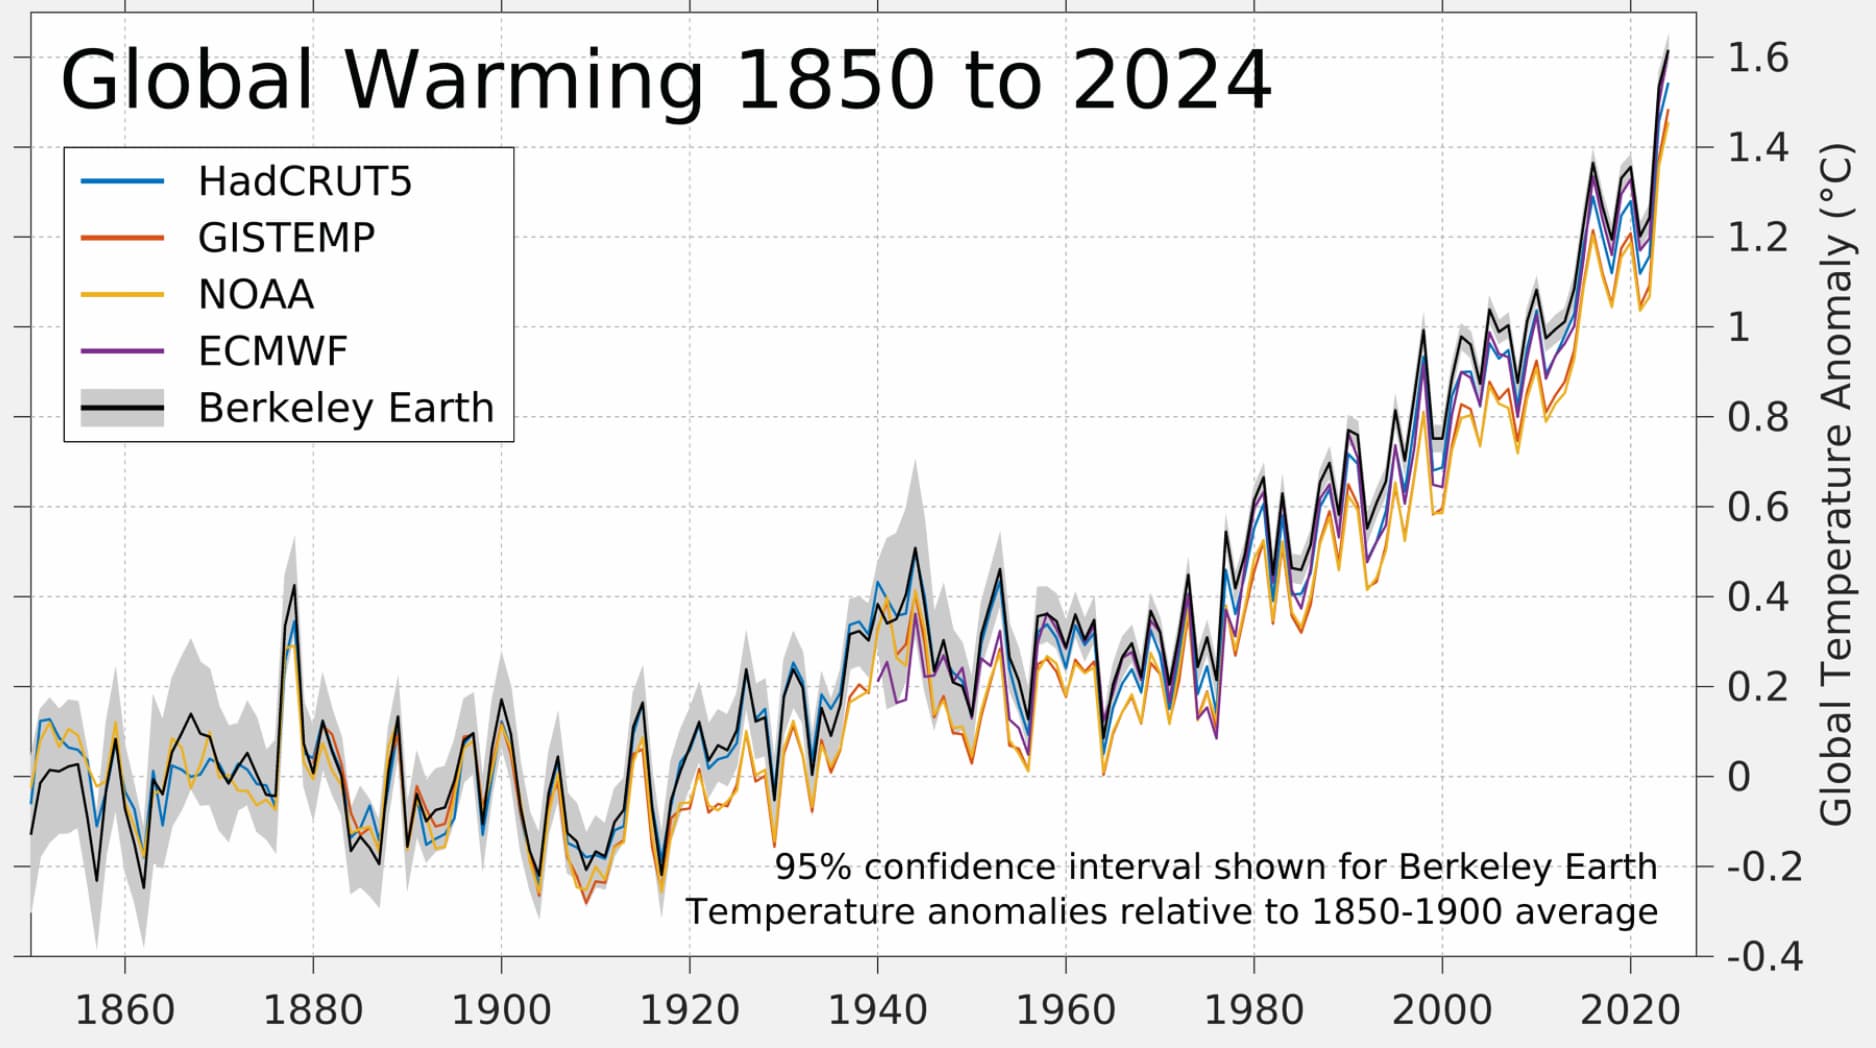
As noted earlier, these datasets are nearly identical over the past 50 years. Differences in warming relative to pre-industrial levels emerge earlier in the record, particularly prior to 1900 when observations are more sparse and the choice of how to fill in the gaps between observations has a large impact on the resulting temperature estimate.
The figure below shows how different temperature records look if each is calculated relative to its own pre-industrial baseline, rather than using an average pre-industrial baseline as shown in the prior section. Focusing on warming since pre-industrial levels – rather than more recent warming – magnifies differences between groups, with the variation in warming across groups largely due to the most uncertain early part of the record.
Ocean heat content sets another record
Last year was the warmest on record for the heat content of the world’s oceans. Ocean heat content (OHC) has increased by around 484 zettajoules – a billion trillion joules – since the 1940s. The heat increase in 2024 alone compared to 2023 – about 16 zettajoules – is around 25 times as much as the total energy produced by all human activities on Earth in 2023 (the latest year in which global primary energy statistics are available).
Human-emitted greenhouse gases trap extra heat in the atmosphere. While some of this warms the Earth’s surface, the vast majority – around of 93% – goes into the oceans. About two-thirds of this accumulates in the top 700 metres, but some also ends up in the deep oceans.
The figure below shows annual OHC estimates between 1950 and present for the upper 700 metres (light blue shading) and 700-2,000 metres (dark blue) of the ocean.
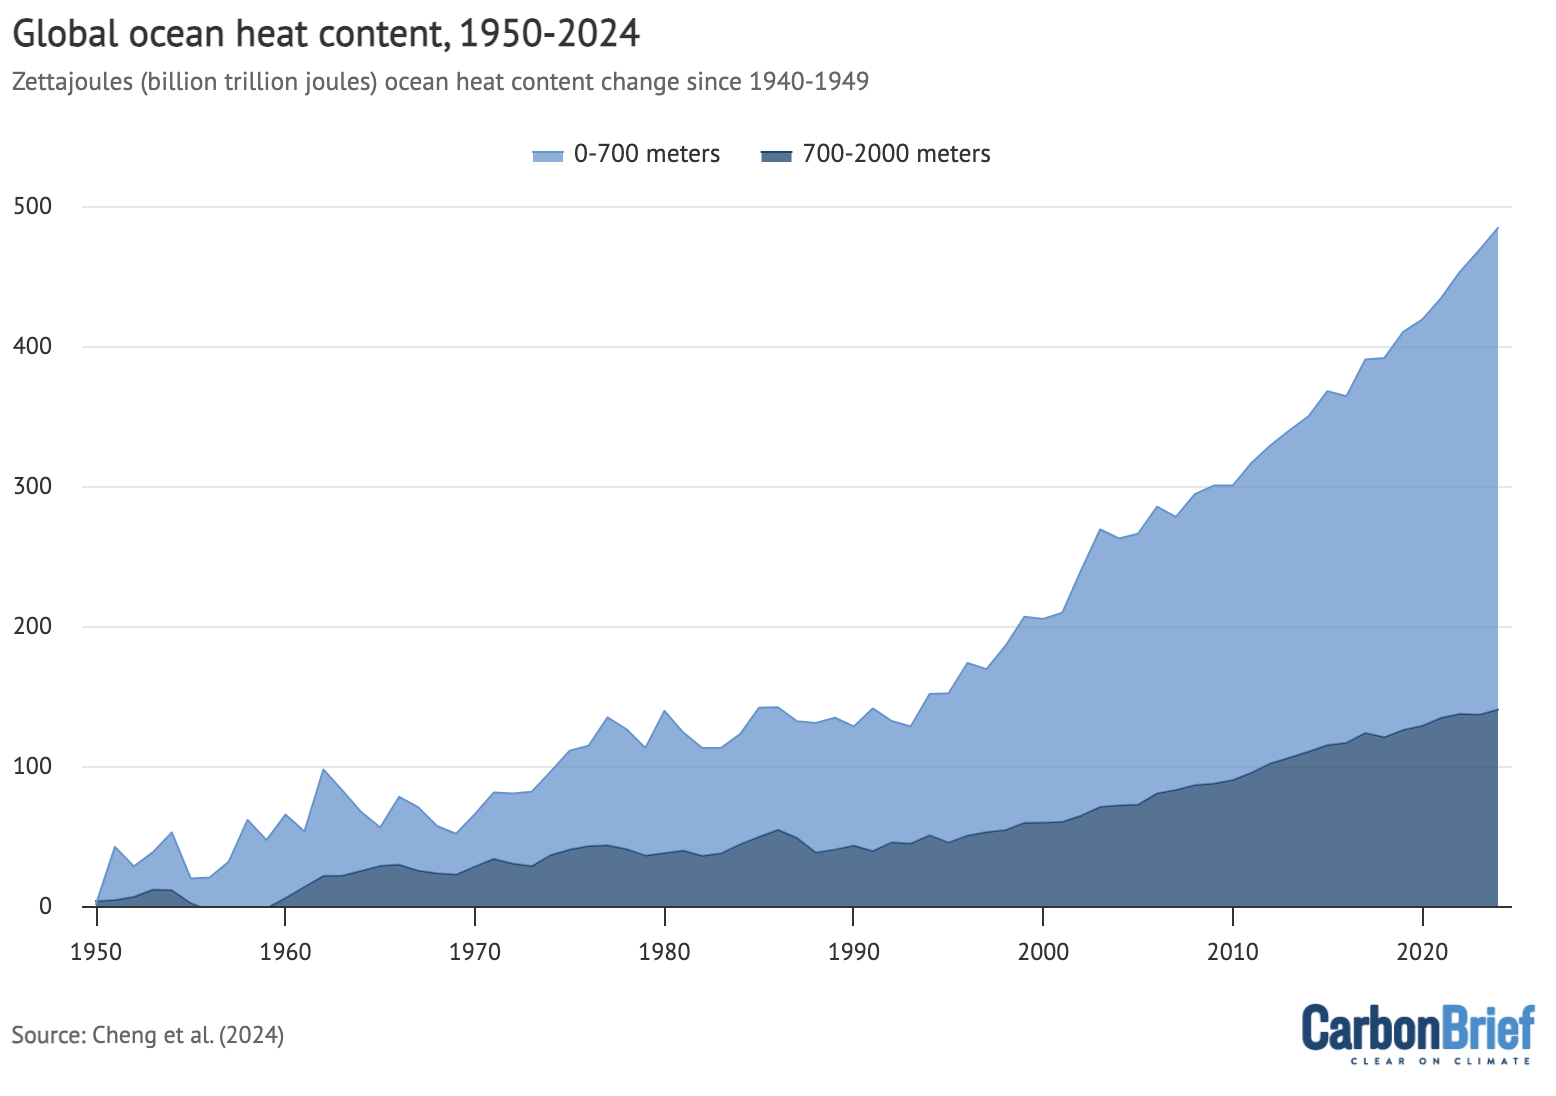
Annual global ocean heat content (in zettajoules – billion trillion joules, or 10^21 joules) for the 0-700 metre and 700-2,000 metre layers. Data from Cheng et al. (2024). Chart by Carbon Brief.
In many ways, OHC represents a much better measure of climate change than global average surface temperatures, because it is where most of the extra heat ends up and is much less variable on a year-to-year basis than surface temperatures.
The graph above shows a distinct acceleration in OHC after 1991, matching the increased rate of greenhouse gas emissions and other radiative forcing elements over the past few decades.
A year of climate extremes
While media coverage of 2024 temperatures has largely focused on the global average, many different regions of the planet experienced climate extremes.
The figure below shows global temperature anomalies in 2024 across the world, with the red areas warmer than the baseline period (1951-80) used by Berkeley Earth and the (few) blue areas experiencing cooler temperatures.
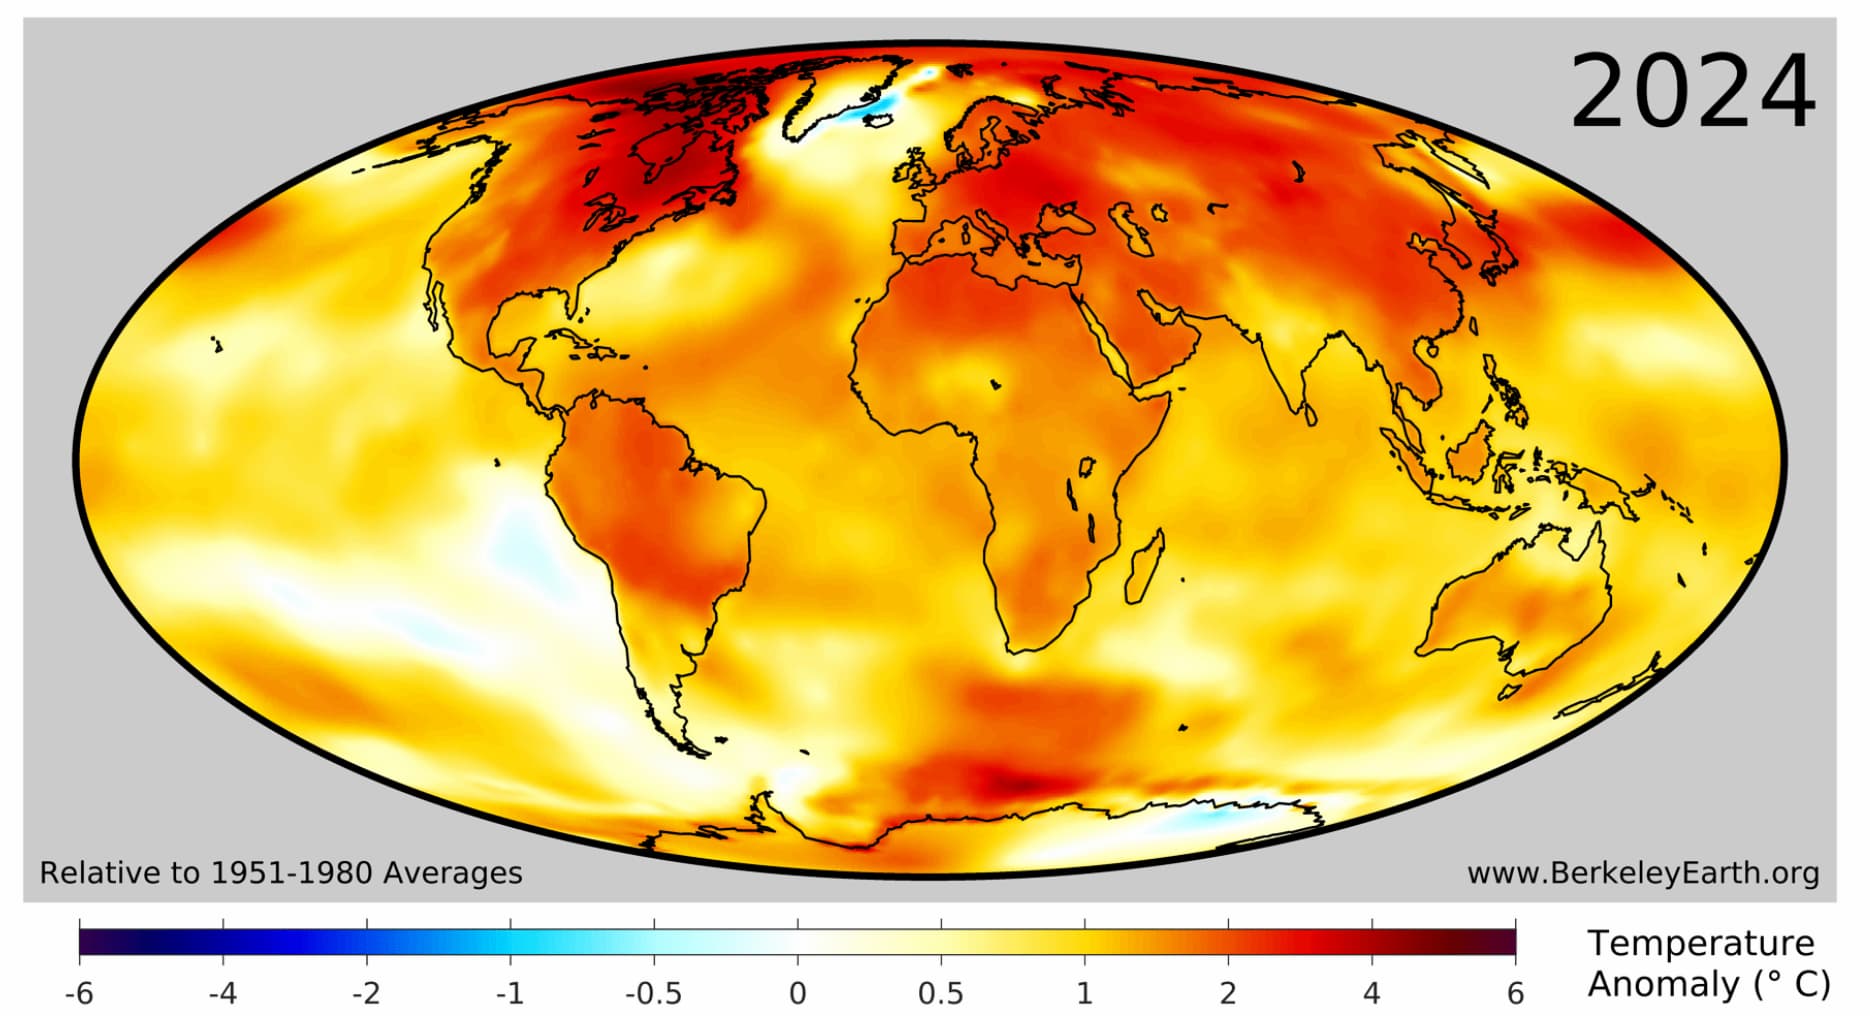
Approximately 3.3 billion people – 40% of Earth’s population – live in places that experienced their warmest year on record in 2024. This was concentrated in Asia, South and Central America, Africa, and Eastern Europe. It also includes two-thirds of the population of China, as well as most of the population of Brazil, Nigeria, Ethiopia, Mexico and one-third of the population of the US.
The figure below highlights regions of the planet that experienced their top-five warmest (red shading) or coldest (blue) temperatures on record in 2024. Overall, around 24% of the planet set a new record, including 32% of the land and 21% of the ocean. No location on the planet experienced record cold temperatures (or even top-five record cold temperatures) for the year as a whole.
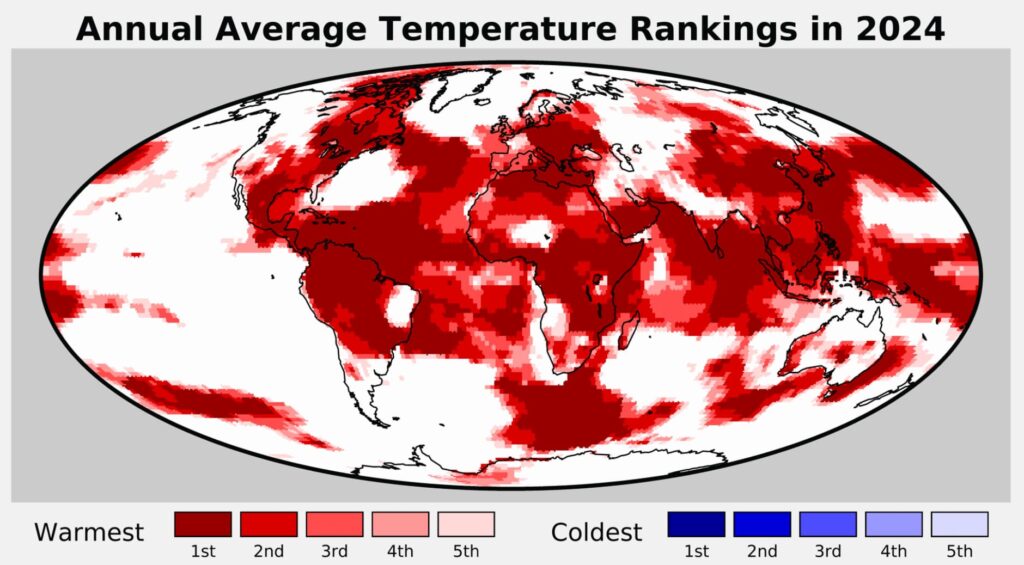
In 2024, more than 100 countries saw their warmest year on record, as listed in the table below.
| Africa | Asia | Europe | North America | Oceania | South America |
|---|---|---|---|---|---|
| Algeria Cameroon Central African Republic Chad Comoros Democratic Republic of the Congo Djibouti Equatorial Guinea Eritrea Ethiopia Gabon Ghana Guinea Guinea-Bissau Ivory Coast Kenya Liberia Libya Malawi Mozambique Republic of the Congo Sao Tome and Principe Seychelles Sierra Leone Somalia South Sudan Togo Tunisia Uganda Zambia Zimbabwe |
Brunei Cambodia China Indonesia Laos Malaysia Mongolia North Korea Oman Palau Philippines Singapore South Korea Sri Lanka Taiwan Thailand Vietnam Yemen |
Albania Austria Belarus Bosnia and Herzegovina Bulgaria Croatia Cyprus Czechia Germany Greece Hungary Italy Kosovo Liechtenstein Lithuania Malta Moldova Montenegro Netherlands Poland San Marino Republic of Serbia Romania Slovakia Slovenia Ukraine |
Antigua and Barbuda Barbados Belize Canada Dominica El Salvador Grenada Guatemala Haiti Honduras Jamaica Mexico Nicaragua Saint Kitts and Nevis Saint Lucia Saint Vincent and the Grenadines Trinidad and Tobago |
Federated States of Micronesia Fiji Kiribati Samoa Solomon Islands |
Brazil Colombia Guyana Paraguay Suriname Venezuela |
While the contiguous US saw record warmth, 2024 was the country’s second-warmest year on record once Alaska and Hawaii temperatures are included.
Furthermore, the continents of North America, South America, Asia, Africa and Europe each set new annual average records in 2024.
Untangling the drivers of spiking global temperatures
Global temperatures spiked in both 2023 and 2024 in a manner that scientists had not anticipated. Projections of 2023 temperatures were far below what actually occurred, and even 2024 projections ended up being on the lower end, despite incorporating 2023’s extremes.
The figure below shows estimates by four different groups that provided temperature predictions for the year prior to any data being collected – the UK Met Office, NASA’s Dr Gavin Schmidt, Berkeley Earth and Carbon Brief’s own estimate.
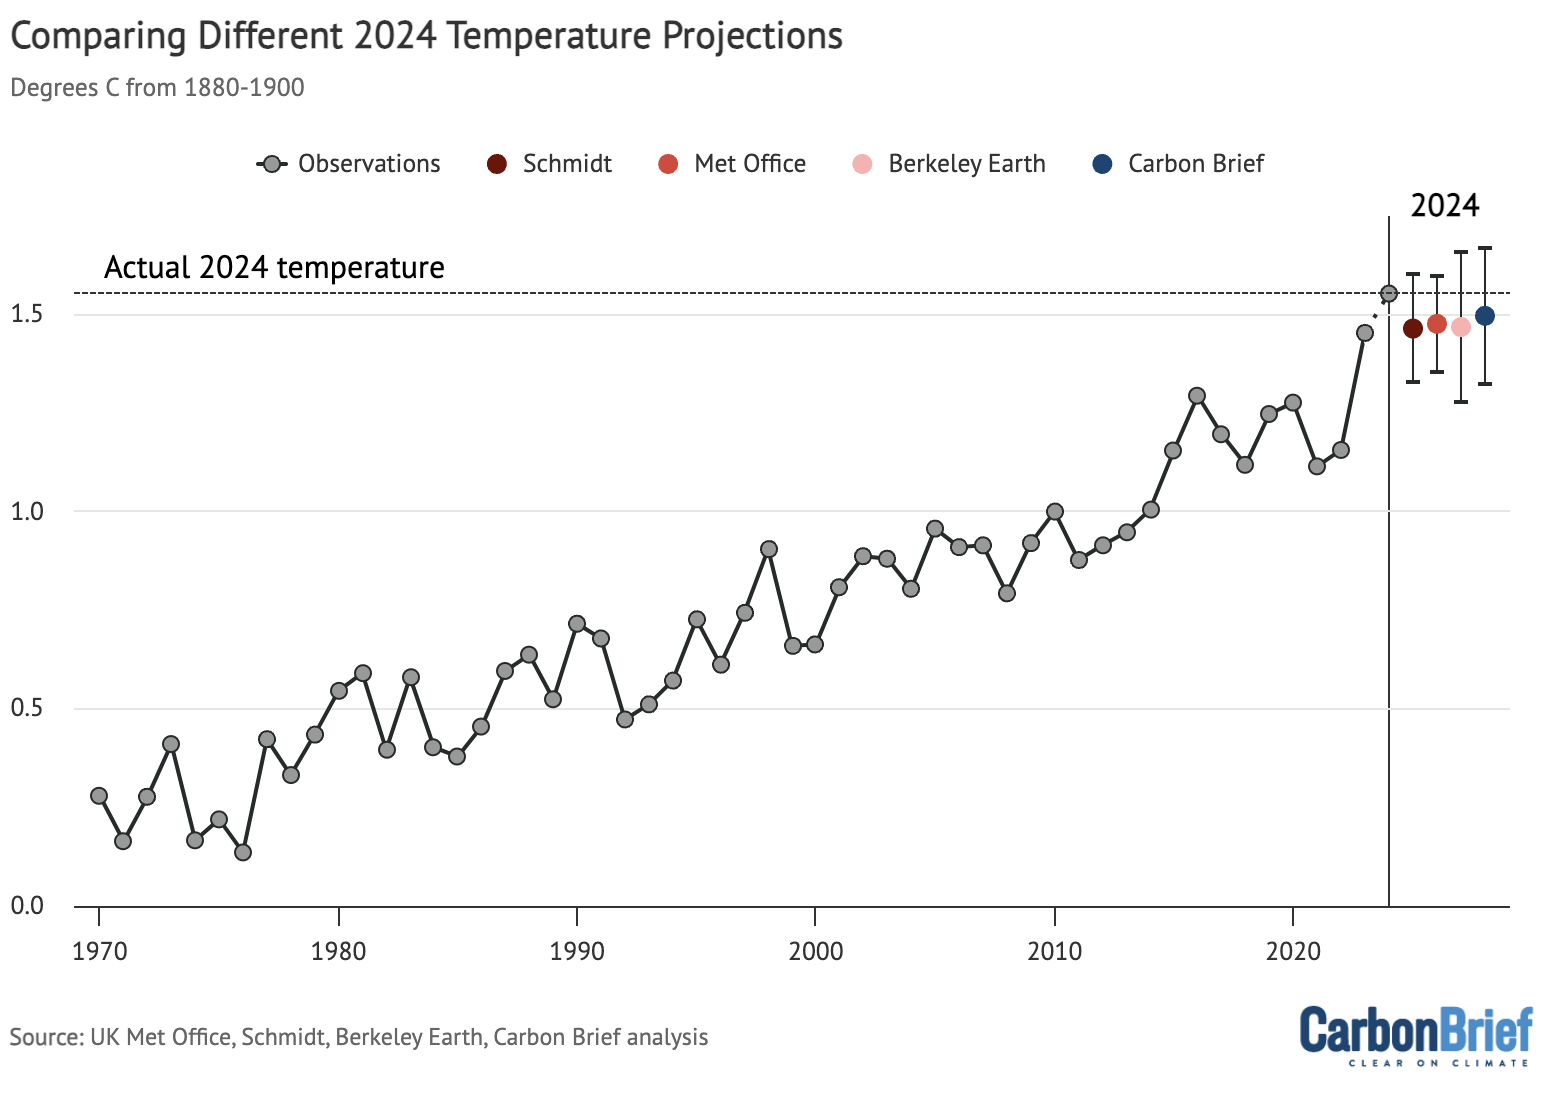
Temperature predictions for 2024 from the UK Met Office, NASA’s Dr Gavin Schmidt, Berkeley Earth, and Carbon Brief relative to pre-industrial (1850-1900) temperatures and compared to the historical average of six different datasets produced by the WMO. Chart by Carbon Brief.
Unusually high global temperatures in 2023 and 2024 have sparked a slew of new studies by scientists attempting to explain the excessive heat. A range of possible causes has been proposed, including:
- The possibility that El Niño behaved unusually as it followed a rare extended triple-dip La Niña event. A 2024 paper found that when El Niño followed an extended La Niña in climate model simulations, it produced a temperature spike commensurate to what was observed in 2023-24 around 10% of the time.
- A decline in emissions of sulphur dioxide, reducing atmospheric aerosol concentrations and “unmasking” additional warming from past human greenhouse gas emissions. Multiple different papers have looked at the effects of a 2020 low-sulphur marine shipping fuel regulation, and ongoing research is looking at the effects of a sharp drop in sulphur emissions in China.
- An unusual 2022 eruption of the Hunga-Tonga Hunga Ha’apai volcano that put around 150m tonnes of water vapour into the stratosphere, as well as some sulphur dioxide. Papers have been mixed on whether the water vapour warming or the sulphur dioxide cooling would be larger.
- Other factors include an uptick in the 11-year solar cycle, and unusually low Saharan dust concentrations in early summer 2023.
One notable paper, published in the journal Science in early December 2024, found a substantial decline in reflective low-cloud cover in the northern mid-latitudes and tropics. They noted that this has the effect of increasing the amount of solar radiation that reaches the Earth’s surface and is re-radiated as heat.
The finding by itself does not reveal what caused a decline in cloud reflectivity, and the authors note that it could be a combination of natural variability, declining atmospheric aerosol concentrations associated with falling sulfur emissions, or – more worryingly – a sign of a strong positive cloud feedback associated with warming.
The figure below, created by Dr Robert Rohde at Berkeley Earth, synthesises the main drivers of temperature change over the past decade. It includes estimates of the warming contribution from human greenhouse gas emissions, El Niño and La Niña, changes in the solar cycle, the Hunga-Tonga eruption, and the 2020 low-sulphur marine fuel regulations. For the latter two elements, it includes a range of six published estimates of the eruption and five published estimates of the low sulphur fuel rules.
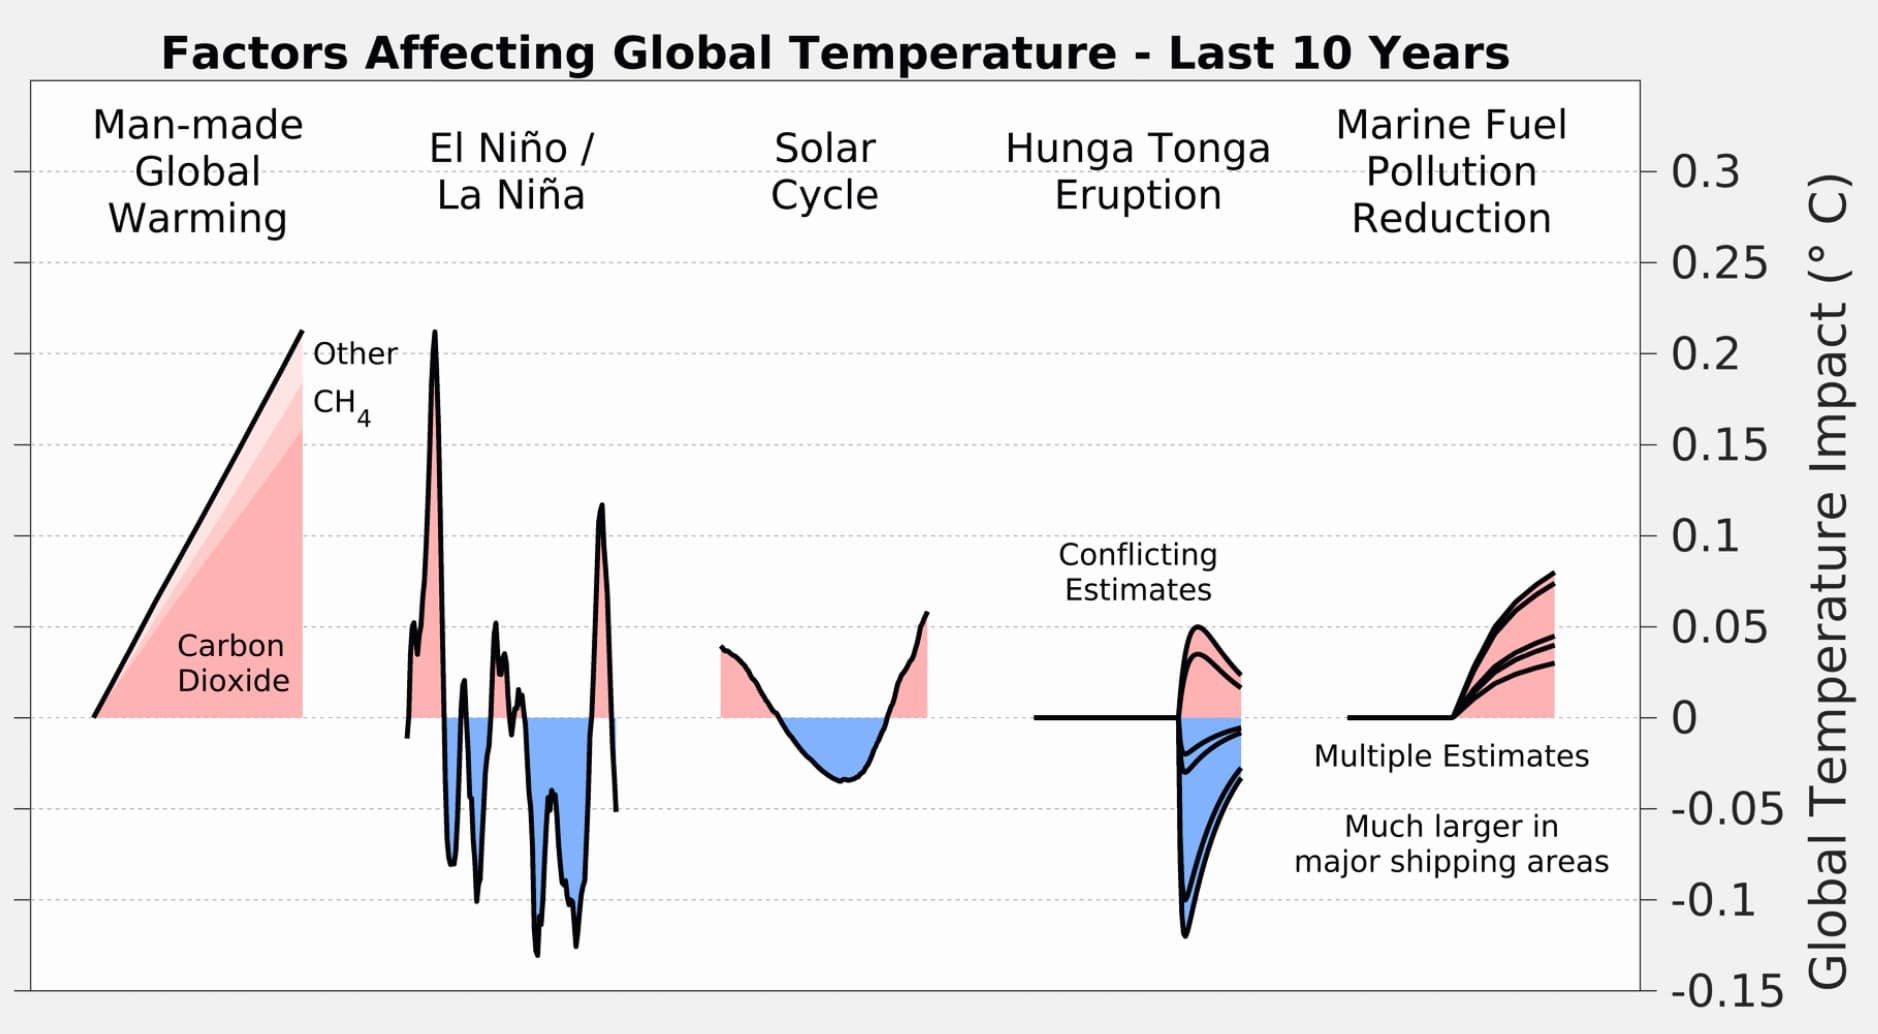
Over the longer-term, human emissions of CO2 and other greenhouse gases alongside planet-cooling aerosols are the main driver of global temperatures. Global temperatures have risen by more than 1.3C since pre-industrial times as a result of human activity.
However, on top of long-term warming, global temperatures vary year-to-year by up to 0.2C.
These variations are primarily driven by El Niño and La Niña events that redistribute heat between the atmosphere and oceans. However, other factors such as volcanic eruptions, the 11-year solar cycle and changes in short-lived climate forcers can influence year-to-year temperature changes.
The figure below shows the El Niño (red shading) and La Niña (blue) conditions over the past 40 years (collectively referred to as the El Niño-Southern Oscillation, or “ENSO”). While not unprecedented, the extended La Niña conditions since the latter half of 2020 have extended for an unusually long period of time.
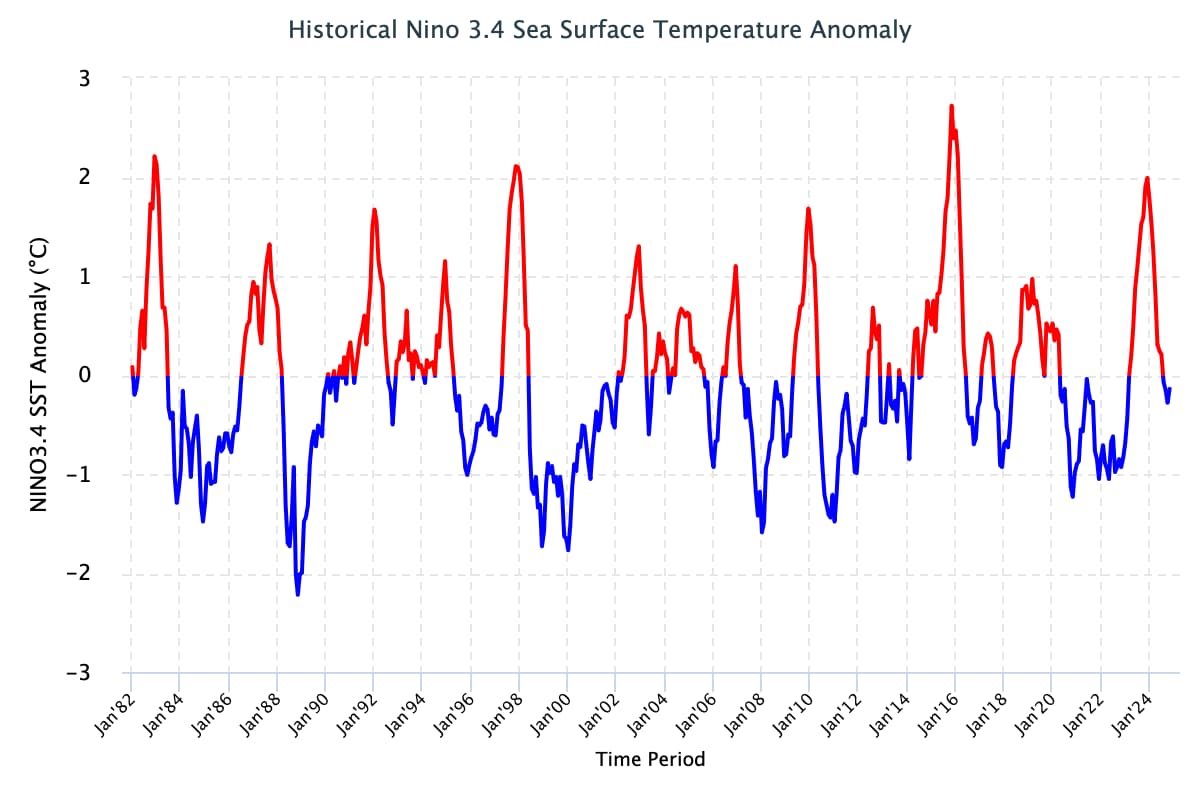
Carbon Brief has used this historical relationship between ENSO conditions and temperature to effectively remove the effects of El Niño and La Niña events from global temperatures, as shown in the figure below.
This analysis indicates that El Niño boosted global temperatures in 2024 by around 0.16C compared to the estimate of global temperatures with both El Niño and La Niña events removed. This was a much larger effect than the 0.04C estimated for 2023, when El Niño emerged relatively late in the year and peaked in November.
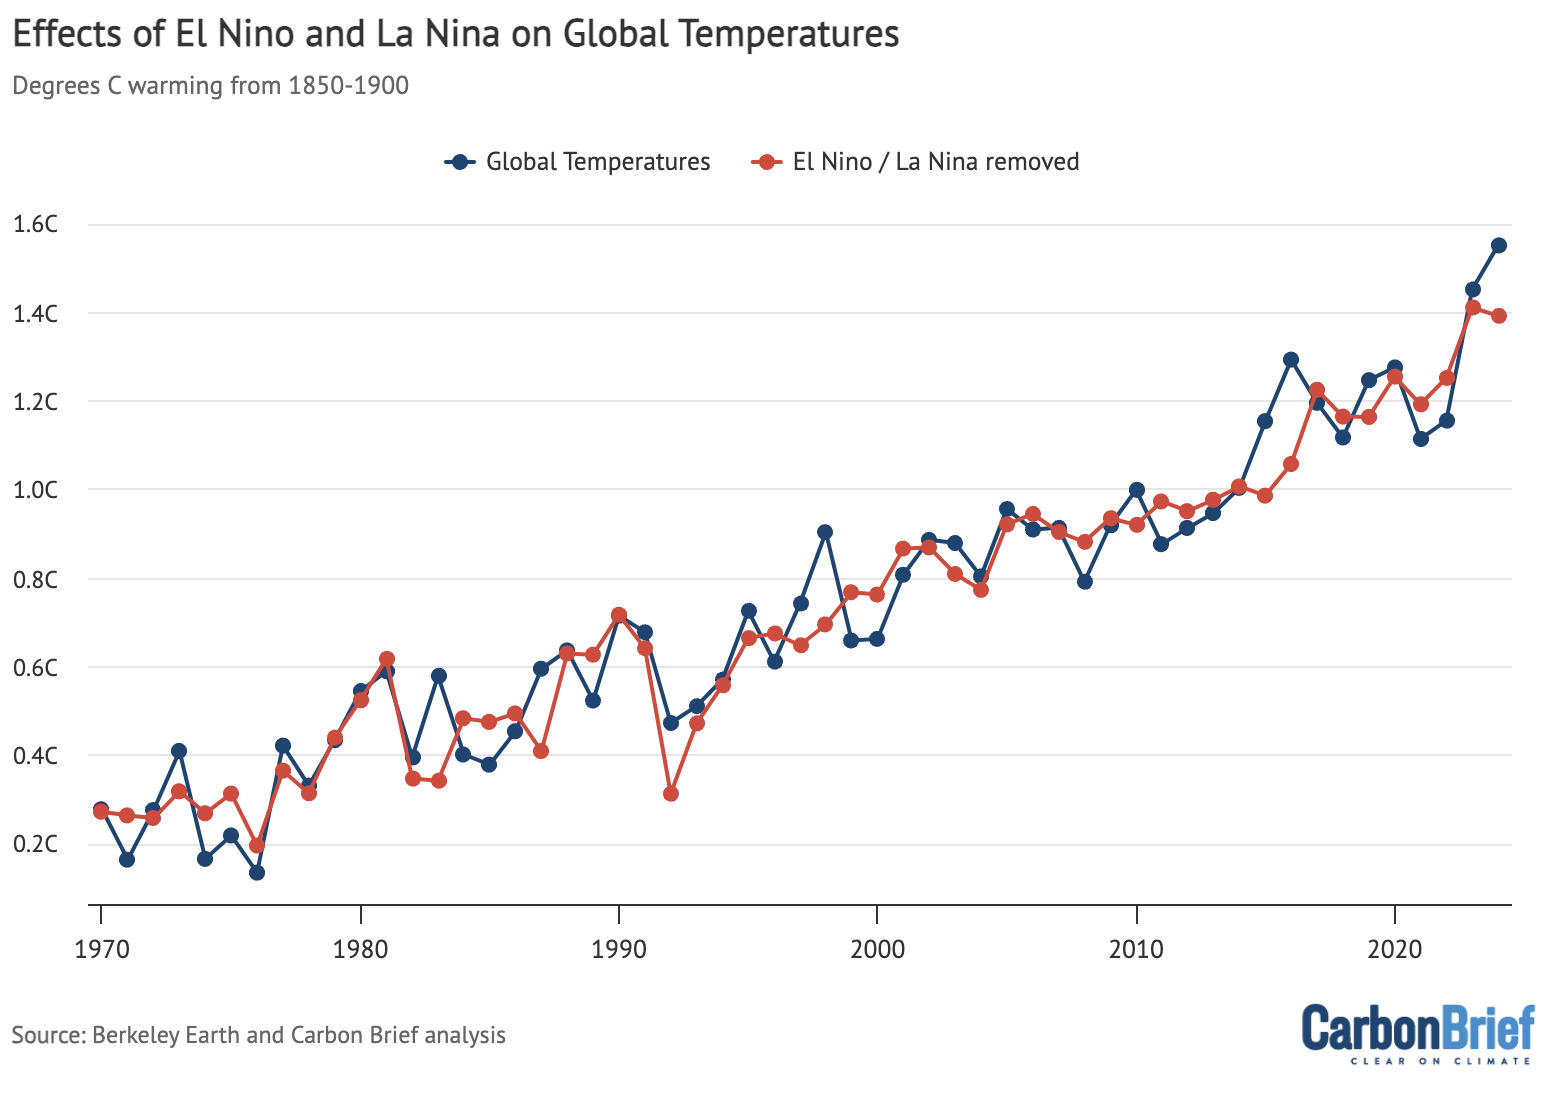
Annual global average surface temperatures from the WMO average of six different datasets , as well as Carbon Brief’s estimate of global temperatures with the effect of El Niño and La Niña (ENSO) events removed using the Foster and Rahmstorf (2011) approach. Chart by Carbon Brief.
However, this approach – which relies on a historical lag of around three months between peak ENSO conditions in the tropical Pacific and global surface temperature response – may not fully reflect El Niño effects on 2023. As discussed earlier, the fact that El Niño occurred on the heels of unusually-long La Niña conditions may have contributed to an earlier global temperature response than has been seen in other recent strong El Niño events.
Observations broadly in line with climate model projections
Climate models provide physics-based estimates of future warming given different assumptions about future emissions, greenhouse gas concentrations and other climate-influencing factors.
Here, Carbon Brief examines a collection of climate models – known as CMIP6 – used in the 2021 science report of the IPCC’s sixth assessment. In CMIP6, model estimates of temperatures prior to 2015 are a “hindcast” using known past climate influences, while temperatures projected from 2015 onward are a “forecast” based on an estimate of how things might change.
The figure below shows how observations compare to the full ensemble of 37 CMIP6 models (under the middle-of-the-road SSP2-4.5 emissions scenario for future projections). The blue line represents the average of all the models and the grey areas showing the 5th to 95th percentile range. Observational temperatures are plotted on top of the climate model data, with individual observational records represented by red lines of different shades.
The chart illustrates how observations have generally been below the model average over the past two decades and are slightly above model average in 2024.
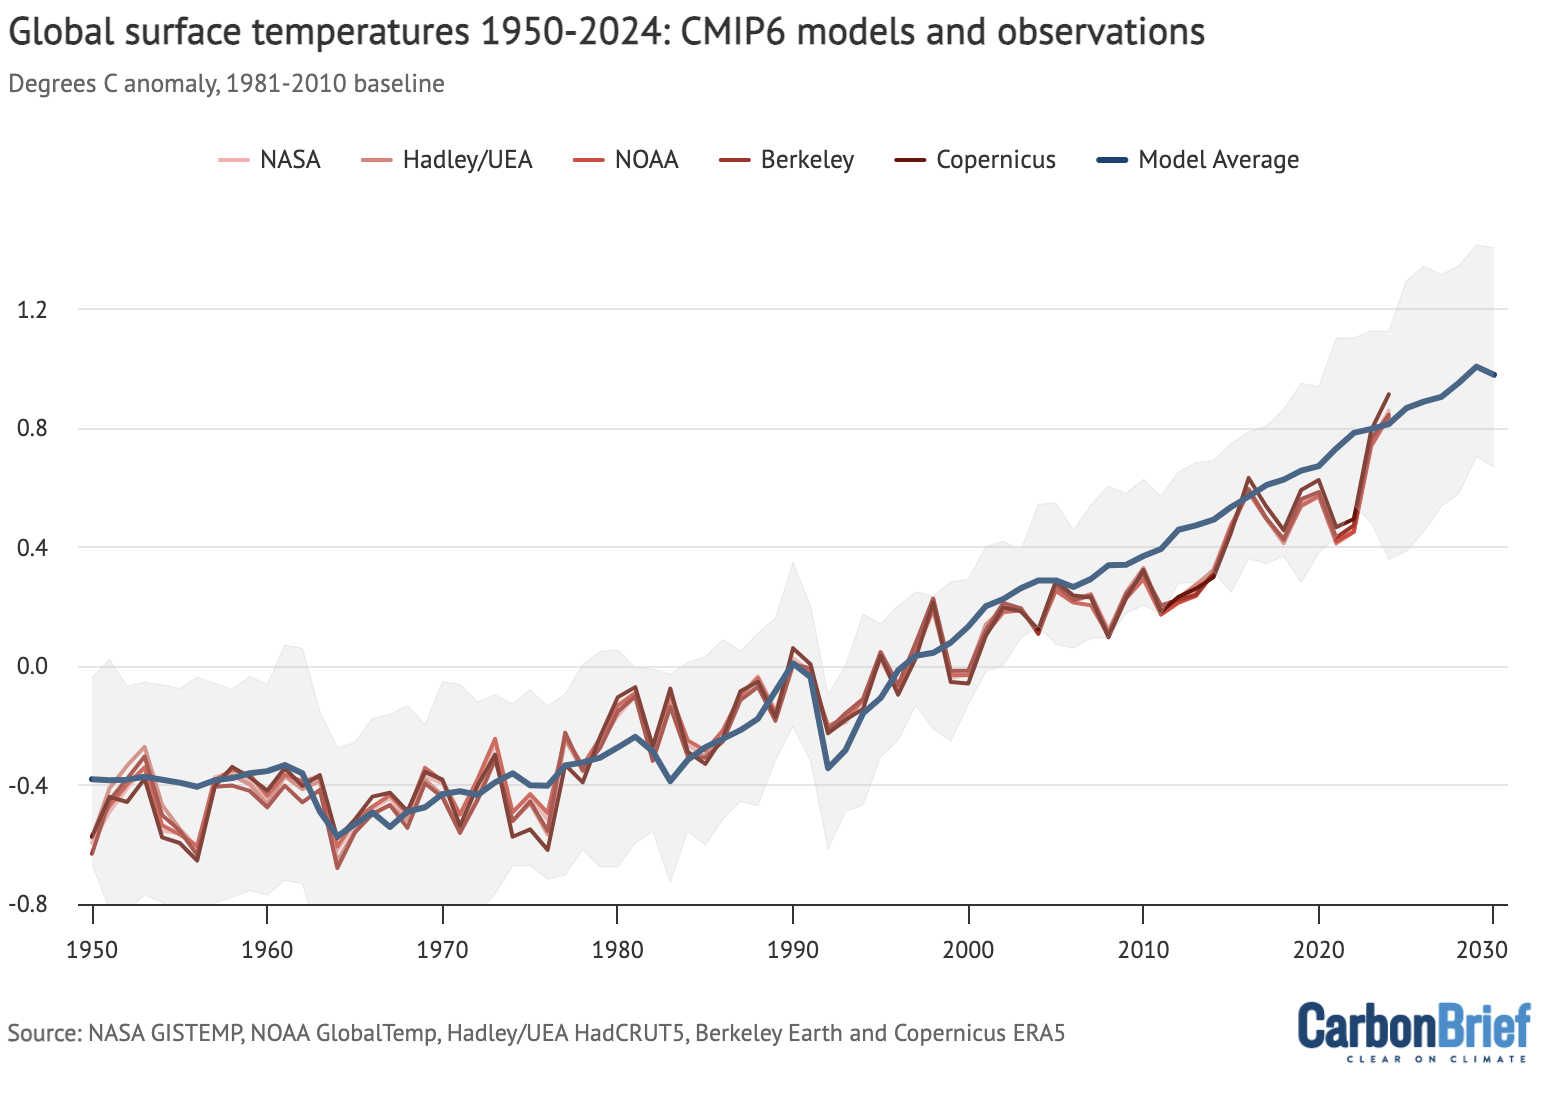
Annual global average surface temperatures from CMIP6 models and observations between 1950 and 2030 (through 2024 for observations). Models use the SSP2-4.5 scenario after 2015. Anomalies plotted with respect to a 1981-2010 baseline. Chart by Carbon Brief.
The CMIP6 ensemble is marginally more challenging for this comparison than past generations of CMIP because a subset of its models have unrealistically high climate sensitivity and they reproduce historical observations poorly. To account for this, rather than simply averaging all the models – as had been done in prior assessments – the IPCC employed an approach that effectively weights models by their performance. As a result, the models align better with the range of climate sensitivity derived from multiple different lines of evidence.
In the chart below, the blue line shows the average of 22 different models whose transient climate response (TCR) falls within the IPCC’s “likely” range (which results in temperature projections nearly identical to the IPCC-assessed warming). The grey area shows the 95% (two standard deviation) range of the TCR-screened model projections.
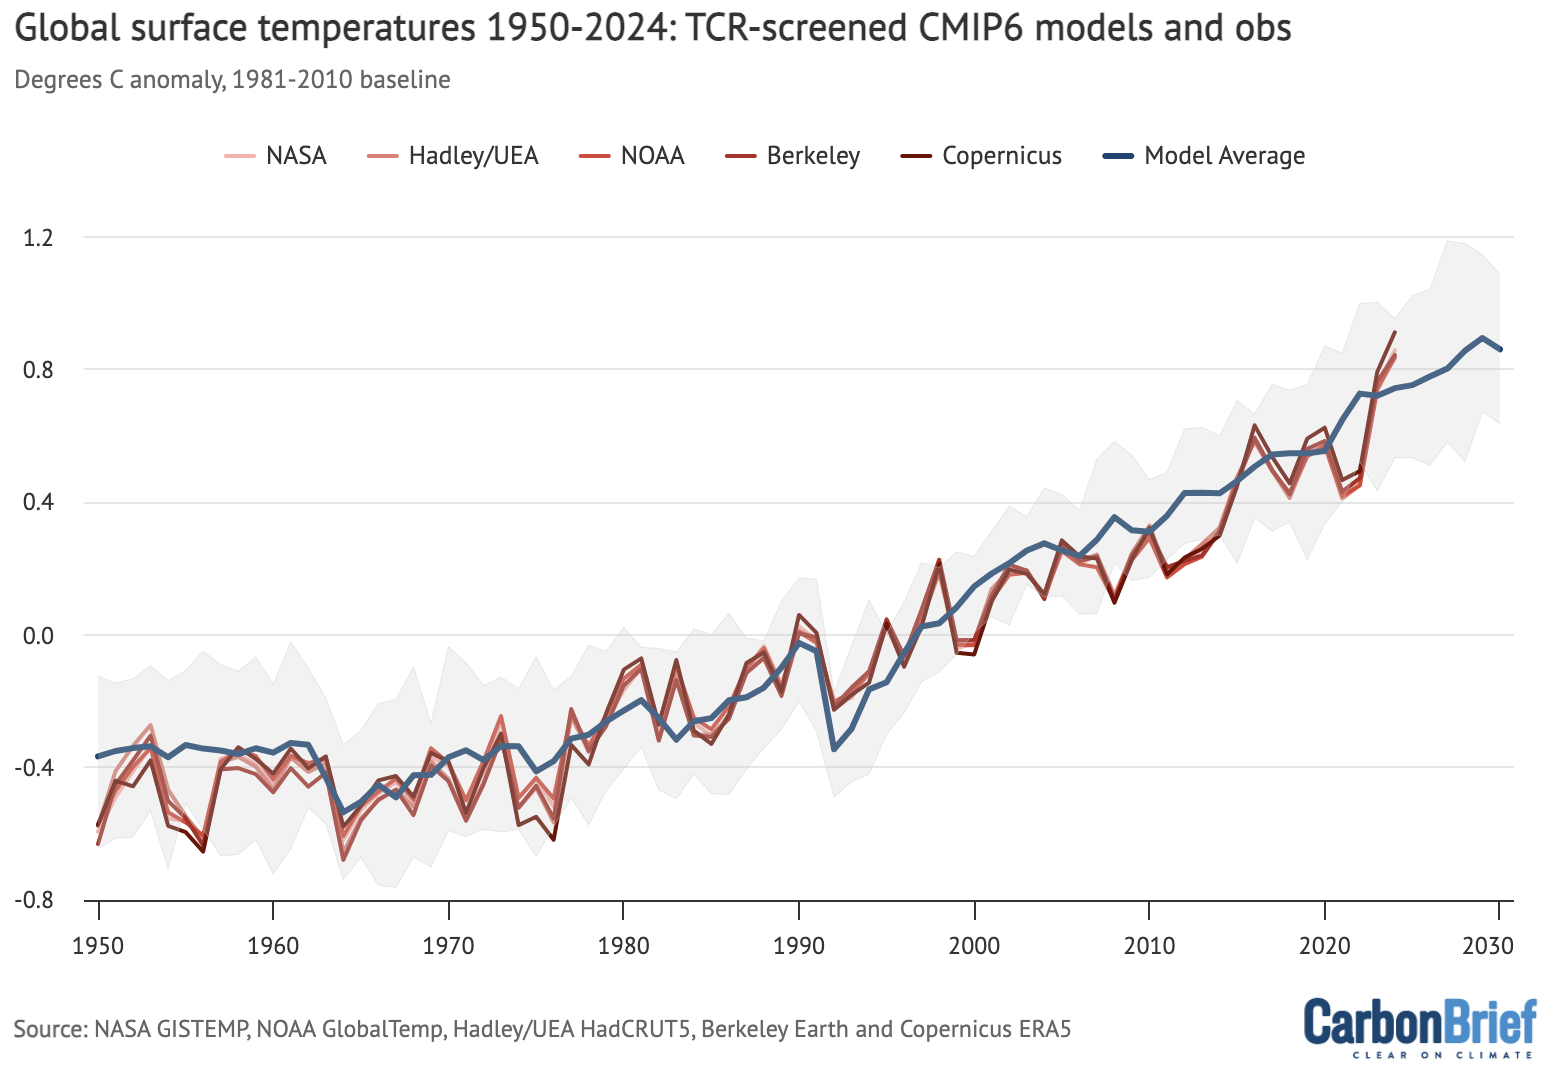
CMIP6 models compared to observations as in the prior chart, but models are screened to only include those models with a transient climate response (TCR) in-line with the IPCC’s “likely” range as discussed in Hausfather et al (2022). Anomalies plotted with respect to a 1981-2010 baseline. Chart by Carbon Brief.
The chart reveals that observed global surface temperatures (red lines) are further above the multimodal average, but remain well within the range of TCR-screened model runs.
This might be surprising given the focus on 2023 and 2024 being unusually warm. However, climate models broadly expect an acceleration of warming in the current period in a scenario like SSP2-4.5 where emissions of CO2 and other greenhouse gases continue to modestly increase, but emissions of planet-cooling aerosols like sulphur dioxide are rapidly reduced.
Record atmospheric temperatures
In addition to surface measurements over the world’s land and oceans, satellite microwave sounding units have been providing estimates of temperatures at various layers of the atmosphere since 1979.
The lowest layer of the atmosphere that satellite microwave units provide temperature estimates for is the lower troposphere. This data reflects temperatures a few kilometres above the Earth’s surface. It reveals a pattern of warming in the lowest troposphere that is similar – though not identical – to surface temperature changes.
The records produced by Remote Sensing Systems (RSS), the University of Alabama, Huntsville (UAH) and NOAA show 2024 as the warmest year on record in the lower troposphere. The chart below shows the three records for the lower troposphere.
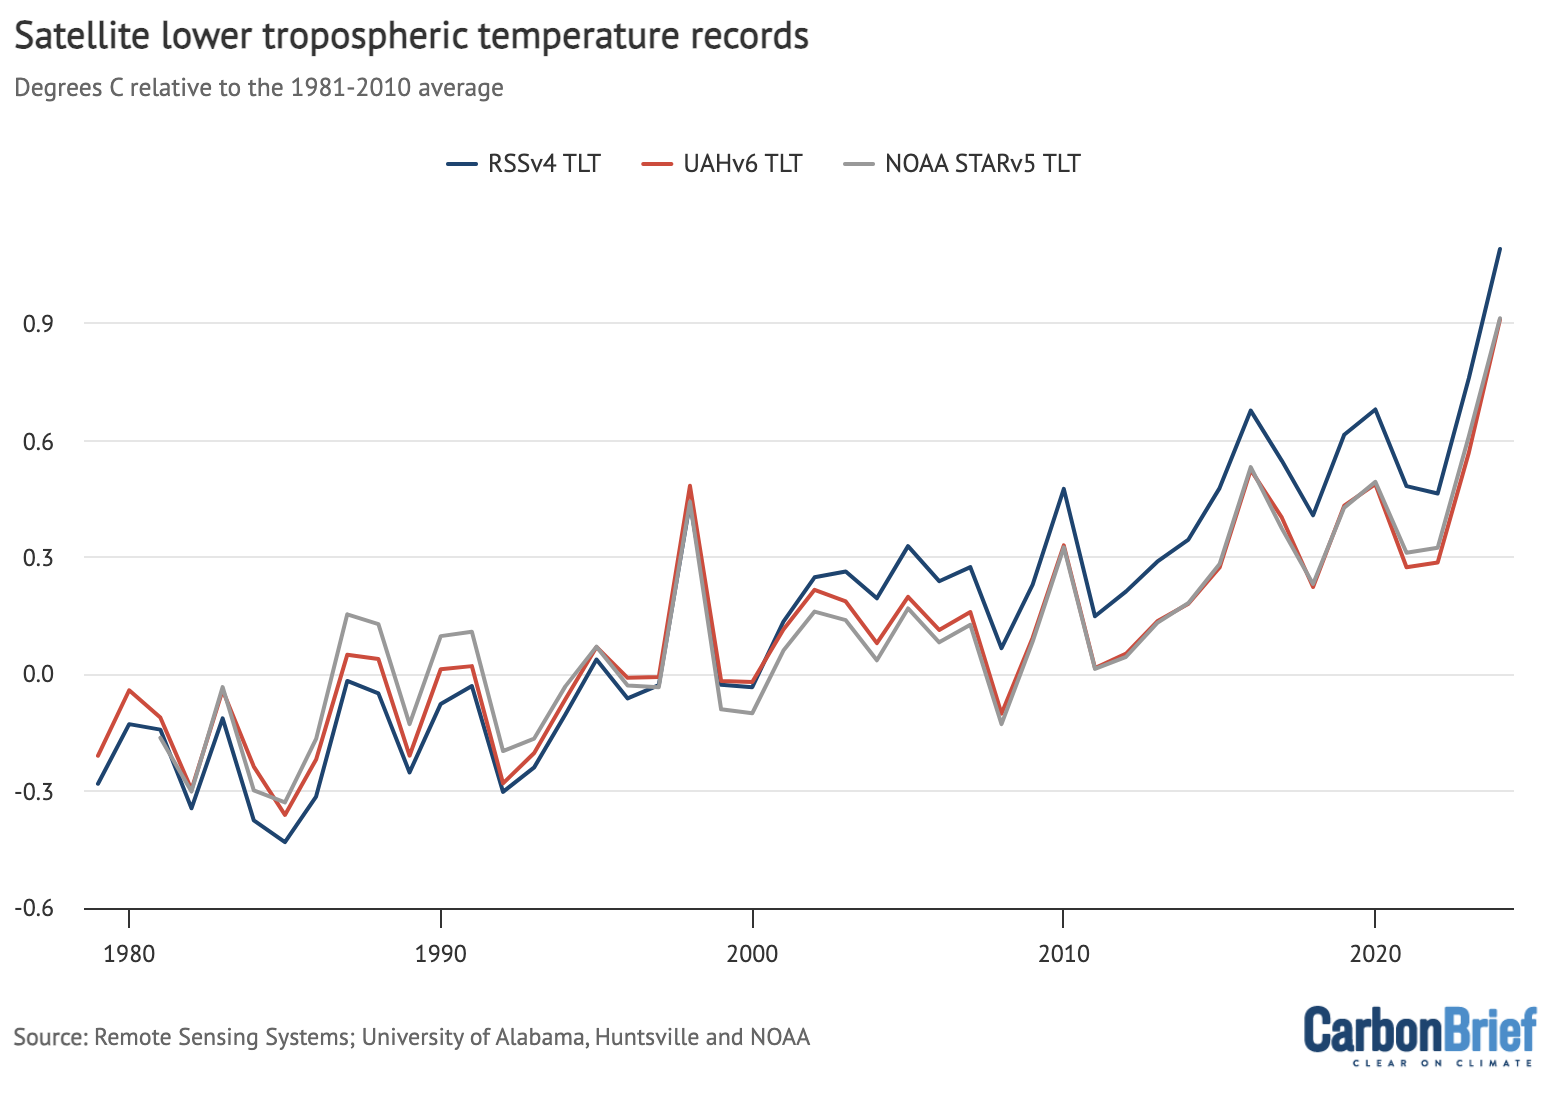
Global average lower-troposphere temperatures from RSS version 4 (blue), UAH version 6 (red) and NOAA STAR version 5 (grey) for the period from 1979-2024, relative to a 1981-2010 baseline. Chart by Carbon Brief.
The lower troposphere tends to be influenced more strongly by El Niño and La Niña events than the surface. Therefore, satellite records show correspondingly larger warming or cooling spikes during these events. This explains why the year-on-year increase in lower-troposphere temperature – of around 0.3C – seen in 2024 is larger than the ~0.1C increase in surface records.
The lower-tropospheric temperature records show large differences after the early 2000s. RSS shows an overall rate of warming quite similar to surface temperature records, while UAH and NOAA show considerably slower warming in recent years than has been observed on the surface.
Greenhouse gas concentrations reach new highs
Greenhouse gas concentrations reached a new high in 2024, driven by human emissions from fossil fuels, land use and agriculture.
Three greenhouse gases – CO2, methane (CH4) and nitrous oxide (N2O) – are responsible for the bulk of additional heat trapped by human activities. CO2 is by far the largest factor, accounting for roughly 42% of the increase in global surface temperatures since the pre-industrial era (1850-1900).
Methane accounts for 28%, while nitrous oxide accounts for around 5%. The remaining 25% comes from other factors including carbon monoxide, black carbon and halocarbons, such as CFCs.
Human emissions of greenhouse gases have increased atmospheric concentrations of CO2, methane and nitrous oxide to their highest levels in at least a few million years – if not longer.
The figure below shows concentrations of these greenhouse gases – in parts per million (ppm) for CO2 and parts per billion (ppb) for methane and nitrous oxide – from the early 1980s through to October 2024 for CO2 and September 2024 for CH4 and N2O (the most recent data currently available).

Global concentrations of CO2, methane (CH4) and nitrous oxide (N2O). Based on data from NOAA’s Earth Systems Research Laboratory. Note that the y-axes do not start at zero. Chart by Carbon Brief.
Sea level rise is speeding up
Modern-day sea levels have risen to a new high, due to a combination of melting land ice (such as glaciers and ice sheets), the thermal expansion of water as it warms and changes in land water storage.
In recent years, there have been larger contributions to sea level rise from melting ice sheets and glaciers, as warmer temperatures accelerate ice sheet losses in Greenland and Antarctica.
Since the early 1990s, the increase in global sea level has been estimated using altimeter data from satellites. Earlier global sea levels have been reconstructed from a network of global tide gauge measurements. This allows researchers to estimate how sea level has changed since the late 1800s.
The chart below shows five different modern sea level rise datasets (blue lines), along with satellite altimeter measurements as assessed by NASA (in black) after 1993. (As sea level rise data has not yet been released for the whole year, the 2024 value is estimated based on data through to October.)

Global average sea level rise reconstructed from tide gauge data between 1880 and 2024 from Frederikse et al 2020, Dangendorf et al 2019, Hay et al 2015, Church and White 2011, and Palmer et al 2021. Satellite altimeter data from 1993 (black) to present is taken from NASA. Chart by Carbon Brief.
Sea levels have risen by over 0.2 metres (200mm) since 1900. While sea level rise estimates mostly agree in recent decades, larger divergences are evident before 1980. There is also evidence of accelerating sea level rise over the post-1993 period when high-quality satellite altimetry data is available. (See Carbon Brief’s explainer on how climate change is accelerating sea level rise.)
Shrinking glaciers and ice sheets
A significant portion of global sea level rise is being driven by melting glaciers on land. Scientists measure the mass of glaciers around the world using a variety of remote-sensing techniques, as well as through GRACE measurements of the Earth’s gravitational field. The balance between snow falling on a glacier and ice loss through melting and the breaking off – or “calving” – of icebergs determines if glaciers grow or shrink over time.
The World Glacier Monitoring Service is an international consortium that tracks more than 130 different glaciers in 19 different regions around the world. The figure below shows the change in global average glacier mass from 1950 through to the end of 2023. (2024 values are not yet available.) Note that glacier melt is reported in metres of water equivalent, which is a measure of how much mass has been lost on average.

Global average glacier melt over the 1950-2023 period from the World Glacier Monitoring Service, in metres of water equivalent. Carbon Brief.
Greenland ice sheets have become a larger contributor to sea level rise in recent years due to accelerating loss of mass. The year 2024 was the 28th in a row where Greenland lost ice overall, with 80bn tonnes of ice lost over the 12 months from September 2023 to August 2024. Greenland last saw an annual net gain of ice in 1996.
The figure below shows the cumulative mass balance change – that is, the net ice loss – from Greenland between 1970 and October 2024. The authors find that Greenland has lost around 6tn tonnes of ice over the past 50 years – more than 700 tonnes lost per person for every person on the planet.

Cumulative ice loss from Greenland in billion metric tonnes (gigatonnes) between 1970 and 2024 from Mankoff et al 2021, updated through December 2024. Chart by Carbon Brief.
Near-record low Antarctic sea ice extent
Arctic sea ice was at the low end of the historical (1979-2010) range for most of 2024, but did not set any new all-time low records apart from a few individual days at the end of the year.
The summer minimum extent – the lowest recorded level for the year – was the seventh-lowest since records began in the late 1970s.
Antarctic sea ice, on the other hand, was the second lowest on record – after 2023 – for much of the year. Taken together, 2023 and 2024 Antarctic sea ice extent was “way outside anything we have witnessed in our satellite record for their winter months”, an expert told Carbon Brief in October last year.
While long-term trends in Antarctic sea ice have been ambiguous in the past (unlike in the Arctic where there is a consistent long-term decline), there is increasing evidence that human-driven warming is starting to drive significant loss of sea ice in the region.
The figure below shows both Arctic (red line) and Antarctic (blue line) sea ice extent for each day of the year, along with how it compares to the historical range (corresponding shading).

Arctic and Antarctic daily sea ice extent from the US National Snow and Ice Data Center. The bold lines show daily 2024 values, the shaded area indicates the two standard deviation range in historical values between 1979 and 2010. The dotted black lines show the record lows for each pole. Chart by Carbon Brief.
Looking ahead to 2025
There is reason for caution when estimating likely temperatures for 2025. In 2023, temperatures were significantly higher than predictions made at the start of the year, while 2024 temperatures were towards the high end of annual predictions.
At the same time, there is strong reason to expect that 2025 will be cooler than 2024. As noted earlier, 2024 temperatures were boosted by more than 0.1C by a strong El Niño event that has largely faded by the start of 2025. While global land temperatures remain quite elevated, sea surface temperatures have begun to fall in recent months, and weak La Niña conditions are starting to develop in the tropical Pacific.
It seems unlikely that a strong La Niña will develop in 2025, and it is quite possible that the world remains in ENSO neutral conditions with no formal La Niña being declared for the first half of the year. There is even a small chance that the world will re-enter El Niño conditions by the latter part of 2025 – though most models forecast neutral conditions to persist, as shown in the figure below.

There have been four published predictions – from the UK Met Office, NASA’s Dr Gavin Schmidt, Berkeley Earth and Carbon Brief (in this article) – of what temperatures might look like in 2025.
The figure below shows the four different 2025 predictions compared to the average of six different temperature records (NASA, NOAA, Hadley, Berkeley, Copernicus and the Japanese JRA-3Q reanalysis) used by the World Meteorological Organization (WMO). These have been “normalised” to show 2025 warming relative to 2024 in the WMO dataset. This is to remove any differences in predictions due to divergences in the baselines used by different temperature records.
Carbon Brief’s prediction of likely 2025 temperatures is based on a statistical model using the average temperature of the past year, the latest monthly temperature and projections of ENSO conditions over the first three months of 2025.

Temperature projections for 2025 from the UK Met Office, NASA’s Dr Gavin Schmidt, Berkeley Earth and Carbon Brief, relative to pre-industrial (1850-1900) temperatures and compared to the historical average of six different datasets produced by the WMO. Chart by Carbon Brief.
The Met Office, Dr Schmidt, Berkeley Earth and Carbon Brief estimates all have 2025 most likely ending up as the third-warmest year on record, after 2024 and 2023. However, it is still possible that it could be as high as the second-warmest year or as low as the sixth-warmest year, depending on how global temperatures evolve in the coming months.
Against a 1880-99 pre-industrial baseline, the central estimate of all four forecasts for 2025 is around 1.4C warming, with the world relatively unlikely to top 1.5C again next year.
Ultimately, what matters for the climate is not the leaderboard of individual years. Rather, it is the long-term upward trend in global temperatures driven by human emissions of greenhouse gases. Until the world reduces emissions down to net-zero, the planet will continue to warm.
If global emissions remain on the current trajectory, the world will likely firmly pass 1.5C in the late 2020s or early 2030s, as shown in the figure below.

Annual global average surface temperatures from the composite average (black dots) along the 30-year LOWESS fit (red line), combined the AR6 assessed warming projection for SSP2-4.5 as published and without any baseline alignment. Chart by Carbon Brief.




The post State of the climate: 2024 sets a new record as the first year above 1.5C appeared first on Carbon Brief.
https://www.carbonbrief.org/state-of-the-climate-2024-sets-a-new-record-as-the-first-year-above-1-5c/

Chinese industry is beginning to shift from fossil fuels to clean electricity, with wind, solar and batteries progressively displacing coal, oil and gas across the industrial sectors that made the country the world’s factory and largest carbon emitter, a new analysis shows.
Clean electricity met all of China’s demand growth in 2025 and coal generation fell for the first time in a decade, even as electricity demand rose by 5%, the report found.
Despite a rebound in coal power generation in the first half of 2026, the analysis by global energy think-tank Ember found the growth in clean electricity illustrates a longer-term shift: a massive build-out of wind, solar energy and battery storage and deepening electrification of the economy are starting to make a dent in the fossil-fuel energy system supporting China’s industrial base.
China keeps Indonesia’s battery dream afloat but future less certain
The research identifies early signs that a structural transformation of China’s industrial economy from coal, oil and gas to clean electricity is underway, even if changes on the ground are not yet reflected in national data.
“The energy foundation of the Chinese industrial economy is shifting,” Muyi Yang, a senior energy analyst at Ember and the report’s lead author, told Climate Home News.
“Fossil fuels are progressively being replaced in the many functions they have historically assumed. Because of that, fossil fuel peaking is increasingly coming into view,” he said.
Electrifying industry
Coal generation has stopped growing in 17 of the 26 provinces and regions analysed by Ember between 2021 and 2025. This includes industrial centres such as Hunan in southern China and Shandong – home to energy-intensive industries like cement production. Together, these regions are home to more than half of China’s thermal power capacity.
A greater share of the Chinese economy is now running on electricity than in other major economies, accounting for 29% of final energy consumption in 2024, compared with about 23% in Europe and 21% in the US. Less than half of China’s electricity was generated from coal in the first half of the year.
-
China’s coal power rebounds as record clean energy goes to waste
Long-term contracts guarantee coal plants buyers regardless of demand, crowding out renewables, report finds -
China’s coal-chemicals boom risks repeating the mistakes of the past
By reviving the problematic industry in the name of energy security, China runs the risk of higher emissions, stranded assets and setting back its ambitions as a clean energy leader -
China’s carbon emissions rise again as more clean power is wasted
The economic powerhouse burned more coal and gas in the first quarter of 2026, despite record wind and solar build-out


Meanwhile, fossil fuel use has fallen in eight of 11 tracked industrial sectors, declining between 26% and 71% from peak consumption levels across fossil fuel extraction, manufacturing industries such as textiles, machinery and food and beverages, transport equipment and chemical materials.
Earlier this year, German company BASF, the world’s largest chemical producer, opened a new facility in southern China, which is fully supplied by renewable energy. The company said emissions from the site could be 50% lower than conventional petrochemical facilities.

In easier-to-electrify sectors such as machinery, electronics and textiles, electricity now supplies about three-quarters of final energy consumption, Ember found.
Fossil fuel use is also showing signs of flattening in the metals smelting and processing sector – one of the most fossil-intensive parts of the economy – offering “encouraging signs” that the transformation is starting to take hold in harder-to-abate sectors, said Yang.
“If that is happening in more and more provinces, and more and more economic sectors that means that fossil fuels are progressively being squeezed out of the energy system,” he said.
“Growing by greening”
China’s vast cleantech manufacturing power has become an engine for growth in its own right, spurring investment, creating jobs and generating export revenues.
Yang described this “growing-by-greening” dynamic as “turning each step of the transition into a source of strength for the next”.
China and Brazil join pledge to triple global nuclear energy capacity
For Li Shuo, director of China Climate Hub at the Asia Society Policy Institute, this is part of what makes China’s lead in manufacturing clean energy equipment “irreversible”, comparing its growth with that of a rainforest, where different parts of the ecosystem thrive by reinforcing one another.
The early success of deploying wind and solar helped drive down electricity costs, which created favourable conditions for the rapid adoption of electric vehicles (EVs) and in turn boosted demand for batteries that are now critical to balance the grid.

An oversupply of renewable energy incentivised industrial players to benefit from cheap and readily available clean power generation, encouraging innovative solutions to electrify other parts of the economy. In the transport sector, for example, electrification is moving from passenger vehicles to harder-to-electrify trucks.
This abundance of cheap green energy is also making China competitive in what has long been seen as the anchor of Western competitiveness, Li said.
Stalling fossil fuel use
At the same time, China’s huge legacy fossil fuel generation capacity is still expanding, even as coal power plants are being used less intensively.
China brought 30 GW of new coal power capacity into operation in the first six months of the year and coal-fired generation rose 3% over the same period after local governments fast-tracked coal projects to prevent a repeat of severe power shortages in 2021.
Solar surge kept fossil electricity flat in 2025 as China and India made ‘historic’ shift
A further 274 GW of coal capacity is either under construction or has permits to be built while vast amounts of solar and wind power that could not be absorbed by the grid have gone to waste in the first half of the year.
“This doesn’t mean that the transition is losing steam,” said Yang, arguing that China is now grappling with some of the more complex aspects of the transition.
A recent analysis by the Centre for Research on Energy and Clean Air (CREA) for Carbon Brief found that China’s CO2 emissions from fossil fuels and cement have plateaued for more than two years following a peak in March 2024. Ember found that on a 12-month moving average, coal generation has been stalling since then, following years of continuous expansion.
-
EU, UK lead push for electrification as “powerful weapon” against fossil fuels
A group of dozens of countries seeks to build momentum for a COP31 pledge to electrify 35% of global energy use by 2035 as an alternative to fossil fuels -
COP31 leaders unveil global targets, with spotlight on electrification
Co-hosts Türkiye and Australia want countries to sign on to global targets in three of their priority areas for this year’s COP climate negotiations -
Africa can lead the Age of Electrification
The electrification agenda presents both an extraordinary opportunity for Africa and an immense challenge for the continent



In the second quarter of the year, CO2 emissions fell by 1% after China’s oil consumption plummeted 9% as the US-Iran war prevented the transport of oil cargoes from the Gulf through the Strait of Hormuz.
The electrification of the transport sector, particularly electric trucks, was the biggest driver in displacing oil demand as the conflict in the Middle East accelerated the transition.
A lesson in sequencing
China’s bumpy transition offers a useful lesson for other countries at an earlier stage of their transition, said Xunpeng Shi, president of the Sydney-based International Society of Energy Transition Studies (ISETS), a global network of professionals that shares research and fosters collaborations.
“Build quickly enough so that clean electricity can start taking over and prepare for the pressure on the fossil system before it arrives, because that is the part nobody has done easily,” he said.
For countries that are heavily reliant on revenue from fossil fuel exports, a peak in Chinese fossil fuel use weakens the assumption of rising demand on which investments have long been made.
“For them, the time to plan for that is now, while the revenues are still there,” he said.
The post China’s industrial engine starts to break its fossil fuel habit appeared first on Climate Home News.
China’s industrial engine starts to break its fossil fuel habit
Carbon credit developers, corporate buyers and some leading conservation NGOs are challenging new proposed rules to stop UN carbon credits being wiped out by fire, drought or logging, in what critics have called a “coordinated lobbying campaign” to weaken the nascent market’s push for greater integrity.
According to documents seen by Climate Home News – including a briefing given to government officials – companies, NGOs and the UN Environment Programme (UNEP) have contested the scientific basis for the move, arguing that stronger protection for carbon reductions could hike project costs and restrict the supply of credits to the market.
The climate benefit of credits that claim to reduce or avoid greenhouse gas emissions by storing carbon is undone if that carbon is released back into the atmosphere – something known as reversal risk. To protect against such losses and preserve the credibility of the credits’ carbon-offsetting claims, projects are generally required to set aside a reserve of credits that cannot be sold, as a form of insurance.
How these “buffer pools” are calculated has long been a source of contention, especially in forest conservation projects, which many experts say have historically underestimated the risk of carbon losses.
In July, the technical UN panel tasked with drafting rules for the Article 6.4 mechanism, which underpins the credits that countries and companies can use to meet their climate goals, proposed a new system. It would require project developers to size these insurance pools of credits based on local risk values derived from new research published by a group of independent scientists.
UK’s budget juggling trick with rainforest loan for bus-fare cap needs transparency
Its supporters have hailed it as a more rigorous approach than current practice in the voluntary carbon market, which largely relies on expert guesswork and, in some cases, gives significant leeway for project developers to come up with their own data.
“The decision on the reversal risk assessment tool will be crucial,” said Federica Dossi, an expert at Brussels-based advocacy group Carbon Market Watch. “It would bring a new paradigm for calculating the number of units forwarded to the buffer pool based on empirical data.”
The technical panel is due to discuss the reversal risk tool and its application to a specific set of projects at a five-day meeting in Bonn this week. It is then expected to forward new recommendations to the mechanism’s regulator, the Supervisory Body, for a decision on whether to approve them at a meeting in early October.
The rules are set to be applied initially only to clean cookstove projects, one of the market’s most popular and heavily criticised credit types. They could then be extended to other activities, including programmes to protect forests.
Copy and paste?
More than 30 organisations aired their views in lengthy public submissions to the Article 6.4 mechanism, responding to a call from the UN secretariat for external feedback.
A Climate Home News review of those submissions found that there was significant overlap in their messages and, in several cases, sections of the text, or even entire submissions, were copied and pasted by different organisations. This points to a coordinated effort to flag concerns regarding the new rules.
In one instance, tech giant Apple, a large buyer of nature-based carbon credits, warned against relying on one scientific model and called for rules that let project developers use a variety of risk mitigation tools, rather than surrendering buffer credits, to cover the risk of carbon losses.
Apple’s submission is a lightly-edited version of a separate input presented by the Beyond Alliance, a coalition of corporate buyers and NGOs that promote market-based climate investments. In an apparent oversight in one paragraph, the Beyond Alliance’s name appears in Apple’s submission instead of the tech giant’s.
-
Most “zombie credits” locked out of new UN carbon market after China and India snub
Fears of a flood of environmentally-dubious carbon credits have faded, with most old projects not able to transition to new UN market -
UN’s first Paris Agreement carbon credits face human rights and climate concerns
Civil society groups allege the cookstove project in Myanmar exaggerated its climate impact while maintaining ties with military junta


The Beyond Alliance told Climate Home News that, after receiving input from its members, it shared its final submission, leaving them to decide if and how they wanted to use it. The coalition rejected any characterisation that its submission advocates for a weaker tool and only reflects business concerns.
The Beyond Alliance added that its members received briefings by UNEP, which Climate Home News understands has played an important role in wider efforts to influence the development of the rules underpinning the UN carbon market.
Three experts and a European Union diplomat told Climate Home News that the interventions of the UN agency overwhelmingly supported the views of those with a financial interest in carbon markets.
UNEP’s head of mitigation Gabriel Labbate rejected this accusation. He told Climate Home News that the UN agency contributes technical inputs from a “politically-neutral, science-based perspective” and its positions are grounded in an assessment of environmental integrity and are not shaped by, or aligned with, the financial interests of any market participant.
UNEP, NGOs criticise scientific basis
In mid-July, representatives from UNEP, Conservation International and The Nature Conservancy (TNC) briefed government officials from Canada, the UK, Germany, Costa Rica, Belgium, Nigeria and Peru, according to a webinar readout seen by Climate Home News.
The online event was organised by the Forest & Climate Leaders Partnership (FCLP), an initiative that brings together 41 countries plus the EU.
The speakers voiced strong criticism of the new proposed rules. A technical advisor to Conservation International, a US-based NGO that runs several large-scale carbon offsetting programmes, told participants the Article 6 panel’s approach was “based on bad science”. This, he said, is because it relies on a single model that he claimed is not appropriate to determine buffer pool contributions, according to a presentation seen by Climate Home News.
During a high-level discussion led by UNEP’s Labbate, speakers said the application of measures to manage reversal risk on cookstove projects could “impose disproportionate costs and undermine the financial viability of these activities”, according to the readout.

Cookstove programmes issue credits by calculating the greenhouse gas emissions prevented by burning less fuel – usually wood or charcoal – through the use of more efficient stoves. With the new reversal risk tool, these activities would be expected to guard against future carbon losses for the first time under the UN carbon market.
But UNEP, as well as leading NGOs and carbon credit firms, have pushed back against the requirement, arguing this type of credit represents a “flow” of avoided emissions rather than a “stock” of stored carbon that can be released. Scientists reject that distinction, noting that the wood left unburned is still standing in a forest exposed to the same risks as any other.
At the online briefing, speakers also raised concerns that the tighter approach would be replicated for nature-based carbon projects with a direct impact on the future of large-scale forest conservation credits. The Conservation International advisor called it a “bad precedent”.
Both Conservation International and TNC run carbon credit programmes that aim to protect trees from being cut down. Labbate leads the UN-REDD programme, which supports countries developing forest protection initiatives including through carbon credits, and is co-chair of the expert panel advising the Integrity Council for the Voluntary Carbon Market (ICVCM).
After the webinar, the organisers shared by email a series of “key messages” and draft submissions produced by the three organisations, which participants were invited to consider and adapt in their own inputs to the Article 6.4 consultation process.
Getting the rules ‘right’
In a statement to Climate Home News, Ghana, Paraguay and the UK – which are FCLP co-leads for its work on forest carbon credits – said members of the coalition welcomed expert views from a range of partners to help them understand the potential impact of Article 6.4 rules on the eligibility of forest carbon credits in international markets.
They added that the FCLP does not have a common position on the rules and its members are free to choose whether to attend webinars and use any of the materials circulated.
In a statement to Climate Home News, Conservation International said “getting these rules right is important to the environmental integrity of the carbon market, while ensuring all sectors have a place in it”. It added that the NGO does not dispute the validity of the scientific research underlying the proposed buffer pool, but recommends a broader approach including multiple models and datasets.
A spokesperson for TNC said the organisation had helped clarify complex materials and their potential implications, while decisions on how to respond remained entirely with participating countries.
‘Inconvenient science’
The scientific basis for the disputed reversal risk tool rests on two pieces of research. A peer-reviewed study, published in Nature in May and led by scientists at several US universities, modelled forest carbon-loss risk across the United States and found existing buffer pools there are undersized by an average factor of six.
To extend that approach worldwide, the Article 6.4 panel also drew on a second, global analysis by the same research team, which has not yet completed peer review. That study used satellite images, weather records and computer modelling to estimate a 31-42% chance of forests worldwide losing stored carbon within 100 years, depending on the scenario.
The panel picked one of these scenarios and turned its estimates into fixed risk percentages for individual countries, and in some cases provinces, which projects in those locations would need to apply.
Palestine: Israel’s bombing has left Gaza vulnerable to climate change
Critics say the peer-reviewed portion of the research was calibrated on North American forests, and that applying the same approach to other regions relies on a global study that is still going through academic checks.
But, for William Anderegg, professor of biological sciences at the University of Utah and one of the authors of that research, it is the best science currently available. He described it as “light-years better” than assumptions underlying the voluntary carbon market, where risk numbers are not generally based on independent evidence and tend to be incredibly low.
Scientific research, including by Anderegg, has found that buffer pools in forestry projects in the voluntary carbon market are substantially smaller than they should be to adequately protect against future releases of carbon.
“There really seems to be a fairly coordinated campaign to try to weaken the strength of these [Article 6.4] tools and their scientific underpinning,” he told Climate Home News. “It’s a little dispiriting to see folks attack science that’s inconvenient.”
Regulators under pressure?
An EU diplomat told Climate Home News that experts and negotiators working on the Article 6.4 mechanism have faced intense pressure from big carbon credit developers and large parts of the nature-based solutions community.
“It is very clear that they are lobbying against strong rules, and they want to align the Paris Agreement mechanism with the standards of the voluntary carbon market,” the diplomat said. “They have influence, time and money, even more than some governments, so they can be very effective in their efforts.”
Last year, the Article 6.4 Supervisory Body, the new market’s regulator, approved rules on the permanence of credits aiming to remove carbon from the atmosphere which critics said were watered down compared to the technical panel’s recommendations. This followed feedback from carbon market firms and conservation NGOs, which submitted dozens of critical views.
EU carbon credits could supercharge world’s clean cooking push, France says
Carbon Market Watch’s Dossi said decisions that strengthen environmental integrity are targeted in particular as they tend to reduce the number of credits that can be issued.
Then, as now, those who opposed tighter rules argued that overly strict safeguards would make some projects too expensive to carry out, with a negative impact on local communities and the climate.
But proponents argue that higher-integrity programmes will drive up market prices, ultimately benefiting everyone.
“If rules ensuring better-quality credits make them somewhat more expensive than they are today, that’s an acceptable consequence, not a reason to weaken the rules, especially since these credits will be used to offset continued emissions,” said Dossi.
Efforts to pull the rule-makers in different directions are expected to intensify in the coming weeks as a decision on the new credit protection system nears.
“I really don’t know how this will turn out in the end,” one veteran carbon market expert said. “What I am sure about is that it will be quite a battle.”
The post Industry and NGOs lobby to weaken UN carbon credit rules in “coordinated” push appeared first on Climate Home News.
Industry and NGOs lobby to weaken UN carbon credit rules in “coordinated” push
A relatively ambitious deal to reduce the shipping industry’s 3% of global emissions now looks more likely after four days of closed-door talks in London, observers say.
The International Maritime Organization (IMO), which oversees the negotiations, said there had been “constructive discussions” and “genuine willingness within the group to make concrete further progress”.
Em Fenton, senior director at the NGO Opportunity Green who attended the talks last week, said they “demonstrated a strong spirit of solidarity in the face of blatant attempts to undermine the credibility, ambition and equity of a hard-fought multilateral agreement”.
After several years of debate, governments provisionally agreed in April 2025 on a “Net-Zero Framework” (NZF) – a series of emissions reduction targets for shipowners aimed at incentivising them to use cleaner fuels, backed up with financial rewards for meeting the targets and fees for missing them.
But in October 2025, after a high-profile intervention by US President Donald Trump and threats of US sanctions and visa restrictions, the US convinced a majority of voting nations to postpone the adoption of the NZF for a year.
UCL analysis found that, of those who expressed a view at last week’s talks, 38 were in favour of an NZF-style solution while only 17 were against. Those opposed are “consistently composed of strongly fossil fuel-aligned governments”.
An observer of the talks, who did not want to be named, said the countries opposed include the US, Russia, India, Thailand, Argentina, Ecuador and Uruguay, as well as eight oil-rich Gulf nations and shipowner-reliant Liberia and Panama. Governments that support an NZF-style deal include China, Brazil, Mexico, Türkiye, Canada, Australia, Chile, nine African nations, most European countries and small islands.
A new framework to tackle shipping emissions could be adopted if two-thirds of countries that are present and signed up to a regulation called Marpol Annex VI – endorsed by just over 100 states – vote in favour of it, as they did in April 2025.
UCL’s analysis said it was “reassuring” that governments which had taken strong positions in the media against the NZF were being more compromising in the negotiations.
Tweaks are probable
While there is majority support for the NZF, UCL said adopting it would be difficult politically. “The process from here could therefore be as much about producing what appears to be a new package, but one that broadly ends up with similar outcomes in relation to objectives,” UCL argued.
But tweaking the NZF, which resulted from years of negotiations, comes with risks, it warned. For example, changes could reduce the new system’s planned support for low-income countries, turning them against it. Fenton said compromising should not mean “abandoning the principle of justice in the maritime transition”.
UCL said the speed at which shipowners must reduce their ships’ emissions or face fees is likely to be reduced in the short-term but raised in the long-term to meet a goal of net zero emissions by mid-century.
-
Palestine: Israel’s bombing has left Gaza vulnerable to climate change
With homes, hospitals and water storage destroyed, Palestine’s government says that Gazans have little protection from climate impacts and sets conditional emissions targets -
More support needed to power Africa’s food systems with renewables, experts say
Renewable energy could help African food businesses boost productivity and competitiveness, but the upfront cost, fragmented markets and limited financing stand in the way -
Loss and damage fund urged to hold crisis meeting on Nepal
The new fund is coming under pressure from developing nations to respond quickly to climate disasters rather than just financing longer-term projects



This was a compromise put forward by NZF-supporter Brazil. However, an analysis by the the Institute of Marine Engineering, Science and Technology (IMarEST) has found that this change would lead to more overall emissions than the original NZF trajectory.
UCL has warned it could incentivise liquefied natural gas as a shipping fuel over greener options, which include hydrogen-based methanol and ammonia.
Analysis by UCL and the Rocky Mountain Institute suggests that, while a slower start to the NZF would reduce transport costs in the short term, it would increase them later due to the costs involved in switching the industry over from more polluting fuel to cleaner fuel.
NZF won’t meet emissions goals
IMarEst’s analysis finds that even in its current form – the most ambitious deal on the table – the NZF will not be sufficient for shipping to meet its emissions reduction goals.
It says that only a Pacific proposal to place a levy on ships’ total emissions – rather than just those above a certain level – would meet the industry’s targets to reduce emissions 20% between 2008 and 2030, 70% by 2040 and then reach net zero “by or around, i.e. close to 2050”. This is highly unlikely to be adopted.
Additional talks will be held from November 23-27 and from November 30-December 3 before a potentially final round of official negotiations begins on December 4.
The post London talks raise hopes for green shipping deal appeared first on Climate Home News.


-
Climate Change1 year ago
Guest post: Why China is still building new coal – and when it might stop
-

 Greenhouse Gases2 years ago
嘉宾来稿:满足中国增长的用电需求 光伏加储能“比新建煤电更实惠”
-
Greenhouse Gases1 year ago
Guest post: Why China is still building new coal – and when it might stop
-

 Climate Change2 years ago
嘉宾来稿:满足中国增长的用电需求 光伏加储能“比新建煤电更实惠”
-

 Renewable Energy11 months ago
Sending Progressive Philanthropist George Soros to Prison?
-
Climate Change2 years ago
Bill Discounting Climate Change in Florida’s Energy Policy Awaits DeSantis’ Approval
-
Greenhouse Gases1 year ago
嘉宾来稿:探究火山喷发如何影响气候预测
-

 Carbon Footprint2 years ago
US SEC’s Climate Disclosure Rules Spur Renewed Interest in Carbon Credits