
The UK government has set out a long-awaited plan explaining how it will cut emissions in the 2030s, on its legally bound path to net-zero by the middle of the century.
Under the Climate Change Act, the government must lay out “carbon budgets” that set limits on the UK’s emissions over five-year periods.
In 2021, the government announced it would cut emissions by 78% by 2035 under its sixth carbon budget, but the “delivery plan” detailing how this would be achieved proved contentious.
The new “carbon budget and growth delivery plan” (CBGD) is the third draft, after the previous two delivery plans were successfully challenged in court.
Unlike previous versions, in this plan the government concludes that it has sufficient climate policies to achieve its sixth carbon budget and “96-99%” of its international obligations under the Paris Agreement.
This is in spite of the government scaling back its expectations for various climate policies, including clean-hydrogen production, tree-planting and carbon capture and storage (CCS).
The CBGD plan comes amid a fractured political consensus in the UK on climate action, with the Conservative party vowing to repeal the Climate Change Act and the hard-right Reform UK party repeatedly attacking net-zero.
Below, Carbon Brief gives an overview of the 363 pages of documents included in the plan, what it says about meeting UK emissions targets and what it means for individual sectors.
- Why is there a new ‘carbon budget delivery plan’?
- What does the new delivery plan say?
- How does the new delivery plan meet the UK’s emissions targets?
- What does the delivery plan mean for the UK economy?
Why is there a new ‘carbon budget delivery plan’?
This is the third version of the sixth carbon budget delivery plan produced by the UK government, with the previous two having been ruled unlawful by the High Court.
The then-Conservative government passed the sixth carbon budget in 2021, legislating an emissions cut of 78% below 1990 levels by 2035. Carbon budgets are interim targets that act as “stepping stones” on the pathway to net-zero emissions by 2050.
However, in July 2022, the High Court ruled that the government had breached sections 13 and 14 of the Climate Change Act in adopting the delivery plan for the budget.
These sections refer to the government’s duty to prepare and adopt policies to meet its climate targets and publish on these policies so that parliament and the public can “scrutinise” them.
It ruled that the then-secretary of state Kwasi Kwarteng had “insufficient knowledge” to adopt the plan, as he did not know what emissions savings individual policies would be responsible for.
The plan also lacked “critical information” on a number of elements – for example, the reason for a shortfall in the emissions cuts, according to the claimants Friends of the Earth, ClientEarth and Good Law Project.
The High Court ordered the government to revise its strategy to correct these errors and a new plan was published in March 2023.
Once again, this was challenged in the High Court. The same claimants argued that the government did not consider “delivery risk” in a lawful way or publish sufficient information to allow meaningful scrutiny of its net-zero policies, among other breaches of sections 13 and 14.
In May 2024, the court sided with the claimants, finding that the secretary of state – by that time Claire Coutinho – had not been adequately informed about the delivery risks associated with the proposed policies. It also called for transparent, evidence-based policies to meet the carbon budget.
The government was given a new deadline of May 2025 to publish another version of the delivery plan. This was later extended to October 2025, as a result of last year’s general election.
What does the new delivery plan say?
The new plan includes an overview document highlighting the government’s key political messages and a 238-page report laying out the details of expected emissions cuts.
The government emphasises how its policies will help the UK to “take back control of our energy” by expanding domestic renewables – cutting bills and boosting jobs in the process.
It also highlights how Labour’s climate plans will improve “quality of life and health”, plus help to “protect our natural environment”.
Other components of the delivery plan include a “technical annex” with details of modelling and accounting, an “investor prospectus” that outlines net-zero investment opportunities in the UK and a methane action plan, with sectoral plans for cutting the greenhouse gas.
The plan confirms that the government has all the climate policies in place to meet the UK’s fourth and fifth carbon budgets, covering the period 2023-2032.
Crucially, it also establishes that the government has enough extra policies in the pipeline to ensure 100% of the emissions cuts required for the sixth carbon budget are also achieved.
This is a step up from the plan released by the previous Conservative government, which only covered 97% of the cuts required for the period 2033-2037.
The new report explains that 76% of emissions cuts for the sixth carbon budget are covered by policies that have already been “implemented, adopted or planned”.
The remaining emissions cuts come from 169 additional proposals and policies that have been modelled by the government for the coming years, ranging from electrified steel plants to accelerated rates of tree-planting. The plan also accounts for another 12 “early-stage” proposals.
In addition to its domestic carbon-budget goals, the UK also has international climate targets under the Paris Agreement, known as nationally determined contributions (NDCs).
Unlike carbon budgets, which provide flexibility by allowing a set amount of emissions over a five-year period, the UK’s NDC goals involve specific emissions-reduction targets for single years, compared to a 1990 baseline.
The government calculates that its plans will cut emissions by 66% below 1990 levels by 2030 and 81% by 2035. These reductions are just shy of the UK’s NDC targets for 2030 and 2035 – representing 96% and 99% of the required cuts, respectively.
(Notably, the 2030 NDC target is more ambitious than the UK’s domestic climate target for that period, as the latter was set prior to the UK committing to net-zero emissions by 2050.)
In the delivery plan, the government says it will “seek to improve delivery and, where appropriate, will explore further measures, to ensure that the UK will meet its international commitments”.
The CBGD plan also considers the risk that government climate programmes underdeliver – for example, due to slow consumer uptake of low-carbon technologies.
Part of the legal case against the previous iteration of the plan was centred on its lack of adequate information about delivery risk. The new strategy appears to include a more extensive consideration of risk, stressing that there are “mechanisms in place to monitor and mitigate risks for each individual policy”.
It also states that the emissions savings for each policy are “credible” because, in cases where risks could not be avoided, the government revised down the emissions savings.
As a result, it concludes
“We, therefore, have confidence that each and every proposal and policy will deliver its planned scenario emissions savings.”
How does the new delivery plan meet the UK’s emissions targets?
The government’s CBGD plan lays out what it describes as a “credible level of emission savings”, enabling the UK to hit all of its upcoming domestic carbon budgets under the Climate Change Act.
Yet, a striking aspect of the plan is that the government has, in fact, significantly scaled back its expectations for several important sectors.
Government forecasts of low-carbon hydrogen production and peatland restoration are among the elements that have been downgraded since the 2023 plan. Expectations for biofuel-crop planting have also dropped to zero hectares in the near term.
Some of these policy areas have underperformed so far, such as tree-planting, or are less-established technologies, such as industrial carbon capture and storage (CCS).
These deployment assumptions have been highlighted in red in the table below. The relatively few sectors that have seen ambition ramped up are highlighted by Carbon Brief in green, while those that have remained steady since 2023 are grey.
Comparison of sectoral deployment assumptions in the new carbon budget delivery plan (2025), compared to previous versions from 2023 and 2021. Source: DESNZ. Chart: Carbon Brief
The rolling back of expectations for key emissions-cutting policies raises the question of how the new plan can still put the UK on track to meet its sixth carbon budget, which covers the period 2033-2037.
First, the “baseline” emissions from which future reductions are calculated is considerably lower in 2025 than it was in the 2023 delivery plan.
This is largely because a set of policies that were previously “under development” have now been integrated into the baseline, as they are considered “implemented or developed”.
These include the zero-emissions vehicle (ZEV) mandate to encourage electric-car sales and the “sustainable aviation fuel” (SAF) mandate to drive the uptake of “clean” aviation fuels.
Together with some modelling adjustments, these changes reduced baseline emissions by 46.1m tonnes of carbon dioxide equivalent (MtCO2e) during the sixth carbon budget period. This shrinks the emissions gap that must be filled by upcoming climate policies and proposals.
Crucially, there are also three new categories of emissions savings that the Labour government has introduced, all of which further reduce this gap.
First, the government has captured the impact of various societal shifts that could affect decarbonisation, using the term “wider factors” to describe such changes. As an example, it mentions “developments in digital technologies including AI”.
Together, the plan states that these factors could “credibly” cut emissions by an extra 99MtCO2e in the sixth carbon budget period.
Second, the government also has a new category termed “other early-stage policies and proposals”. These are ideas deemed too preliminary to fully model, except for the sixth carbon budget period, during which the government estimates they could contribute an extra 43MtCO2e in emissions cuts.
Among these proposals are marine CO2 removals, saltmarsh restoration and policies to boost the market for “low-carbon industrial products”.
Finally, another 24MtCO2e over the sixth carbon budget period comes from what the government calls “cascade effects”. These “occur when changes in one system propagate through connected systems” – for example, when the uptake of net-zero technology becomes a “social norm”, the plan explains.
The combined impact of these three additional factors – none of which were considered in the 2023 plan – can be seen in the chart below.
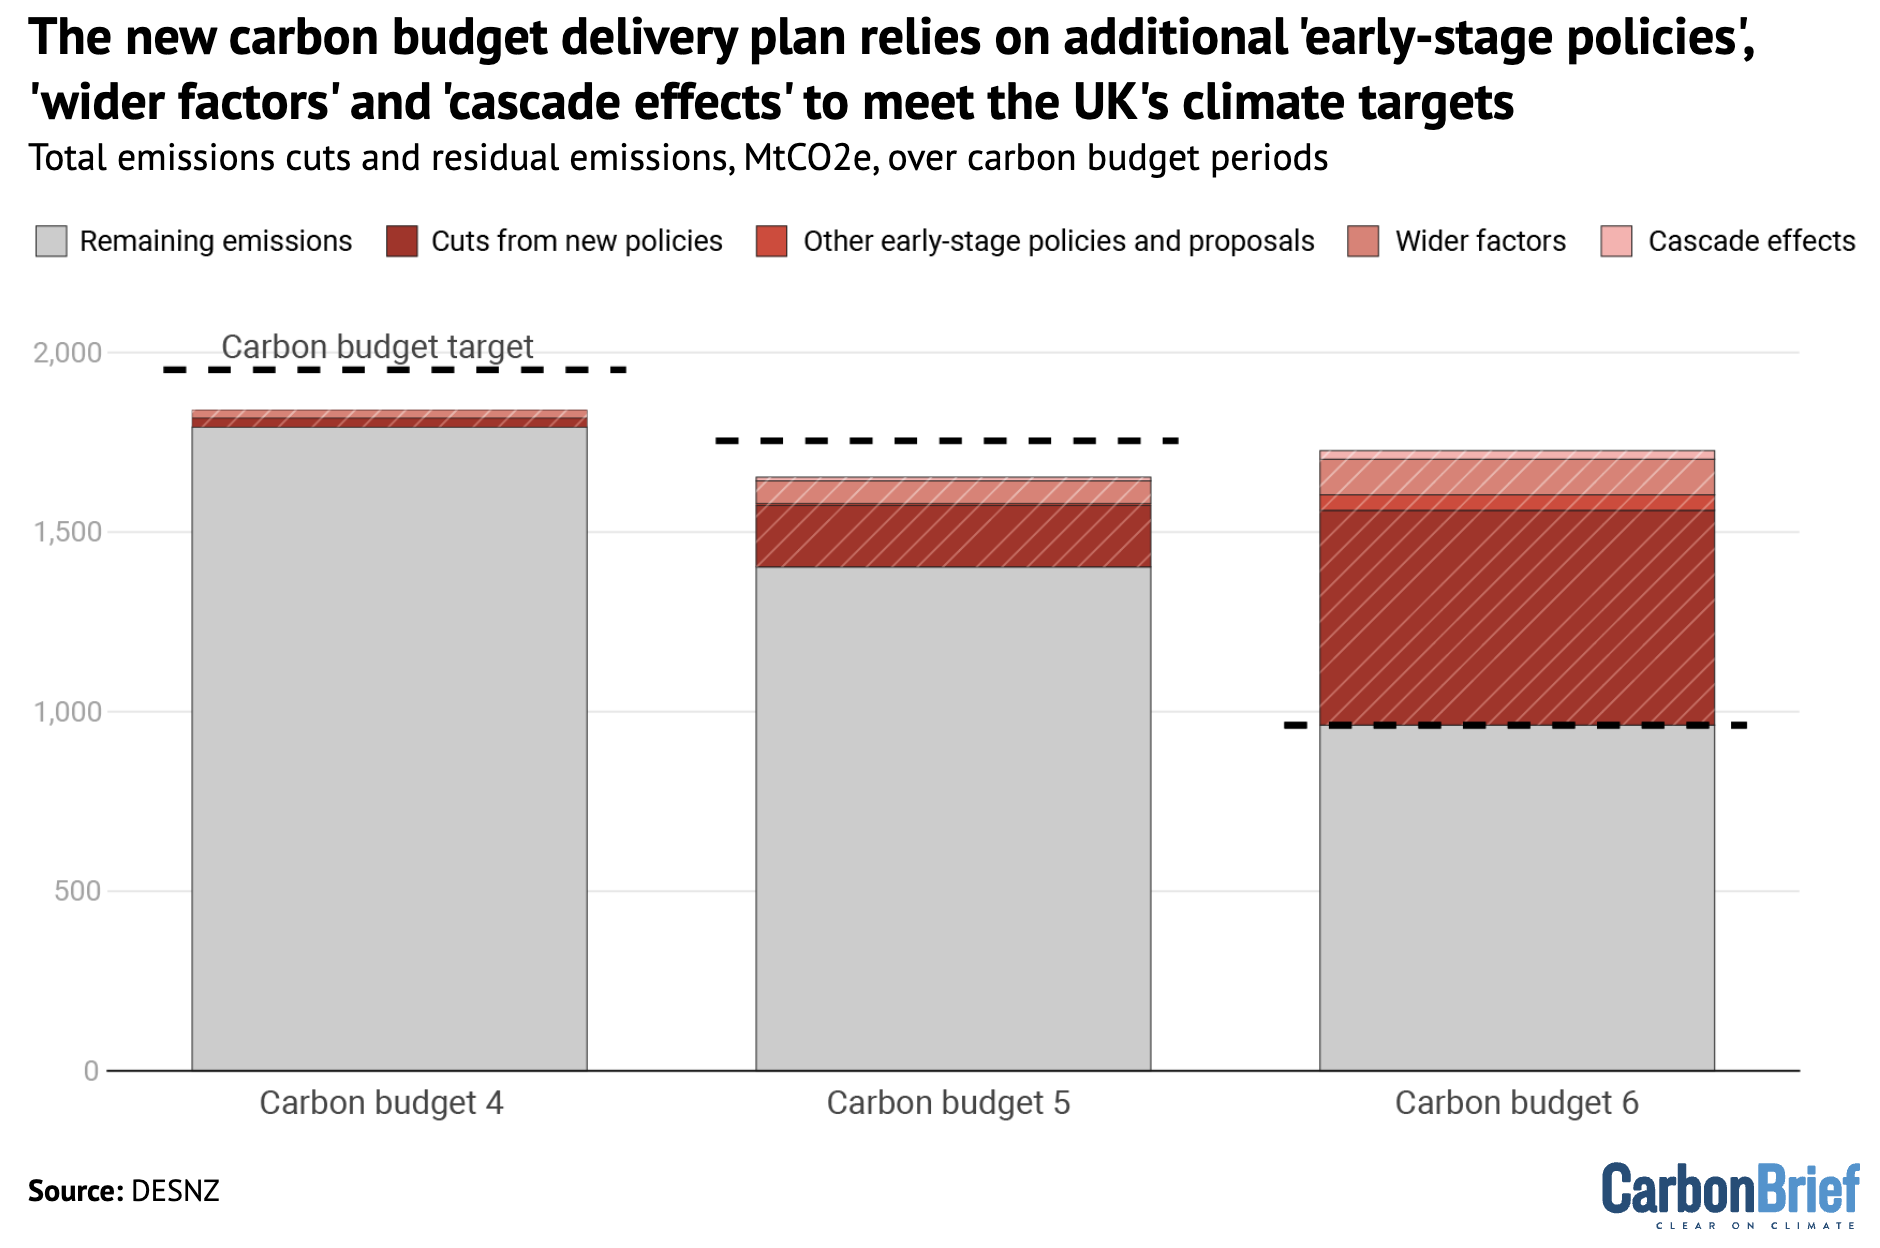
Collectively, these components help to cut the remaining emissions during the sixth carbon budget period by 34MtCO2e, compared to the 2023 plan, in the government’s forecast. This is enough to meet the target, according to the government, rather than breaching it by 32MtCO2e as the previous plan did.
What does the delivery plan mean for the UK economy?
The CBGD plan includes an overview of how the government plans to make changes across different sectors of the economy, in order to bring down their emissions in the 2030s.
Transport
The transport sector continues to be the UK’s biggest source of emissions, accounting for 26% of the country’s total, the CBGD plan says. This figure rises to 35% when the UK’s contribution to international aviation and shipping is considered.
In 2023, road travel accounted for around 90% of domestic transport emissions, the plan continues, chiefly from journeys by petrol cars and vans.
After entering power in July 2024, the Labour government met a manifesto pledge to reinstate a 2030 ban on the sale of new petrol and diesel vehicles.
This target was originally set by the Conservative government under Boris Johnson’s leadership in 2020, but then delayed to 2035 by Rishi Sunak in 2023 as part of a wider rollback of net-zero policies.
Johnson’s government had also pledged to introduce a zero emissions vehicle (ZEV) mandate to set specific sales targets for car manufacturers in the lead up to the ban.
The ZEV mandate came into force in January 2024. Labour’s CBGD plan notes that it is “driving sales that made the UK Europe’s largest zero-emission car market in 2024 and the third largest globally”.
However, despite growing numbers of EVs on UK roads, the market is currently set to miss the ZEV mandate for 2025. In May, EVs accounted for 21.8% of new car registrations, below the 28% target set by the ZEV mandate.
In April this year, the government made some “tweaks” to the ZEV mandate, including introducing rules allowing manufacturers to count hybrid and plug-in hybrid vehicles towards their pure EV sales goals.
In a letter to the transport secretary, the Climate Change Committee warned that the changes “could encourage a greater role for hybrid vehicles and a reduction in emissions savings”.
In addition, Labour’s CBGD plan sets out less ambitious targets for the total proportion of ZEV cars on UK roads than previous strategies set out under the Conservatives in 2021 and 2023.
Namely, the CBGD plan sets targets of 21% of all cars being ZEV by 2030 and 48% by 2035. This compares to targets of 24% by 2030 and 53% by 2035 set under the 2021 net-zero strategy.
The government’s new CBGD plan notes that key risks to delivering its planned cuts to transport emissions include that “zero emission cars and vans do not displace their petrol and diesel counterparts at the rate we forecast”. This is as a result of lower than anticipated demand or “wider global supply chain challenges”.
Another key risk could be “unanticipated growth in travel demand”, with this being “most acute for our projections of emissions from cars, vans and air travel”, the plan says.
Commentators have noted a lack of new action in the plan to tackle emissions from rising demand for air travel in the UK.
Juliet Michaelson, director of climate charity Possible, said in a statement that the plan “still lacks realistic thinking on the most difficult to decarbonise areas, such as aviation”.
Colin Walker, head of transport at the Energy and Climate Intelligence Unit (ECIU), added that the government is continuing to “pin its hopes for cutting aviation emissions on sustainable aviation fuels and technological innovations that are still very much in their infancy”, while “failing to encourage ultra-frequent flyers from making more sustainable choices”.
Heat and buildings
Buildings remain one of the biggest sources of emissions in the UK, accounting for 74MtCO2e in 2023, or 17% of the country’s emissions.
This is predominantly due to the use of gas in heating systems, with 85% of UK homes using the fossil fuel to keep warm, according to the NGO Nesta.
However, efforts to decarbonise emissions from heating, in particular, have been viewed as contentious in some sections of the UK media, with outlets often referencing the “fury” of the public at policies dubbed “boiler bans” or “boiler taxes”.
One of the most significant policies to cut emissions in the sector is the “warm homes plan”, which the government is planning to publish “shortly”. The plan was set to be published in October, but is now expected after the autumn budget in November.
The scheme was first announced in spring 2025 by the newly appointed Labour government, with the goal of lifting more than a million households out of fuel poverty by 2030. During the spending review over the summer, the government said £13.2bn would be allocated to the scheme.
The policy is set to support the rollout of heat pumps and heat networks, alongside energy efficiency measures and other technologies, such as solar and batteries. More details are set to follow when the warm homes plan is published.
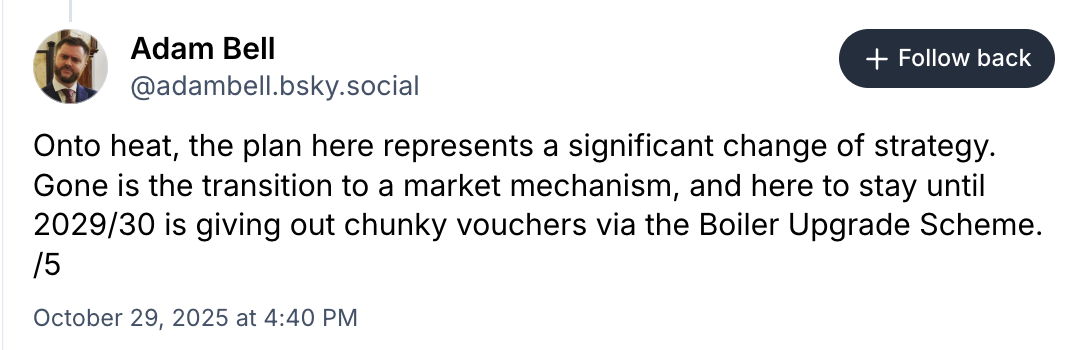
Beyond this, the CBGD plan includes other previously announced policies, such as the “boiler upgrade scheme”, which provides vouchers of up to £7,500 to support the rollout of heat pumps. The plan notes that the budget for this scheme has been almost doubled this financial year to £295 and funding will continue to increase each year up to 2029/30.
The delivery plan states that the government’s “vision is that, over the next decade, low-carbon solutions will become the natural choice for all households”.
It adds that, by the early 2030s, the government expects that more than one million existing homes will transition to low-carbon heating, as part of the “normal cycle of replacing an existing heating appliance (such as a gas boiler) at the end of its life”. By 2035, low-carbon heating will represent the majority of all heating-system replacements.
This new target seems to take over from the previous goal of 600,000 installations a year by 2028, which was included in the previous two versions of the CBGD plan. While the number of installations has been increasing, the UK has consistently fallen short of the level needed to meet this goal.
Additionally, the delivery plan removes the controversial “ban” on the sale of gas boilers in 2035, set under the previous Conservative government. The government notes that it will “continue to refine” its approach in coming years and consider additional interventions if needed.
The delivery plan’s technical annex notes that the modelling does not include any use of hydrogen for heating at present, but that the government will consult on it further in the future. It adds:
“As hydrogen is not yet a proven technology for home heating, any role would come much later and would likely be limited. If we conclude that hydrogen could play a role then some of the savings to be delivered by heat pump deployment in on gas grid homes could instead be delivered through hydrogen heating.”
Industry, CCS and hydrogen
In 2023, the UK’s industry emissions were 64MtCO2e, equivalent to 15% of total territorial emissions, the government says.
According to the CBGD plan, this represents a 12% decrease from 2019 levels and a 60% drop from 1990 levels.
The plan notes that the industrial sector “has a significant contribution to make to enable carbon budgets to be met”.
In June, the government set out a 10-year industry strategy, which it says aims to “drive long-term sustainable, inclusive and secure growth through securing investment into crucial sectors of the economy”.
The plan says that the government will also set out a “refreshed industrial decarbonisation plan”, which will “set the strategic direction for our approach to working with industry towards a competitive and low-carbon industrial base in the UK”.
It continues that the government is “looking at what could be delivered with further government action on resource and energy efficiency, fuel switching and CCUS [carbon, capture, utilisation and storage]”.
The plan says that the government is supporting fuel-switching and energy efficiency through its industrial energy transformation fund, which was launched in 2020 with plans to support the deployment of projects until 2028. (In July, the government confirmed that it is closing the fund to new applicants.)
In June, Miliband confirmed that £200m will be provided to progress the Acorn carbon capture and storage (CCS) scheme in Aberdeenshire, Scotland.
Despite this, the CBGD plan is less ambitious on both industrial resource efficiency and industrial CCS than previous net-zero strategies under the Conservatives in 2021 and 2023.
The government’s 2021 net-zero strategy set a target of industrial resource efficiency providing 11MtCO2e in savings by 2035. However, the CBGD plan has a target of just 5.4MtCO2e.
In addition, the 2021 net-zero strategy targeted 7MtCO2e of industrial CCS by 2035. The CBGD plan targets just 4.3MtCO2e.
The CBGD also cuts back a separate target for engineered greenhouse gas removal (GGR) techniques to provide 5MtCO2 in emissions savings by 2030, first made in the 2021 net-zero strategy.
(Engineered GGRs are technological methods for removing CO2 from the atmosphere, such as by using giant fans to suck the gas out of the air.)
The CBGD revises down this target to just 0.51MtCO2 a year from 2028-32.
Commenting on this decision, Prof Steve Smith, a GGR scientist at the University of Oxford, posted on LinkedIn, saying:
“This revision is reflective of the fact that little-to-no removal tech has actually been deployed in the UK since the 5Mt target was set. 2030 is really not far away in project development terms. We know from 20 years of experience with emission reductions that plans often fall behind (e.g. home insulation, CCS). Sensible strategy involves pursuing new technologies while being live to the risk of over-optimism in them.”
On hydrogen, the CBGD plan says the government is continuing to “support the rollout of hydrogen production to meet demand across sectors requiring hydrogen to decarbonise”.
It notes that, as part of the autumn 2024 budget, the government confirmed support for 11 green hydrogen projects and shortlisted another 27 projects for potential approval in April 2025.
However, the CBGD also significantly reduces ambition on clean hydrogen production, compared to previous net-zero strategies.
The CBGD targets 4 terawatt hours (TWh) of clean hydrogen production by 2030 and 24TWh by 2035. This compares to 40TWh by 2030 and 80-140TWh by 2035 under the 2021 net-zero strategy.
On LinkedIn, Harry Smith, an industrial emissions expert at the consultancy Aether, posted that the “deployment of low-carbon hydrogen no longer meets the 2030 targets set out in the 2021 UK hydrogen strategy”.
A new hydrogen strategy is due to be published this autumn.
Electricity
The power sector now makes up 10% of the UK’s emissions, accounting for around 44MtCO2e in 2023. Of this, gas combustion makes up around 75%.
Overall, the sector has decarbonised significantly, with CO2 emissions per unit of electricity falling by more than two-thirds in a decade, according to previous Carbon Brief analysis.
This is due to the rollout of renewable energy technologies and the closure of coal-fired power plants.
However, the UK has some of the most expensive electricity in the world. While this is due predominantly to gas prices – which set the wholesale cost of electricity 98% of the time – it remains a challenge for driving decarbonisation through electrification.
The cost of electricity in the UK is a key focus of the CBGD plan, which notes:
“The price disparity between electricity and gas needs to be addressed to make it more attractive for consumers to install clean technologies like heat pumps. Over this parliament, the government will be working relentlessly to translate the much cheaper wholesale costs of clean power into lower bills for consumers. This will be core to every decision we make. We will set out our plan in due course.”
The new CBGD plan does not include “rebalancing” the cost of gas bills relative to electricity, as the previous delivery plan did. It also does not consider shifting levies away from electricity bills.
Instead, the focus is broadly on the expansion of clean-power technologies, predominantly through pre-existing policies.
This includes investing in 80 power networks and enabling infrastructure projects, costing an estimated £40bn annually in the coming years. The plan recognises that the electricity network “must undergo unprecedented expansion”. (It is worth noting that, with or without net-zero targets in place, the UK’s grid would need constant investment and upgrades.)
The government also notes that it will work to “ensure appropriate planning arrangements, acceleration of grid connections and strong supply chains” to underpin this.
For example, the “strategic spatial energy plan” was commissioned to the National Energy System Operator in October 2024 and aims to “support a more actively planned approach” to electricity infrastructure.
The CBGD plan often points to the Clean Power 2030 Action Plan, published in December 2024, which set out the government’s approach to decarbonising the electricity sector by 2030.
It states that the government is investing “record amounts in clean energy, climate and nature”, including £63bn in capital funding.
The plan specifically highlights a final investment decision that was taken earlier this year to build Sizewell C nuclear power plant in Suffolk, with £14.2bn in funding allocated to the project. The government has also brought in reforms to the upcoming contracts for difference renewable energy subsidy auction to “maximise competition between bidders and reduce the costs to consumers”.
In addition, the first projects by the government’s new, publicly owned clean-energy company, Great British Energy, have also now been launched.
To support the rapid expansion of power-sector infrastructure, the plan notes that the “urgent need for change means we must undertake a wide-ranging reform programme”.
Finally, the plan notes that “hydrogen to power” has the “potential to play a key role” in the electricity system, along with other technologies that offer flexibility, such as power CCUS and energy storage.
Farming and land use
In 2023, agriculture and other land use accounted for 11% of the UK’s total greenhouse gas emissions, when international aviation and shipping is included, the CBGD plan says.
It adds that cow and sheep farming “currently make up the largest share of these emissions”.
The CBGD lists some of the government’s major policies for cutting emissions from agriculture and land use.
This includes the environment land management schemes (Elms), a post-Brexit project to pay farmers to cut CO2 emissions and protect nature on their land, first introduced by Boris Johnson’s government in 2020.
The CBGD plan says that “half of all farmed land” is now under Elms and that spending for the schemes will increase from £800m in 2023-24 to £2bn by 2028-29.
The National Farmers Union (NFU) has previously called the claim that spending had increased “misleading”, as farmers were originally promised a figure of £2.4bn a year from Elms after Brexit, the Guardian reported.
The largest of the Elms schemes is the sustainable farming initiative, the CBGD plan says.
In May, the government was forced to reverse a decision to close applications for the scheme after the NFU threatened legal action, according to Edie.
More widely, Labour’s plans to introduce an inheritance tax on farmers when businesses are worth more than £1m has caused mass protests across the country in recent months.
The CBGD plan revises down its deployment assumptions for the percentage of farmers taking up low-carbon practices, when compared to net-zero strategies from the Conservatives in 2021 and 2023.
Previous net-zero strategies set an assumption of 75% of farmers taking up low-carbon practices by 2030 and 85% by 2035. The CBGD sets assumptions of 67% by 2030 and 74% by 2035.
The Climate Change Committee has said the government must have a comprehensive plan for restoring peatlands if it is to meet the UK’s net-zero goal.
Healthy peatlands are carbon-rich habitats that support a range of species. However, some 80% of the UK’s peatlands are degraded, with the carbon they release accounting for 5% of the UK’s total greenhouse gas emissions.
The CBGD plan says that, under the Elms landscape recovery scheme, 35,000 hectares of peatlands will be restored, in addition to the 30,000 hectares targeted for restoration under a separate nature for climate peatland grant scheme.
However, the CBGD also revises down its deployment assumptions for peatland restoration, compared to previous net-zero strategies.
The 2021 net-zero strategy assumed that just over 10,000 hectares of peatlands would be restored in 2030. The CBGD plan has a lower figure of just under 8,000 hectares for the same date.
The CBGD plan also significantly revises down expectations for tree-planting, compared to previous strategies.
The 2021 net-zero strategy assumed that 40,000 hectares of new trees would be planted in 2030. The CBGD has a much lower number of 7,455 hectares for 2030.
Tom Cantillon, senior analyst at the Energy and Climate Intelligence Unit (ECIU), noted in a statement that the CBGD plan “seems to reduce ambition” on restoring peatlands and planting trees. He adds:
“With climate change worsening flooding in the UK, unless we work with nature by planting more trees and restoring habitats like peatlands to capture rainfall, people’s homes and farmers’ fields will be at ever greater risk.”


The post Q&A: The UK government’s ‘carbon budget delivery plan’ for 2035 appeared first on Carbon Brief.
Q&A: The UK government’s ‘carbon budget delivery plan’ for 2035
Climate Change
As Storms Pummel Hawaii, the Western U.S. Continues to Bake Amid Record-Breaking Heat Wave
Unusually high March temperatures are shattering records out West—and the heat wave isn’t over yet.
Communities across the Western United States are in for another week of unusually high temperatures amid an ongoing and historic early-season heat wave. It has broken March temperature records in nearly 180 cities, including Phoenix, which hit 105 degrees Fahrenheit last Thursday.
As Storms Pummel Hawaii, the Western U.S. Continues to Bake Amid Record-Breaking Heat Wave
At CERAWeek, Energy Secretary Chris Wright urges a patriotic surge in oil production, but industry titans warn that the U.S.-Iran war has fractured the global energy map beyond the reach of a quick fix.
Energy Secretary Chris Wright, a long-time apostle of fossil fuel expansion, issued a blunt directive to the world’s largest oil and gas producers on Monday: Produce more, and do it now.
White House’s ‘Drill Baby Drill’ Wartime Mandate Meets Volatile Market Reality
In recent years, the monsoon season in Pakistan has taken a new and dangerous turn.
July and August typically bring high levels of rainfall across the country, and while flooding isn’t uncommon, the extent and severity could be readily predicted.
These patterns have now changed. In 2022, extreme rainfall swept Pakistan and huge swathes of the country were under water. Sindh province experienced levels of rain 508% above average for the time of year.
Extreme weather in Pakistan is becoming the norm. The past 15 years have brought widespread flooding, loss of life and billions in financial costs. A post-disaster report, produced by the Pakistan Government, stated that the 2022 floods were “a wake-up call for systemic changes to address the underlying vulnerabilities to natural hazards”, citing the country’s lack of climate-resilient infrastructure.
But heavy rainfall is only one of the water-related issues that Pakistan faces. In a country with huge geographical diversity, from sweltering deserts to freezing mountain tops, the water stresses are equally as varied. In many regions the key concern is a lack of reliable, clean water that can be used to grow crops and feed families.
We must invest in early warning systems to tackle crises like Kenya’s drought
The risks of the Indus
The Indus River plays a critical role in Pakistan. This major artery travels almost the entire length of the country, an estimated 2,000 km, from the Himalayas to the Arabian Sea. It is a crucial economic lever, supporting nearly 90% of Pakistan’s food production and 25% of its overall GDP. What happens to this river – both human and natural impacts – has huge consequences for the rest of the country.
The government and civil society agree that urgent action is required to protect Pakistan’s fragile water resources. A new adaptation project – SAFER Pakistan – is seeking to address these concerns with solutions that can be used to solve similar climate-related issues elsewhere.
The US$ 10 million project is led by ICIMOD, an intergovernmental research centre, alongside UNICEF, and financed by the Adaptation Fund. The intention is to tackle six key issues that people face in the Indus Basin: cryosphere risks, drying springs, groundwater, pollution, unsustainable water use, and community resilience.
In practice this means exploring different solutions that put communities in control of their own adaptive capacity. One solution under development is the use of community early warning systems.
Pakistan’s ‘monster disaster’ brings climate compensation into focus
A warning sign
According to researchers, early warning systems “aim to empower affected communities against hazards and help them to sufficiently prepare before disasters strike.”
The northern provinces of Pakistan – Gilgit-Baltistan and Khyber Pakhtunkhwa – are the main focus for testing these systems. In this mountainous region the Indus is fed by thousands of glaciers which sustain water flow during the dry season. At the same time, increased temperatures and unpredictable weather patterns are changing how these glaciers behave, leading to avalanches, increased snowmelt, and landslides.
As glaciers start to melt due to climate change, they can form large lakes high up on the mountain that can pose a serious threat to the communities living below. When these natural dams fail, huge quantities of water come careening down the mountain, a phenomenon called glacial lake outburst flood.
The SAFER project is exploring how to use local knowledge and observations of the mountain to ensure people know how and when to evacuate when these outbursts occur. This human intelligence will be combined with data from remote sensors to save lives and livelihoods. In total, over 435,000 people will be impacted by the project.
“Early warning systems often serve as the backbone of a multi-faceted response to reduce climate disaster risk,” commented Mikko Ollikainen, head of the Adaptation Fund. “But local information is often just as valuable as the real-time data you receive from sensors or satellites,” he added.
Climate disasters challenge right to safe and adequate housing
Shaping an effective response
Community early warning systems – together with other preventive adaptation measures – are proving a popular solution to extreme weather events.
A separate adaptation project in the mountains of Central Asia is grappling with the same problem of glacial flooding. In this case, with US$6.5 million in funding from the Adaptation Fund, UNESCO has been implementing early warning systems across Kazakhstan, Kyrgyzstan, Tajikistan and Uzbekistan for the past five years, with considerable success.
Diana Aripkhanova, a project officer at UNESCO, and based in Kazakhstan, told Climate Home that glacier lake outburst floods “represent an increasing climate-related hazard across the high mountain regions of Central Asia”.
“These events can trigger destructive floods and debris flows that affect downstream communities, infrastructure, and livelihoods,” she added.
The project utilises real-time data drawn from weather monitoring stations with community preparedness to shape a fast and effective response to life-threatening flooding. This includes training people on evacuation routes, safe locations and simulation drills. In addition, the project has tried preventative measures such as planting hundreds of trees in valleys prone to landslides to provide greater stabilisation.
In total, four early warning systems have been installed across the four countries involved in the project covering seven high-risk areas. As a result, UNESCO estimates these systems are protecting over 100,000 people.
“Early warning systems are a key risk reduction measure, allowing communities to evacuate in time and reduce potential loss of life and damage to assets,” added Aripkhanova.
Community participation
The active role of each community is built into these interventions. Ensuring local people are core contributors is seen as crucial to building long-term climate resilience.
These communities are witnessing the threats from climate change materialise on a yearly basis, and researchers are now tapping into that understanding when implementing adaptation projects.
After the 2022 floods, Pakistan’s development minister, Ahsan Iqbal, wrote that “there is an opportunity to do things differently” and that “enhancing Pakistan’s resilience to shocks and stresses amidst climate change, especially for the poorest…is essential for the country’s future.”
The climate shocks remain as strong as ever, but using the right tools and simple solutions can soften the blow when they occur.
Adam Wentworth is a freelancer writer based in Brighton, UK
The post Early warning systems are saving lives in Central Asia appeared first on Climate Home News.


-
Climate Change7 months ago
Guest post: Why China is still building new coal – and when it might stop
-
Greenhouse Gases7 months ago
Guest post: Why China is still building new coal – and when it might stop
-

 Greenhouse Gases2 years ago
嘉宾来稿:满足中国增长的用电需求 光伏加储能“比新建煤电更实惠”
-
Climate Change2 years ago
Bill Discounting Climate Change in Florida’s Energy Policy Awaits DeSantis’ Approval
-

 Climate Change2 years ago
嘉宾来稿:满足中国增长的用电需求 光伏加储能“比新建煤电更实惠”
-
Climate Change Videos2 years ago
The toxic gas flares fuelling Nigeria’s climate change – BBC News
-

 Carbon Footprint2 years ago
US SEC’s Climate Disclosure Rules Spur Renewed Interest in Carbon Credits
-

 Renewable Energy5 months ago
Sending Progressive Philanthropist George Soros to Prison?