
China has seen a series of temperature records broken this summer, as heatwaves have struck various regions across the country.
Between mid-March and mid-July 2025, it was hit by an unprecedented number of “hot days” – where temperatures reach or exceed 35C – according to the China Meteorological Administration (CMA) .
In both May and June, heatwaves swept across northern regions, with temperatures in Xinjiang reaching as high as 46.8C.
Such a record-breaking summer is becoming increasingly common, with the CMA’s annual Climate Bulletins showing that hundreds of local heat records have been surpassed over the past decade.
The CMA says that “extreme high temperatures” have shown an “increasing trend” in China since its records began in 1961.
Experts tell Carbon Brief that heatwaves strongly affect public health, agricultural output and economic activity.
They also put significant strain on the electricity system.
In this Q&A, Carbon Brief looks at how heat extremes are changing in China, the role of climate change in making these worse and how the country is adapting to the impacts.
How are heat extremes changing in China?
The latest science report from the Intergovernmental Panel on Climate Change (IPCC) states that it is “virtually certain” that “the frequency and intensity of hot extremes have increased” across the world since 1950.
The IPCC adds that it is “virtually certain” that human-caused greenhouse gas emissions are “the main driver”.
China is no exception. In a press release for its latest 2025 “blue book on climate change in China”, the CMA says China is “susceptible to the impacts of global climate change”, noting:
“[China’s] warming rate is higher than the global average…and extreme weather and climate events are becoming more frequent and intense.”
Data from the CMA’s Climate Bulletins show how the average annual temperature in China is rising and how 2024 was the hottest year on record, as shown in the chart below.
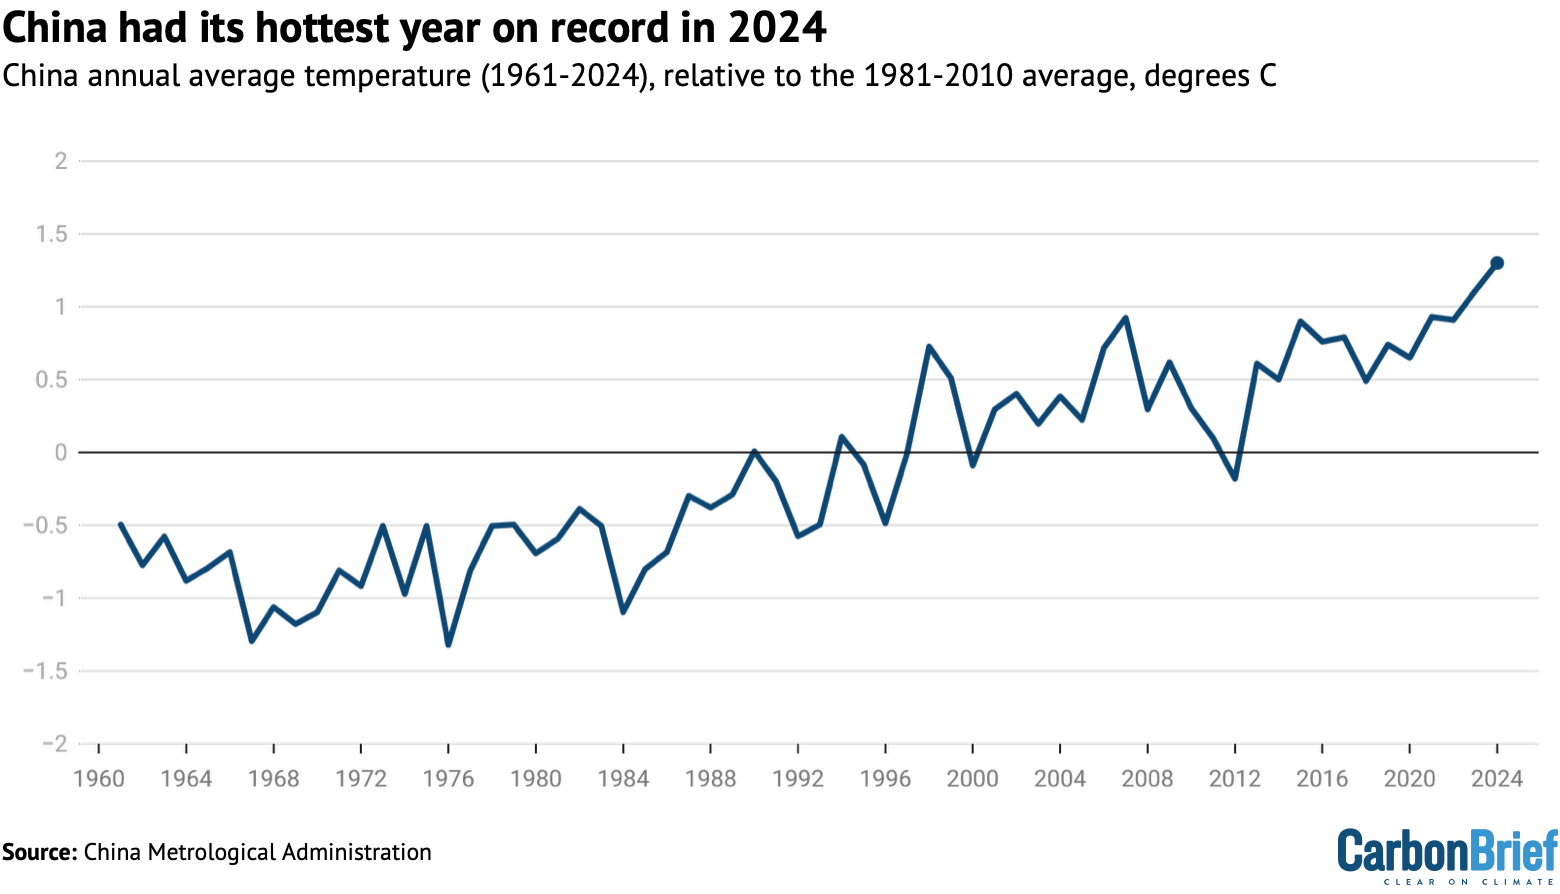
While 2024 was the hottest year on record overall, this was a result of consistently high temperatures throughout the seasons.
At a CMA press conference in 2025, Chan Xiao, deputy director of the CMA commented:
“Temperatures were consistently high throughout the year, with significant fluctuations in temperature during winter. Spring, summer and autumn temperatures were all record highs for the same period.”
In contrast, more heat records were broken during 2022, even though it was not quite as hot overall. Explaining this, Prof Yang Chen from Chinese Academy of Meteorological Sciences, which falls under the CMA, tells Carbon Brief:
“[For] the annual mean air temperatures, every day counts. So even if the 2022 was exceptional for its large number – actually also very long duration-consecutive days and high-magnitude – of hot extremes, mainly during summer and in the Yangtze River Valley, it does not mean the remaining days were hotter than the counterparts in 2024.”
The CMA defines a “hot day” or “high temperature day” as one that reaches or exceeds 35C. It adds that “high temperatures for several consecutive days constitute a heatwave”.
As the global climate has warmed, the number of “hot days” that China is experiencing has been on the rise, shown in the figure below.
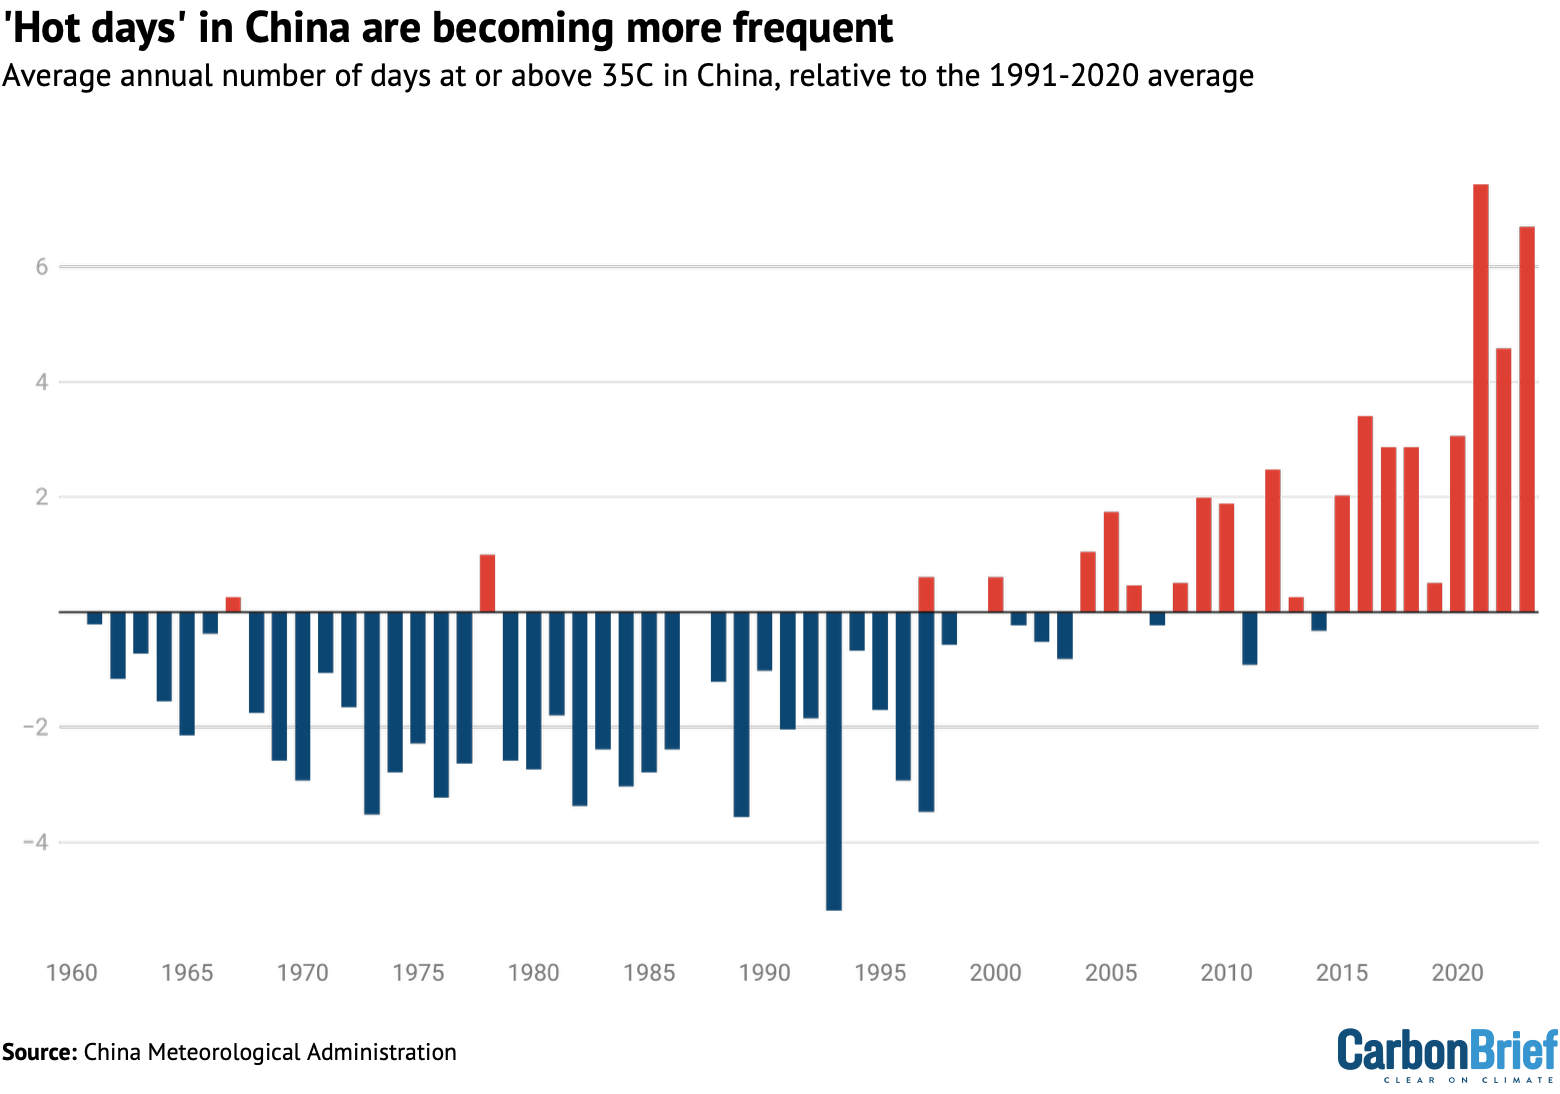
The year 2022 set a new record, with meteorological stations in China recording an average of 16.4 hot days. This was 7.3 more than the average for 1991-2020. The year 2024 came close to this record, with 15.6 hot days. These two years have also seen China’s hottest summers on record.
In 2022, more than 1,000 meteorological stations in China reported heatwaves, with 441 breaking “historical records”. For 2024, 74 stations reported “consecutive high temperature days” and 81 of them broke records.
Xiao said at a press conference in 2023 that “continuous high temperatures” in China’s central and eastern regions lasted for 79 days in the summer of 2022. The provinces of Gansu and Xinjiang in north-west China, Hubei in central China and Sichuan in south-west China all reported their “highest temperatures since 1961”.
In addition, the “maximum daily temperature [in the summer of 2022] at 361 national meteorological stations – accounting for 14.9% of the total number of stations in the country – reached or exceeded historical extremes”, Xiao added.
The CMA has also highlighted that summer is arriving earlier for much of China. In 2024, for example, summer in regions including most of Hainan province in south China, central Yunnan province in south-west China as well as central and southern Xinjiang province in north-west China arrived more than 20 days earlier than average.
“If a year’s spring and summer are longer, the potential heatwaves…will also be longer,” Prof Wenjia Cai, from the department of earth system science of Tsinghua University, tells Carbon Brief.
Cai notes that there are more ways to define heatwaves than CMA’s absolute threshold of 35C.
For example, a heatwave can also be defined by how long the hot weather persists, or based on “the daily maximum temperature, daily average temperature, or even nighttime temperature”, she tells Carbon Brief.
However, regardless of the definition used, the “number of heatwave days is definitely increasing as a result of climate change”, she adds.
What role does human-caused climate change play?
A field of climate science called “attribution” has emerged over the past two decades to establish the role that human-caused warming plays in individual extreme weather events, including heatwaves, floods, droughts and storms.
Attribution studies can also be used to find the “fingerprint” of human-caused climate change in longer-term trends, such as the gradual increase in surface temperatures over multiple decades.
Heat is the most-studied extreme event in attribution literature, as it is mainly driven by thermodynamic influences – in other words, it is relatively easy to study.
In contrast, storms and droughts are more strongly affected by complex atmospheric dynamics and, as such, can be trickier to simulate in a model. Cai tells Carbon Brief:
“High temperature is the most obvious trend against the background of climate change. Heatwaves, in comparison to events such as rainfall and typhoons, are also more predictable.”
Carbon Brief has produced an interactive map showing every attribution study published up to November 2024. In total, 114 extremes and trends in China have been the subject of an attribution study, including more than 20 relating specifically to extreme heat.
One study included on the map looks at the change in the intensity and frequency of extreme temperatures across China over 1951-2018. The authors say that, over this time period, “more intense and more frequent warm extremes” were observed across “most regions” in China – and that “greenhouse gas forcing plays a dominant role” in this.
Looking at individual extreme events, one analysis by the “rapid attribution” group World Weather Attribution investigates the then-record-breaking heat across China in July 2023. The analysis says that temperatures exceeded 50C in north-west China, adding that Sanbao, in Xinjiang, hit 52.2C on 16 July of that year.
The study finds that, in a world without climate change, such an extreme heat event would have been “extremely rare” and would only have happened once every 250 years. However, in today’s climate, as a result of human-caused climate change, a heatwave of this intensity is now expected once every five years.
This means China’s extreme heat of July 2023 was 50 times more likely due to climate change. The study also finds that in a world without climate change, the heatwave over China would have been 1C cooler.
A separate study finds that human-caused climate change also caused a more than 60-fold increase in the likelihood of the extremely warm 2013 summer, compared to the early 1950s.
It adds that other factors such as urbanisation and changes in atmospheric circulation patterns can also make heat extremes more intense and frequent.
What impact are these heatwaves having?
Heatwaves have a wide variety of impacts on human activities, such as public health, crop yields and economic output.
Older people are particularly vulnerable to extreme heat. The 2024 report from the Lancet Countdown on Health and Climate Change found that, in 2023, demographic changes alone could have driven a 65% increase in heat-related deaths among over-65s, compared to the 1990-99 average.
Cai, who is also the lead author of the Lancet Countdown’s China report, tells Carbon Brief that older people are the “most commonly mentioned vulnerable group” and that the number of people affected by heatwaves will grow as societies age.
However, heatwaves also “affect outdoor activities” regardless of age group, she adds, as well as having impacts on sleep and allergies:
“We don’t want anyone to think they are in a group of people unaffected by heatwaves.”
Cai says that heat exposure can increase the incidence of certain dangerous behaviours, such as domestic violence, as well as a wide range of diseases – including cardiovascular diseases and respiratory diseases – and mental health disorders.
In 2023, more than 30,000 deaths were related to heatwaves in China – 1.9 times higher than the average over 1986-2005, according to Cai and her colleagues’ China report.
This was a result of increased heat exposure – the average number of “heatwave exposure days” per person reached 16 days in 2023, more than three times the historical average (1986-2005), the report adds.
A 2022 attribution study on China notes that extreme heat can also increase the risk of preterm births. The authors find that over 2010-20, an average of 13,262 premature births were recorded in China due to heatwave exposure. The study linked one-quarter of these early births to climate change.
Another profound impact of heatwaves is that they can exacerbate droughts, with knock-on impacts for agriculture.
Reuters reported last June that “China’s agriculture ministry said…searing temperatures have adversely impacted summer planting and that fighting drought and protecting summer planting were arduous tasks”.
Droughts in 2024 hit more than 11 million people in China, with more than 1.2m hectares of affected crops and direct economic losses topping nearly 8.4bn yuan ($1.2bn), the Ministry of Emergency Management said in early 2025.
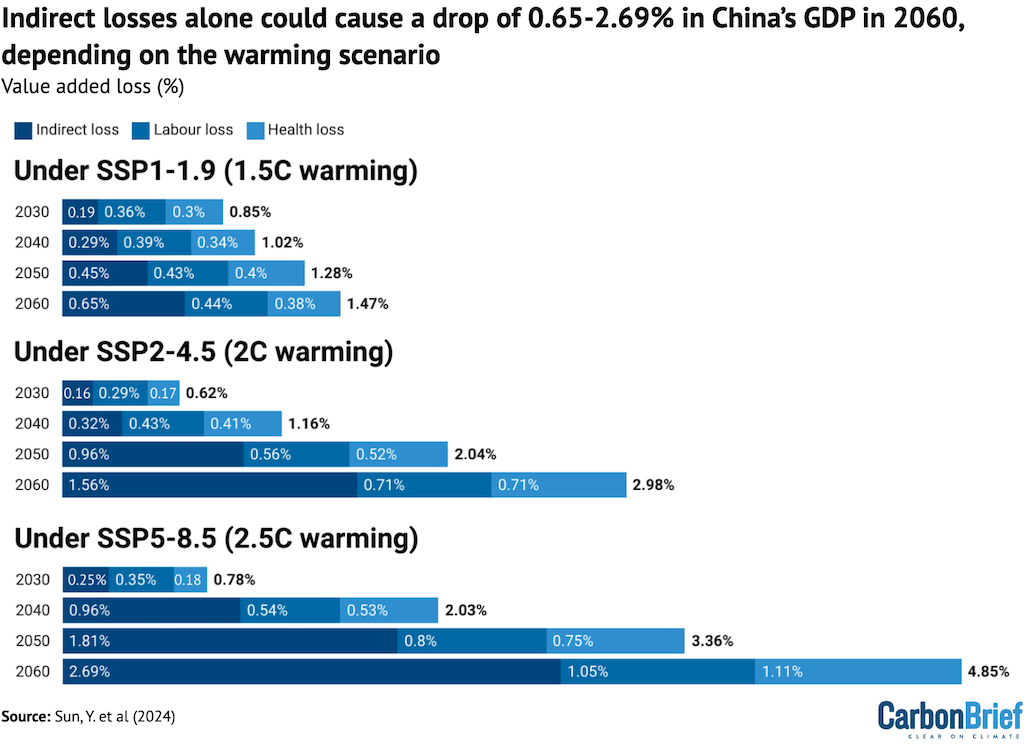
Heat-related economic losses could reach nearly 5% of China’s GDP by 2060, according to a recent guest post for Carbon Brief. Authors Prof Guan Dabo and doctoral student Sun Yida from Tsinghua University wrote:
“By 2060, China’s heat-induced economic losses could total about 1.5% of total GDP under 1.5C of global warming, 3% under 2C of warming and 4.9% under 2.5C of warming.”
Those predicted losses include “indirect economic losses”, which “could be due to changes in production, consumption or employment” in the global supply chain, including crop failures and labour slowdowns, they explained.
The figure below, based on their study, shows Chinese GDP losses under three different scenarios of future emissions, called “shared socioeconomic pathways” (SSPs).
The SSP1-1.9, SSP2-4.5 and SSP5-8.5 scenarios project average global temperature rises of around 1.5C, 2C and 2.5C by mid-century, respectively.
Economic losses are split into indirect losses (dark blue), labour losses (blue) and health losses (light blue).
Sectors such as the extractive industries, construction and non-metallic manufacturing “could see the highest losses” of about 4.6-6.4% of their “value-added” – the increase in worth of a product or service as it moves through different stages of production – largely because they are in Chinese “regions with significant warming”, according to Guan and Sun.
Those industries also have close business connections with south-east Asia, Africa and South America, which are “expected to face heightened exposure to production volatility caused by high temperatures”, they add.
The total economic loss globally could reach up to 4.6% by 2060, according to their study, and manufacturing-heavy countries such as China and the US, in particular, could be “strong[ly] hit”.
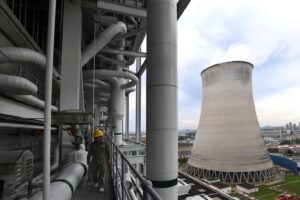
Other than manufacturing, electricity supplies in China have also been frequently reported to be affected by hot days.
Chinese news outlet China Business Network reports that China’s National Energy Administration said last year that summer was the hardest time to ensure sufficient electricity supply during a year and that extreme weather would make the supply even harder.
For 2025, China’s State Grid Corporation expected maximum electricity demand to exceed 1,200 gigawatts (GW), a new record.
Dr Muyi Yang, senior energy analyst at thinktank Ember, tells Carbon Brief that “when temperatures soar, electricity demand spikes – mainly due to air conditioning – and that can stretch the grid, especially in already tight systems”.
Biqing Yang, energy analyst at Ember, adds:
“In the third quarter of last year, for example, China’s residential electricity consumption rose significantly, by 17.8% year-on-year, largely due to elevated temperatures…It is clear that we are now entering an era [w]here climate change is having a real-time impact on our energy system.”
China’s electricity demand reached a new record in July 2025 after year-on-year growth of 8.6%, consuming more power in one month than Japan did in all of 2024, according to David Fishman, Shanghai-based principal at consultancy the Lantau Group.
The “staggering” July 2025 figures – including another 18% year-on-year rise in residential demand, partly due to rising household incomes, as well as air conditioning use – illustrates the impact of climate change on China’s power sector, Fishman writes on LinkedIn:
“We know it’s hot out and everyone knows every summer the intense heat seems to last for longer and longer. But these power consumption numbers are telling a story about China’s climate patterns like few other datasets can…and it’s a scary story.”
Yang, Chen and Cai tell Carbon Brief that it is important for China to adapt to the rising temperature and intensive heatwaves.
Chen specifically describes “successful” forecasts and early warnings as “critical” , saying that they are the “very first step toward adaptation”.
In his LinkedIn post, Fishman notes that the rapidly rising demand for electricity, including as a result of growing air conditioning use, also poses a “considerable challenge to China’s ability to meet rising demand solely with clean power sources”.
How is China adapting to heatwaves?
In recent years, China has implemented more and more policies aimed at adapting to heatwaves.
For example, weather forecasts and heatwave alerts have been provided.
Central and local governments have also issued labour policies aimed at protecting workers against extreme heat.
Under a policy from the Ministry of Human Resources and Social Security, for instance, outdoor works are not expected to be undertaken when temperatures exceed 40C. In addition, outdoor working hours should be shorter than six hours when the temperature is 37-40C.
Similarly, school students in some cities, such as Wuhan and Chengdu, have been advised to study from home during hot days in recent years.
Since 2021, the city of Tianjian has been sending text warnings of heatwaves to its residents, reminding people of the health risks it poses. The messages, according to Southern Metropolis Daily, warn that strokes might be triggered in the coming hot days and advises people to avoid outdoor activities and take medication if needed.
These text reminders have “significantly” reduced the number of hospitalised people in Tianjin, saving the city 140m yuan ($19.5m) since being introduced, adds the outlet.
In 2013, the central government published its first “national climate change adaptation strategy” – an attempt to implement the “clear requirement” of “enhancing our ability to adapt to climate change” included in the 12th “five-year plan” (2011-15).
In the latest version for 2035, heatwaves appear in sections related to the power sector, as well as agriculture and health.
The strategy aims to “improve” and “reinforce” nationwide “labour protection standards”, as well as “work system[s] that adapt to change and reduce agricultural disasters”. Its purpose is also to ensure the energy and electricity sectors’ abilities to “withstand extreme weather and climate events” in relation to heatwaves.
The strategy says that “health-risk assessment guidelines” and public health-related “implementation plans for adaptation under major extreme weather and climate events”, such as heat and heatwaves,in “various regions”, will be developed.
Last year, following the release of the latest overall adaptation strategy, China published the “national climate change health adaptation action plan (2024-30)”.
Cai calls the document a “very very important” blueprint for health risk management, bringing together a range of organisations, including hospitals, to form a “system related to climate change and health” that has “monitoring and early warning capabilities”.
She adds that this plan will also see heat-health alerts being issued nationwide:
“It is worth mentioning that the National Administration of Disease Control and Prevention and the China Meteorological Administration signed a joint agreement [in May 2025] on issuing [nationwide] health alerts – and that the first product is related to heatwaves.”
Ember’s Yang says that in terms of electricity, China is moving toward building a “‘new electricity system (新型电力系统)’ that is more compatible with high shares of renewables”. But, he adds, the old “planning psychology” needs to change so that it can better cope with extreme heat:
“Traditionally, the mindset has been very supply-driven – just keep adding enough generation and network capacity to meet demand…[With the new system] the demand side has to become an active player – a prosumer – that can actually support grid reliability.
“For example, during extreme heat, instead of just ramping up supply, we should also be encouraging users to reduce or shift their electricity use during peak hours, using price signals or incentives…This is the essence of what we call ‘coordinating generation, grid, load, and storage’ (源网荷储一体化) – a system that works together [and works] more efficiently and flexibly.”


The post Q&A: How China is adapting to ‘more frequent and intense’ heat extremes appeared first on Carbon Brief.
Q&A: How China is adapting to ‘more frequent and intense’ heat extremes
Farmers and fishermen in the Maldives have long relied on an ancient calendar to guide their daily lives.
The Nakaiy system divides the year into 27 distinct periods, each named after a star or constellation in the night sky.
Any one period in the calendar tells you about expected weather and tidal patterns, navigational routes, and fishing conditions. The Nakaiy was created through centuries of careful observation and local knowledge, passed down through families as an essential tool for survival.
But things are now changing. The climate crisis is leading to more extreme weather events across the Indian Ocean island nation and upending the Nakaiy calendar.
“When you go and speak to communities and ask them what kind of impacts they are facing, a lot of elders will tell you that the weather, it doesn’t follow the calendar anymore,” explained Aishath Reesha Suhail, a programme officer in the Maldives’ Ministry of Tourism and Environment.
As the effects of climate change worsen, it is a real prospect that the Nakaiy may be abandoned by local people, representing a major cultural loss to the Maldives.
‘Systemic and growing threat’
With extreme weather becoming the norm, communities are observing a domino effect of consequences in their everyday lives. The slow onset of heritage loss is now being seen across continents, but notably among small islands in remote parts of the ocean.
“Climate change represents a systemic and growing threat to cultural heritage worldwide,” a UNESCO spokesperson told Climate Home, adding that the World Heritage Committee has identified climate change as “one of the most significant long-term risks affecting properties across all regions.”
UNESCO, the UN body for education, science and culture, defines the loss of cultural heritage as “the erosion of traditional knowledge systems, craftsmanship, social practices and identity, particularly where communities are displaced or livelihoods disrupted”. A clear example is historical sites and even entire islands washed into the ocean as a result of rising sea levels and coastal erosion.
The Maldives is dealing with such a situation now. The Koagannu Cemetery is a 900-year-old resting place, located on the country’s southernmost atoll, a mere 50 metres from the shoreline. The monument’s intricate coral gravestones are being actively threatened by the encroaching Indian Ocean.
The government and local community have responded to this challenge with emergency protection measures. Sandbags and concrete structures have been installed along the coastline, complemented by large numbers of palm trees to create a seawall. A wider solution is ‘beach nourishment’, a common practice in the Maldives where sand from elsewhere is brought in to replace what has been lost through erosion. Taken together, these solutions have so far protected the cemetery.
Among the many issues climate change creates, cultural heritage is not always front of mind. In the Maldives, one of the main barriers people face is awareness. “Most of what we are dealing with relates to the erosion of our islands along with areas such as fisheries… but we are quite limited in our capacity to do something about it,“ Suhail said.
“We don’t understand the full breadth of the issue at present because we haven’t been able to do extensive research on the matter,” she added. However, assessing the extent of the damage – and how to respond effectively – is a key priority for the government, outlined in its latest climate plan, known as a Nationally Determined Contribution, and as part of its National Adaptation Plan process.
Fishing is at the core of the country’s culture and identity, employing thousands of people. Most dishes include fish – “we have it for breakfast, lunch and dinner,” Suhail noted – but the climate crisis and overfishing are shifting how and when communities can fish. Tuna makes up 98% of all fish caught in the Maldives, but warmer ocean temperatures are changing migratory patterns, pushing the species into deeper, colder waters.
As a critical economic and cultural resource, the government has outlined a range of solutions to protect the fisheries sector in its first Biennial Transparency Report to the UN. These include using real-time tracking data to improve the efficiency of fishing operations; investing in canneries to increase fish storage; and diversifying away from tuna through marine farming.

Culture and nature go hand-in-hand
The same pattern is playing out elsewhere.
Palau and the Maldives are not close to one another. The two states are separated by around 4,000 miles and sit in different corners of the ocean. But both are experiencing very similar climate challenges, based on their position as a set of scattered, low-lying islands surrounded by an imposing body of blue water.
In the same way as the Maldives, Palau’s cultural heritage is closely tied to “land, coastlines and traditional food systems,” according to Toni Soalabla, at the Palau Office of Climate Change.
“Many of the places that hold stories, history and identity of our communities are located along the coast and are increasingly exposed to erosion and sea level rise,” she said.
One of these places is Ngerutechei village, reportedly the oldest in Palau, and home to ancient stone paths and carvings. The village provides a glimpse into the past social values and culture of the people in this western Pacific nation.
As part of the development of Palau’s National Adaptation Plan, the government has worked with local leaders to identify similar sites of cultural significance. The plan encourages communities to use their own knowledge to create protective measures for these sites.
Climate change is also prompting communities to take up traditional land and food practices again. These include cultivating taro, a stable food source that has historically supported water, soil and food security on the islands.
“These systems developed over generations in response to local environmental conditions, so strengthening them today is both a climate adaptation measure and a way of maintaining cultural knowledge that might otherwise fade,” said Soalabla.
Cultural practices in Palau have developed alongside the natural ecosystems that people rely on to survive. It is within this context that researchers believe adaptation policies should be created. Recognising this relationship “can strengthen both community identity and environmental resilience at the same time”, according to Soalabla.


Heritage on the global stage
The issue of cultural loss has not gone unnoticed in international climate negotiations.
Small island states such as the Maldives have used their role at the UN to push for greater awareness and action, with some key successes.
In 2015, the Paris Agreement established a Global Goal on Adaptation (GGA) which recognised that countries needed to do something about climate change now and not later. However, it took six years before a framework and a set of adaptation targets were agreed at the UN climate summit in Glasgow to pursue this goal.
From this came the establishment of seven overall themes – from poverty eradication to access to health – to guide adaptation action and a set of around 60 indicators to measure progress against the targets.
World leaders invited to see Pacific climate destruction before COP31
Emilie Beauchamp, an adaptation specialist at the International Institute for Sustainable Development (IISD), said that “cultural heritage was highlighted as one of the global priorities [of the GGA Framework] and is one of the seven themes, so it is considered very important by the international community.”
The much-debated set of indicators, only finalised in Belém at last year’s COP30, include five related to cultural heritage with a focus on preserving cultural practices and important sites that are “guided by traditional knowledge, Indigenous Peoples’ knowledge and local knowledge systems”. A spokesperson for UNESCO said the inclusion of heritage indicators “marks an important recognition that climate impacts extend beyond economic losses”.
While critics said the set of final indicators was rushed through by the Brazilian presidency, they now serve as guidance for national governments that wish to implement plans to protect their common heritage. The missing piece of the puzzle remains how to finance these plans – something notably absent from the Belém text, which made clear that the adaptation indicators “do not create new financial obligations or commitments, nor liability or compensation”.
The lack of financial commitments proved disappointing for many small states grappling with how to prevent their cultural history from being entirely forgotten, especially at a time when adaptation finance remains below requirements. A recent UNEP report found that developing nations would need an estimated US$310 billion per year in 2035 to adapt to climate change, while current public financing was around $26 billion.
At these low levels “only a small percentage of what the framework outlines could be implemented,” according to Beauchamp.

The challenge of cultural heritage
When looking at low-lying islands on a map, they can appear as specks of land amid a vast ocean. Many of the stories from these remote places go unnoticed. But the specks represent millennia of human culture that is slowly being lost to the ocean.
While the international community has now recognised the problem and solutions exist, the recurring issue of scarce finance may prevent governments from taking sustained action. Island communities have already been forced to move home as sea levels rise, leaving behind their cultural connections to a place.
The value of any cultural asset, or of human heritage, can be judged by how it is engaged with over generations. Without human intervention, many historical sites, language, cuisine and other local customs would become a forgotten part of history. The rapid onset of climate change brings the role of cultural heritage into sharp relief, challenging communities to decide in real time what they value, what deserves saving, and how to achieve that.
Stories of cultural loss are not confined to small islands but it is here where the challenge is presenting most acutely. The experiences of these vulnerable nations in protecting their heritage will provide the litmus test for effective adaptation responses elsewhere.
Adam Wentworth is a freelance writer based in Brighton, UK.
(Main image: The Isdhoo Havitha is an ancient Buddhist monastery in the Maldives, located moments from the shoreline. Photo: Ashwa Faheem)
The post Island nations fight to save cultural heritage from climate change appeared first on Climate Home News.
Island nations fight to save cultural heritage from climate change
The invasive emerald ash borer, native to northeast Asia, has spread to 37 states over the past quarter century, killing nearly all of the ash trees it infests. But in Maine, a coalition of basketmakers, scientists and government officials are plotting a future for their trees.
Each strip of wood in Richard Silliboy’s hands started as a year of an ash tree’s life.
Climate Change
Toxic Ocean Crisis in Papua New Guinea Sparks Mass Marine Die-Off and Public Health Emergency
Thousands of dead fish are washing ashore and people are falling ill too, as officials investigate possible sources of contamination.
It started in December, when dead fish began washing ashore New Ireland—a mountainous island in Papua New Guinea’s New Ireland Province, flanked by the Pacific Ocean and the Bismarck Sea.
Toxic Ocean Crisis in Papua New Guinea Sparks Mass Marine Die-Off and Public Health Emergency


-
Greenhouse Gases8 months ago
Guest post: Why China is still building new coal – and when it might stop
-
Climate Change8 months ago
Guest post: Why China is still building new coal – and when it might stop
-

 Greenhouse Gases2 years ago
嘉宾来稿:满足中国增长的用电需求 光伏加储能“比新建煤电更实惠”
-
Climate Change2 years ago
Bill Discounting Climate Change in Florida’s Energy Policy Awaits DeSantis’ Approval
-

 Climate Change2 years ago
嘉宾来稿:满足中国增长的用电需求 光伏加储能“比新建煤电更实惠”
-
Climate Change Videos2 years ago
The toxic gas flares fuelling Nigeria’s climate change – BBC News
-

 Renewable Energy5 months ago
Sending Progressive Philanthropist George Soros to Prison?
-

 Carbon Footprint2 years ago
US SEC’s Climate Disclosure Rules Spur Renewed Interest in Carbon Credits