

The challenge of providing around one billion Africans with cleaner and healthier ways of cooking got a major funding boost this week, as governments and companies put $2.2 billion on the table at a summit in Paris to help solve the long-neglected problem.
But the money pledged still falls short of the $4 billion a year needed for the rest of this decade to wean poor African households off traditional dirty fuels including charcoal, kerosene and firewood, while climate campaigners criticised efforts to switch them to fossil gas.
Countries such as Brazil, Indonesia and India have made progress in recent years, in line with a global goal to provide clean cooking for all by 2030. Yet four in five Africans still use highly polluting cooking methods – around half of the 2.3 billion people who lack clean options worldwide, according to the International Energy Agency (IEA).
IEA Executive Director Fatih Birol told the summit his organisation’s aim of making 2024 “a turning point” for clean cooking was being realised.
“It’s now or never,” he said, adding that the IEA will track the commitments made in Paris and share the results with the international community in a year’s time. “We will follow it as if it is our own money,” he emphasised.
In Nagorno-Karabakh, Azerbaijan’s net zero vision clashes with legacy of war
Separately, the African Development Bank (AfDB) confirmed an earlier pledge, first made at the COP28 climate summit last year, to mobilise around $2 billion for clean cooking over the next 10 years, earmarking 20 percent of its energy finance for that purpose.
Speaking in Paris, AfDB president, Akinwumi A. Adesina, said his own eyesight had been damaged by smoke from cooking fires during his childhood in Nigeria, while a friend and members of her family had died in an accident after she was sold petrol instead of kerosene as cooking fuel.
“Why do we let things like that happen?” Adesina asked, adding that enabling clean cooking is a matter of “human dignity, fairness and justice for women”. “It is about life itself,” he said.
Experts have long pointed to the health damage to women and children from carbon monoxide and black soot emitted by cooking over open fires or with basic stoves. Dirty cooking contributes to 3.7 million premature deaths annually, according to the IEA, with women and children most at risk from respiratory and cardiovascular ailments linked to indoor air pollution.
Ahead of the Summit on Clean Cooking in Africa this week in Paris, some climate and gender activists pointed to the small number of African women represented at the gathering – who they said accounted for less than a fifth of registered participants.
Janet Milongo, coordinator of renewable energy for Climate Action Network International, said the event was biased “towards the continuation of the colonial, patriarchal representation of the continent”.
Speeches were made largely by male leaders of governments and companies, with the notable exception of Tanzania’s president, Samia Suluhu Hassan, and Damilola Ogunbiyi, the UN Secretary-General’s Special Representative for Sustainable Energy for All.

Fatih Birol, Executive Director of the International Energy Agency (left) with the presidents of Sierra Leone, Tanzania and Togo, the prime minister of Norway; H.E. Maroš Šefčovič, Executive Vice President of the European Green Deal and Akinwumi A. Adesina, President of the African Development Bank Group at the Clean Cooking Summit for Africa in Paris, May 14, 2024 (Photo: International Energy Agency)
Clean cooking ‘opportunity’ in NDCs
Ogunbiyi, who is Nigerian and has worked on clean energy policy for the government, said her country had made a big effort on solar electrification but had forgotten about clean cooking.
“We can’t make that mistake again,” she said, calling for clean cooking to be a key part of African governments’ investment plans for their energy transition.
UN climate chief Simon Stiell urged more governments to seize the opportunity to include measures to boost clean cooking in the next updates to their national climate action plans (NDCs) due by early next year.
As of December last year, only 60 NDCs included one or more measures that explicitly target clean cooking, such as Nepal’s goal to ensure that by 2030 half of households use electric stoves as their main mode of cooking and Rwanda promising to disseminate modern efficient cookstoves to 80% of its rural population and 50% of people in cities by that date.
Stiell noted that planet-heating emissions from dirty cooking methods are “significant”, amounting to about 2% of the global total – the equivalent of emissions from the aviation and shipping sectors combined.
UN agrees carbon market safeguards to tackle green land grabs
He said the world has the technology to shift people onto modern, cleaner sources of energy and cut emissions in the process, calling it “low-hanging fruit”.
Dymphna van der Lans, CEO of the Clean Cooking Alliance, a global partnership of organisations working on the issue, said it was important to raise awareness not just about the scale of the problem – but to ensure people understand it is an issue that can be solved.
“The technologies exist – they are out there, there are fantastic companies providing these fuels and solutions and services to these customers that actually can be deployed immediately… and reach the populations in Africa,” she told Climate Home after the summit.
LPG conundrum
On stage in Paris, companies ranging from fossil fuel giants such as Total and Shell to smaller manufacturers of cookstoves said they would expand their efforts to reach new customers with more efficient stoves running on modern energy, including liquefied petroleum gas (LPG), bioethanol and electricity.
While there is widespread consensus over ending the use of firewood and charcoal – which contribute to deforestation – there is less agreement over which fuels should replace them.
Efforts to build new distribution networks for LPG – a form of fossil fuel gas – are particularly controversial. At the summit on Tuesday, TotalEnergies CEO Patrick Pouyanné said his company wants to increase its 40 million African LPG customers to 100 million and will invest more to boost its LPG production capacity in East Africa.
Pouyanné said there is a need to make LPG cooking affordable – noting that the $30 upfront investment required for a stove and gas canister is too high for most people – which could be done through “pay as you cook” loans.
Some international development agencies that work on the ground to help poor households access clean cooking – including Practical Action – support the use of LPG as a “transitional step” towards clean cooking where options like electricity or ethanol are not available.
“Our primary objective is to ensure people, especially women and children, have access to the best possible solutions which don’t compromise their health and that in the long term aren’t contributing to the worsening climate crisis,” said Practical Action CEO Sarah Roberts.
In the IEA’s “least-cost, realistic scenario” to reach universal clean cooking this decade, LPG remains the primary solution, representing nearly half of households gaining access, while electric cooking is the main option for just one in eight homes.
Days after climate talks, US slaps tariffs on Chinese EVs and solar panels
The IEA’s analysis shows that this strategy, centred on LPG, would drive up emissions by 0.1 gigatonnes (Gt) in 2030. But that would be more than offset by reductions in greenhouse gas emissions from switching away from firewood, charcoal and inefficient stoves, resulting in a net reduction of 1.5Gt of CO2 equivalent by 2030.
Net greenhouse gas emissions annual savings from clean cooking access in the IEA Access for All scenario by 2030 (in Mt CO2-eq) (Source: IEA)

Red = Combustion; Orange = Avoided combustion; Yellow = Unsustainable harvesting; Green = Net savings
At the summit, Togo’s president Faure Gnassingbé described LPG as “really the way forward” for clean cooking, and said more production capacity was needed in Africa. He added that ESG investors – which normally apply green and ethical standards – should adjust their environmental criteria so they can back LPG cooking projects despite it being a fossil fuel.
“We should be clear-headed and not open up to sterile debates on this issue,” Gnassingbé told the summit.
Some climate justice activists disagreed, criticising high-level backing for fossil gas as a clean cooking solution.
Mohamed Adow, director of Power Shift Africa, a Nairobi-based energy and climate think-tank, said on social media platform X that the need for clean cooking alternatives “is used by many African politicians as an excuse for building gas infrastructure” which is intended to develop an export industry and never reaches poorer households.
Here’s my response to yesterday’s summit on Clean Cooking in Africa & the declaration issued by #IEA.
“This declaration is a lazy & misguided statement which seems to rely on the private sector to use gas as a solution to this problem.
However, there’s no evidence that will…
— Mohamed Adow (@mohadow) May 15, 2024
He said the money raised at the summit should be channelled instead into high-efficiency, low-cost electric cookers for African women, which could be powered by renewable energy.
Carbon finance principles
Another controversial way of promoting clean cooking, backed by the IEA-hosted summit, is by developing and selling carbon credits for the emissions savings from new technologies and fuels.
The IEA said that around 15% of the total amount pledged in Paris would come via carbon finance, with the proceeds from selling offsets helping subsidise customers’ access to clean cooking.
But Climate Home found in an investigation last year that the methodologies used to calculate emissions reductions from more efficient cookstoves in India had overstated their greenhouse gas savings.
To counter such problems, the Clean Cooking Alliance announced a new set of “Principles for Responsible Carbon Finance in Clean Cooking” in Paris, backed by 100 organisations working in the space.
Road row in protected forest exposes Kenya’s climate conundrum
The voluntary principles, which aim to build confidence in carbon markets for clean cooking, say project claims should be evidence-based, case-specific and substantiated, and their benefits should be transparent. The alliance is also working with the UN climate secretariat on a new methodology for clean cooking carbon credits which it hopes will be ready this year.
Van der Lans said the goal was to strengthen the quality and integrity of clean-cooking carbon credits in line with the latest science, to achieve a higher, fairer price that fully reflects the work being done to protect forests by moving away from charcoal and firewood.
“Everybody within the clean cooking ecosystem is signing up to these principles,” she noted – from banks to carbon credit verification agencies and companies selling the technology.
“That is a good signal that we’re doing the right things and we’re moving this market in the right direction,” she added.
(Reporting by Megan Rowling; editing by Joe Lo)
The post Paris summit unlocks cash for clean cooking in Africa, side-stepping concerns over gas appeared first on Climate Home News.
Paris summit unlocks cash for clean cooking in Africa, side-stepping concerns over gas

Climate Change
Large flotilla brings Pacific voices and message to leaders at Pre-COP meeting: Keep 1.5C Alive
NADI, FIJI Wednesday 7 October 2026 — Around 80 people including Pacific and Torres Strait community members, Elders and youth activists travelled as part of a colourful flotilla past the Pre-COP venues with a message for leaders: ‘Keep 1.5°C Alive’.
High res footage and images available here
The large flotilla included traditional Fijian voyaging vessel the Uto Ni Yalo, six 6-person outrigger canoes, and Greenpeace campaigning vessel the Oceania which sailed from Sydney to the Pre-COP in Nadi. On board were Elders, climate-vulnerable communities members from across the Pacific and Torres Strait, youth activists and poets, and campaigners and climate experts from across the region.
Messaging on canoes and banners said ‘Hold the Line at 1.5°C’ and ‘Keep 1.5°C Alive’ — a reminder to leaders that the climate limit established under the Paris Agreement is a non-negotiable survival line.
Shiva Gounden, Head of Pacific at Greenpeace Australia Pacific, said: “People from across the Pacific and Australia have come together today to make sure the voices of our communities are heard by leaders meeting here in Nadi for the Pre-COP climate talks. The Taku Pakasoa Declaration adopted here at Pre-COP means ‘Strength in Unity’, and that’s how we’re coming together today.
“Our message is clear: Hold the Line on 1.5°C and centre those most impacted by the climate crisis in your decision-making. Our children’s futures must not be stolen away so that polluting nations can continue down the fossil-fuel path.
“Limiting global heating to 1.5°C is a non-negotiable survival line for Pacific communities and for humanity. Every cyclone, every storm now blows with the deadly force of accumulated emissions and gives a warning of what is to come as we face a dangerous summer of climate-fuelled extreme weather. Do not ignore our voices.”
On board, Aigagalefili Fepulea’i-Tapua’i, Pacific youth climate advocate and poet from Aotearoa Climate Action Network, said: “To hold the line on 1.5C for our Pacific family, New Zealand, as the only country where the connection between environmental protection and indigenous rights is legally validated by our constitutional document, must protect the rights of Māori.”
ENDS
Media contact: Kate O’Callaghan in Nadi on +61 406 231 892 (Whatsapp/Signal)
Large flotilla brings Pacific voices and message to leaders at Pre-COP meeting: Keep 1.5C Alive
Climate Change
A ‘victory’ for communities as High Court rules climate impacts from coal and gas must be considered even where fossil fuels are exported
SYDNEY, Wednesday 7 October 2026 — In response to the landmark High Court ruling that climate impacts of fossil fuel projects must be considered by NSW planning authorities, the following lines can be attributed to Joe Rafalowicz, Head of Climate and Energy at Greenpeace Australia Pacific
“The High Court decision today is a victory for communities that bear the brunt of the storms, bushfires and extreme weather fuelled by Australian fossil fuel corporations.
“Coal and gas companies have claimed they are not responsible for their pollution because it happens overseas, but today Australia’s highest court sided with common sense and scientific evidence to find that every new coal and gas approval in this country could put us at risk, no matter where it is sold or burnt.
“As leaders meet at the Pre-COP talks in Fiji this week, Pacific communities are reaffirming the importance of the 1.5C temperature limit as a survival line for humanity, and is a scientific, moral and legal obligation as affirmed by the landmark Pacific-led ICJ Advisory Opinion. The highest court in the world, and now in Australia, have been clear: it is legally imperative that all of the pollution from fossil fuel projects be considered before approving a new project.
“Now is the moment for the Australian Government, as COP31 President of Negotiations, to find the courage, leadership and grit our country is known for to chart a new course away from fossil fuels. This begins with showing leadership at home by ending new coal and gas approvals.”
-ENDS-
After witnessing the effects of sea-level rise in the low-lying island nation of Tuvalu, Pacific leaders on Tuesday used the pre-COP31 summit in Fiji to voice their frustration at the difficulties they have experienced in tapping the global climate finance system.
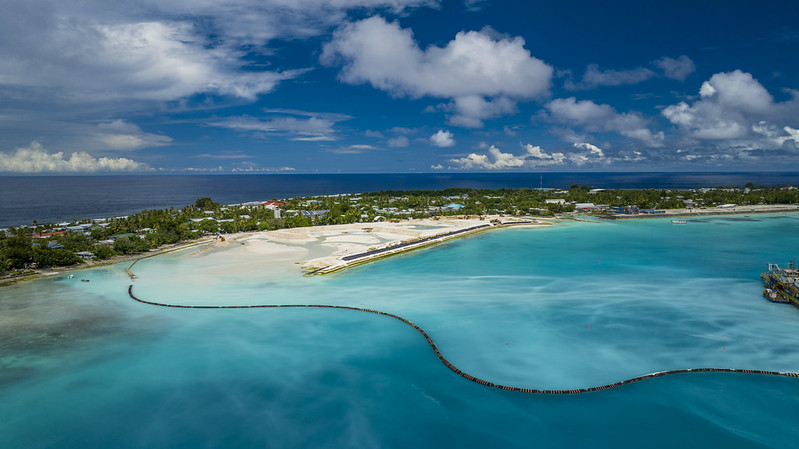
A small group of government leaders, climate negotiators and heads of development banks and climate funds took a trip to Tuvalu’s Funafuti atoll on Tuesday morning, travelling by road over land just 10-20 metres wide to visit a project that is building barriers to keep the sea from the land.
They then flew to Fiji for the pre-COP summit, where several Pacific leaders said they had been let down by the insufficient quantity, bad terms and slow speed of international finance to help them adapt to a warming climate that is bringing higher oceans, drought and more powerful storms to their shores.
“Right now, our islands are like a canoe that has been rammed by a massive foreign ship. Our canoe is taking on water, we are sinking, and what is the world’s response?” asked Palau’s President Surangel Whipps Jr.
“They hand us a tiny patch to cover a gaping hole,” he continued, “but the bureaucratic process just to receive that patch is so slow that the water fills the hole while we wait. Then to rebuild the vessel so that we can survive the next storm, we are offered loans, debt that adds weight to a sinking boat packaged in red tape so thick we can barely access it. And while we wait, the water continues to fill.”

Pacific leaders and Australia called again on governments to invest in the new Pacific Resilience Facility (PRF), which has been designed by the Pacific Islands Forum and is seeking $500 million in investments by COP31 in November.
It has around $180 million so far, but did not receive additional pledges during the UN General Assembly in New York. The PRF aims to invest to generate annual returns which it can give to projects like water tanks for drought-hit communities.
Witnessing sea level rise
The annual pre-COP gathering is usually a low-profile technical meeting of climate negotiators. But this year, Australia – which is the president of negotiations at COP31 – partnered with the Pacific to introduce a “leaders segment” in an attempt to shine a spotlight on climate issues affecting the region.
Fourteen government leaders – from Australia, Timor-Leste, Mauritius and the Pacific – made the trip. They were joined by the European Union’s climate commissioner Wopke Hoekstra, the heads of the Green Climate Fund and the Asian Development Bank and former Australian prime minister Julia Gillard.
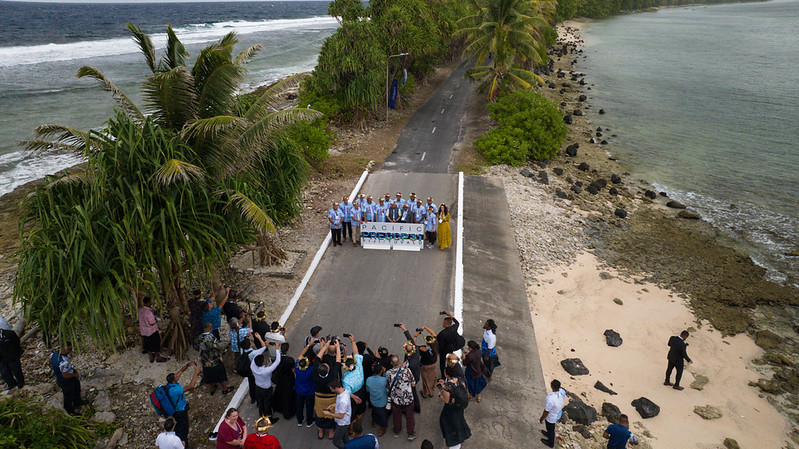
On their return to Fiji, Solomon Islands Prime Minister Matthew Wale told the pre-COP leaders roundtable that the sea level rise they had witnessed was personal for him.
“Tuvalu was not just a site visit for me. I saw the story of my own saltwater people,” he said, adding that he, his daughter and his grandfather had lost their houses to sea level rise and that three-quarters of his electorate live on land that will be underwater in the next 30 years.
From the other side of the world, Antigua and Barbuda’s environment minister Michael Joseph said Tuvalu’s problems felt similar to those of his own Caribbean islands. “I saw vulnerable communities… just metres from the sea and people determined to remain on their land, preserve their culture and way of life,” he said.
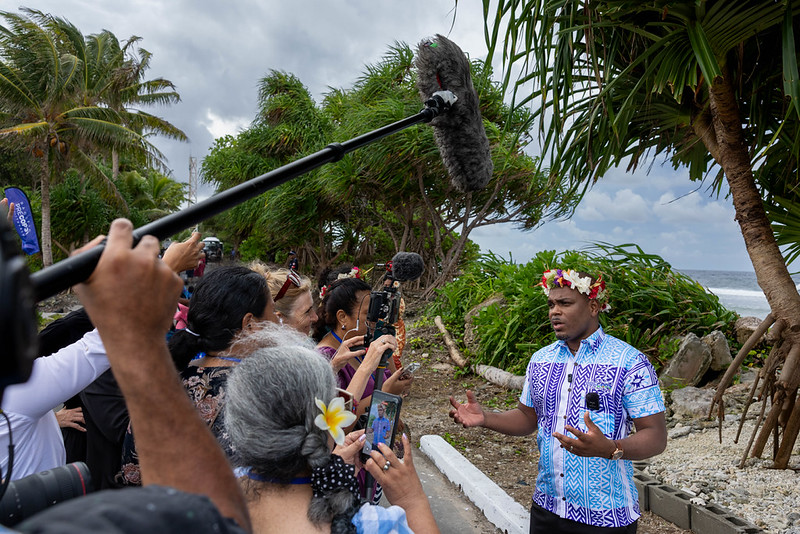
A group of Fijian schoolchildren told the leaders it was not just sea level rise the Pacific struggles with but also heatwaves, droughts and storms, which worry their families and prevent them from learning.
Climate finance red-tape
Several Pacific leaders criticised the world’s leaders for not doing enough to combat climate change. Cook Islands Prime Minister Mark Brown expressed disappointment that only two non-Pacific leaders had come to the pre-COP, a fact Australian media widely picked up on to label the event a flop and question its A$20 million (US$14m) price tag.
“We’ve heard a lot of numbers these last two days,” Brown said. “Let me share one of my own. More than 50 invitations extended to world leaders… to see for themselves what high emissions are doing to our nations and our ocean – an ocean that covers nearly one-third of the Earth’s surface.”
-
Pacific islands seek backing for new regional fund ahead of COP31
Pacific leaders will appeal for pledges to a new regional fund designed to swiftly channel climate finance to local communities -
The Pacific made history in the courts – now we must do it in the negotiations
Legal clarity alone will not lead to reduced emissions, more finance or stronger national climate plans – political will is key to meeting states’ obligations -
Civil servants warn fossil fuel exploration could harm New Zealand’s climate reputation
Advice to politicians says revoking a ban on oil and gas drilling could damage relations with Pacific neighbours and risk lawsuits
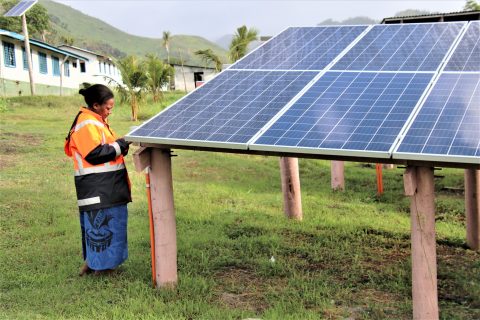


He called for more climate finance for the Pacific, asking “if the world is prepared to assess our suitability for climate finance, why is it not equally prepared to scrutinise whether those responsible for delivering it are meeting their obligations?”
Like Palau’s president Whipps, Naoero’s President David Adeang criticised the red tape that is hindering access to climate finance as well as a lack of money, complaining especially about “complicated procedures, heavy reporting, delays in approval and disbursement”.
Adeang added that “the way we assess vulnerability matters”, adding that it should be measured by more than income. Naoero, for example, is classified by the World Bank as high-income, restricting which climate finance it is eligible for.
Action plan to improve access
On Thursday, the Australian government will present a statement and action plan on improving access to climate finance for small island developing states and least developed countries, which it is asking other countries and organisations to endorse.
The statement addresses some of these Pacific complaints as well as acknowledging that progress has already been made on simplifying access by multilateral development banks and climate funds.
In Fiji, Asian Development Bank head Masato Kanda said his institution is “tailoring our finance and operations to island realities” because “your children and their children should be able to grow old in the countries their ancestors have called home for millennia”.
The executive director of the Green Climate Fund (GCF), Mafalda Duarte, said that the GCF-backed coastal adaptation project leaders visited in Tuvalu shows that “climate finance works” although – as the project took eight years to implement – “it takes time, and therefore we have no time to waste”.
Australia calls for optimism
While Pacific leaders expressed concern that the world is set to blast past its agreed 1.5C warming limit, endangering their nations, Australia’s Prime Minister Anthony Albanese called for “optimism”. “If people think there is no hope, then they will not strive to get the change that we need,” he said.
He said that when he attended his first COP in 2005, Australia’s renewable energy target was 2%. Its target is now 82% renewable electricity by 2030.
While Albanese promoted Australia’s success at electrifying homes and businesses and rolling out renewables, he has been criticised by climate campaigners for extending the production of fossil fuels, including coal – largely for export.
France’s Minister for Ecological Transition Monique Barbut defended the European Union’s climate action at the pre-COP meeting. She said the continent was heating up and reducing emissions faster and providing more climate finance than anywhere else in the world.
“It is time for all major emitters to step up and do their fair share” on climate finance, she said. Most developing countries with large emissions have fiercely resisted joining the club of climate finance donors, arguing they have played a disproportionately small historic role in causing climate change.
Barbut, as well as Palau’s president Whipps, called for the next flagship scientific assessment report of the Intergovernmental Panel on Climate Change (IPCC) to be finished by COP33 in 2028, in time to inform the next global stocktake of national climate action.
This timeline has been opposed by countries like India, Saudi Arabia and China, who argue it would put an unfair burden on developing countries. Barbut said countries should “support the work of the IPCC rather than sabotage its calendar”.
Barbut said that governments should agree at COP31 to aim to raise the share of “clean electricity” in final energy consumption to 35% by 2035. The Turkish and Australian governments have pushed for this goal although without specifying that the electricity should be “clean”. Barbut added that COP31 should also agree to cut emissions of methane, a particularly potent greenhouse gas.
The post Pacific leaders rail at climate finance failures after pre-COP trip to Tuvalu appeared first on Climate Home News.