

SYDNEY – Thursday 16 May 2024 – Greenpeace Australia Pacific has today welcomed news that the Federal Government must now drop its sneaky means to fast-track approvals for new gas projects, but warned the Government must still rule out further climate-wrecking gas projects, like Woodside’s Burrup Hub.
“After a series of horrifying commitments to new gas from the Government this week, we’re glad to see that some sense has prevailed,” Greenpeace Australia Pacific Head of Climate and Energy Joe Rafalowicz said today.
“Along with our allies in the climate movement, Greenpeace had been extremely concerned to see Resources Minister Madeleine King use sneaky means to fast-track approvals for new gas projects while trying to sidestep environmental protections under the EPBC Act, which she buried in a Bill largely about worker safety.
“Sadly, the fight against toxic, polluting gas isn’t over – in fact, it’s only just begun.
“Madeleine King and the gas lobby don’t just want to ignore the laws that protect our environment – they want a blank cheque to drill for dirty, climate-wrecking gas.
“Just this week we saw Australian and Pacific communities betrayed by the release of the so-called ‘Future Gas Strategy’ – a document that might as well have been written by the fossil fuel lobby, handcuffing our country to decades more climate-wrecking gas amid a climate crisis.
“The gas industry has been pushing the Labor government to weaken Australia’s environmental protections because it has a suite of new projects in the pipeline that pose a major threat to our oceans and climate.
“To secure a safe climate future for Australian and Pacific communities, laying the groundwork for more new gas during a climate crisis is the last thing we need.
“The biggest and most dangerous gas project on the books is Woodside’s Burrup Hub, which would require drilling up to 50 wells around Scott Reef, Australia’s largest oceanic reef system and a vital habitat for pygmy blue whales and green turtles.
“Minister Plibersek is expected to decide whether to give Woodside the green light to drill at Scott Reef this year.
“These are the moments that count – where Labor writes its legacy on environmental protection and climate action into the history books.
“Now more than ever, we need Labor to step up and say no to Woodside’s climate-wrecking, nature-destroying Burrup Hub.”
For more information or to arrange an interview please contact Lisa Wills on 0456 206 021.



Greenland has now marked the 30th consecutive year where it lost more ice than it gained.
This guest post is by:
Dr Martin Stendel, climate scientist at the Danish Meteorological Institute (DMI), part of the Polar Portal
Prof Ruth Mottram, climate scientist at DMI and honorary professor at Aarhus University
Over the 12-month period to August 2026, the world’s second-largest ice sheet lost around 135bn tonnes of ice.
This major ice loss came as the region experienced a relatively cool start to summer and less surface melt than in previous years.
In other words, it was not an “extreme” year for weather in Greenland – and, yet, the ice sheet ended firmly in the red.
Three decades of continuous ice loss in Greenland is significant, given that scientists typically need 30 years of data to separate the “fingerprint” of human-caused climate change from natural variations in the climate.
In Greenland, the direction of travel has been the same – downward – every single year for 30 years.
These latest figures come as a new report highlights that ice melting processes seen for decades in Greenland are increasingly being replicated in Antarctica.
Greenland, therefore, is not only the largest present-day source of ice-driven sea level rise – but offers a preview of what is in store for the world’s largest ice sheet.
(For our previous analyses of Greenland’s ice cover, see coverage in 2025, 2024, 2023, 2022, 2021, 2020, 2019, 2018, 2017, 2016 and 2015.)
Surface mass balance
One way that scientists track the health of the Greenland ice sheet is by tracking changes to its “surface mass balance”.
This is the difference between ice gains from snowfall and losses from melt at the surface of Greenland’s ice sheet.
Greenland’s annual ice cycle runs from 1 September through to the end of August. The surface mass balance at the end of this period has, to date, always been positive, because the surface accumulates more snow than it loses from melting ice.
The ice sheet typically gains mass during the colder months of autumn, winter and spring. Then, as temperatures increase from around mid-June, the ice sheet begins to lose more ice through surface melt than it gains from snow.
(Greenland also loses ice when icebergs break off – or “calve” – into the sea, as well when the front of glaciers melt when they meet warm sea water. These losses are included in the “total mass balance” – see below.)
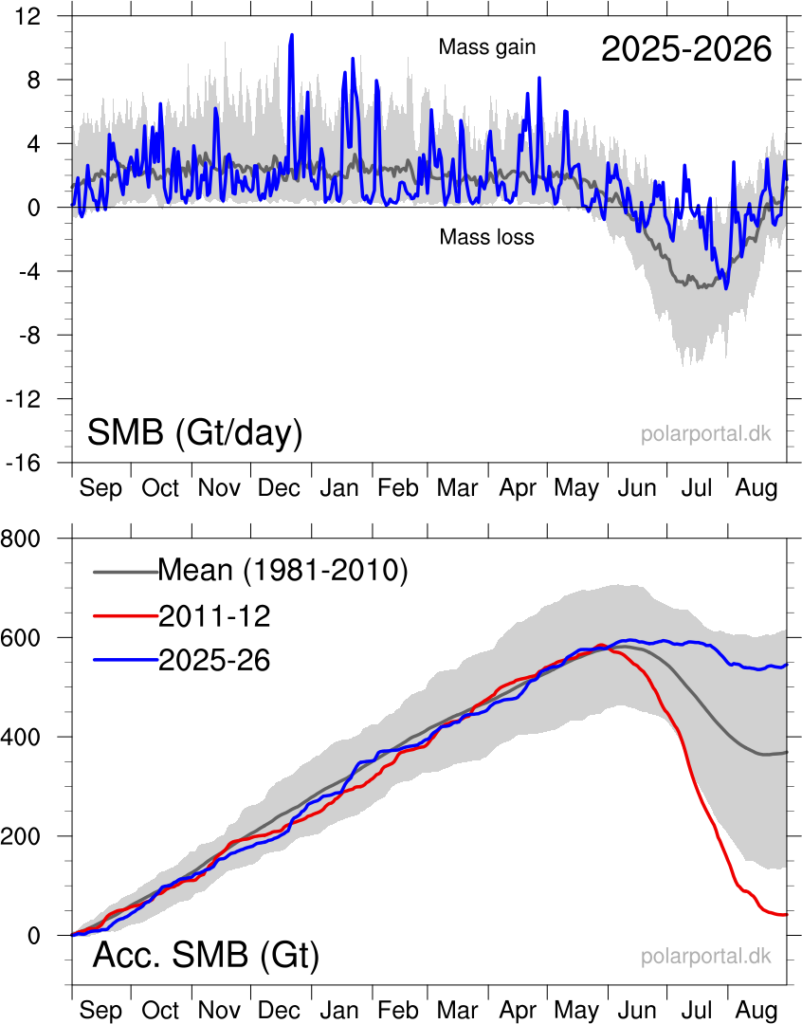
Greenland ended 2025-26 with an overall surface mass balance of 519bn tonnes.
This is the sixth highest in a dataset stretching back 46 years and about 178bn tonnes above the 1981-2010 average of roughly 350bn tonnes.
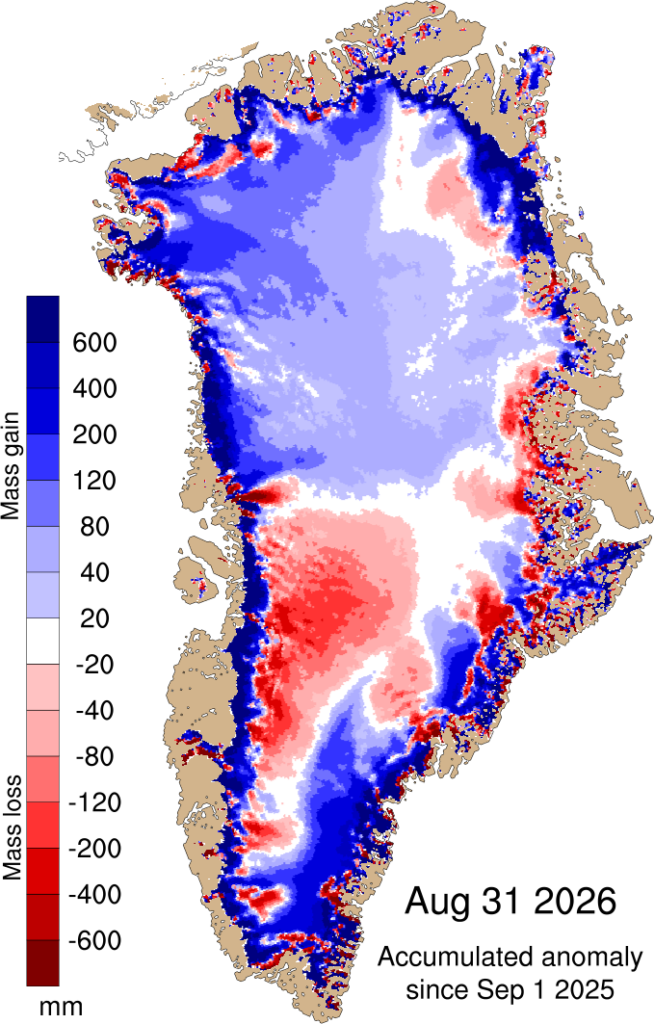
The map below shows the difference between the surface mass balance in 2025-26 and the 1981-2010 average, where blue shows ice gain and red shows ice loss.
The blue lines in the charts below show the surface mass balance throughout 2025-26 for individual days (top) and cumulatively throughout the year (bottom). They highlight how Greenland gained ice between September 2025 and May 2026, before starting to lose ice from June onwards.
Total mass balance
Another way scientists measure the health of the Greenland ice sheet is by looking at its “total mass balance”.
This calculation accounts for ice loss at the surface, as well as the calving of icebergs and the melting of glacier fronts where they meet warm seawater. The latter two components are known as the “marine mass balance”.
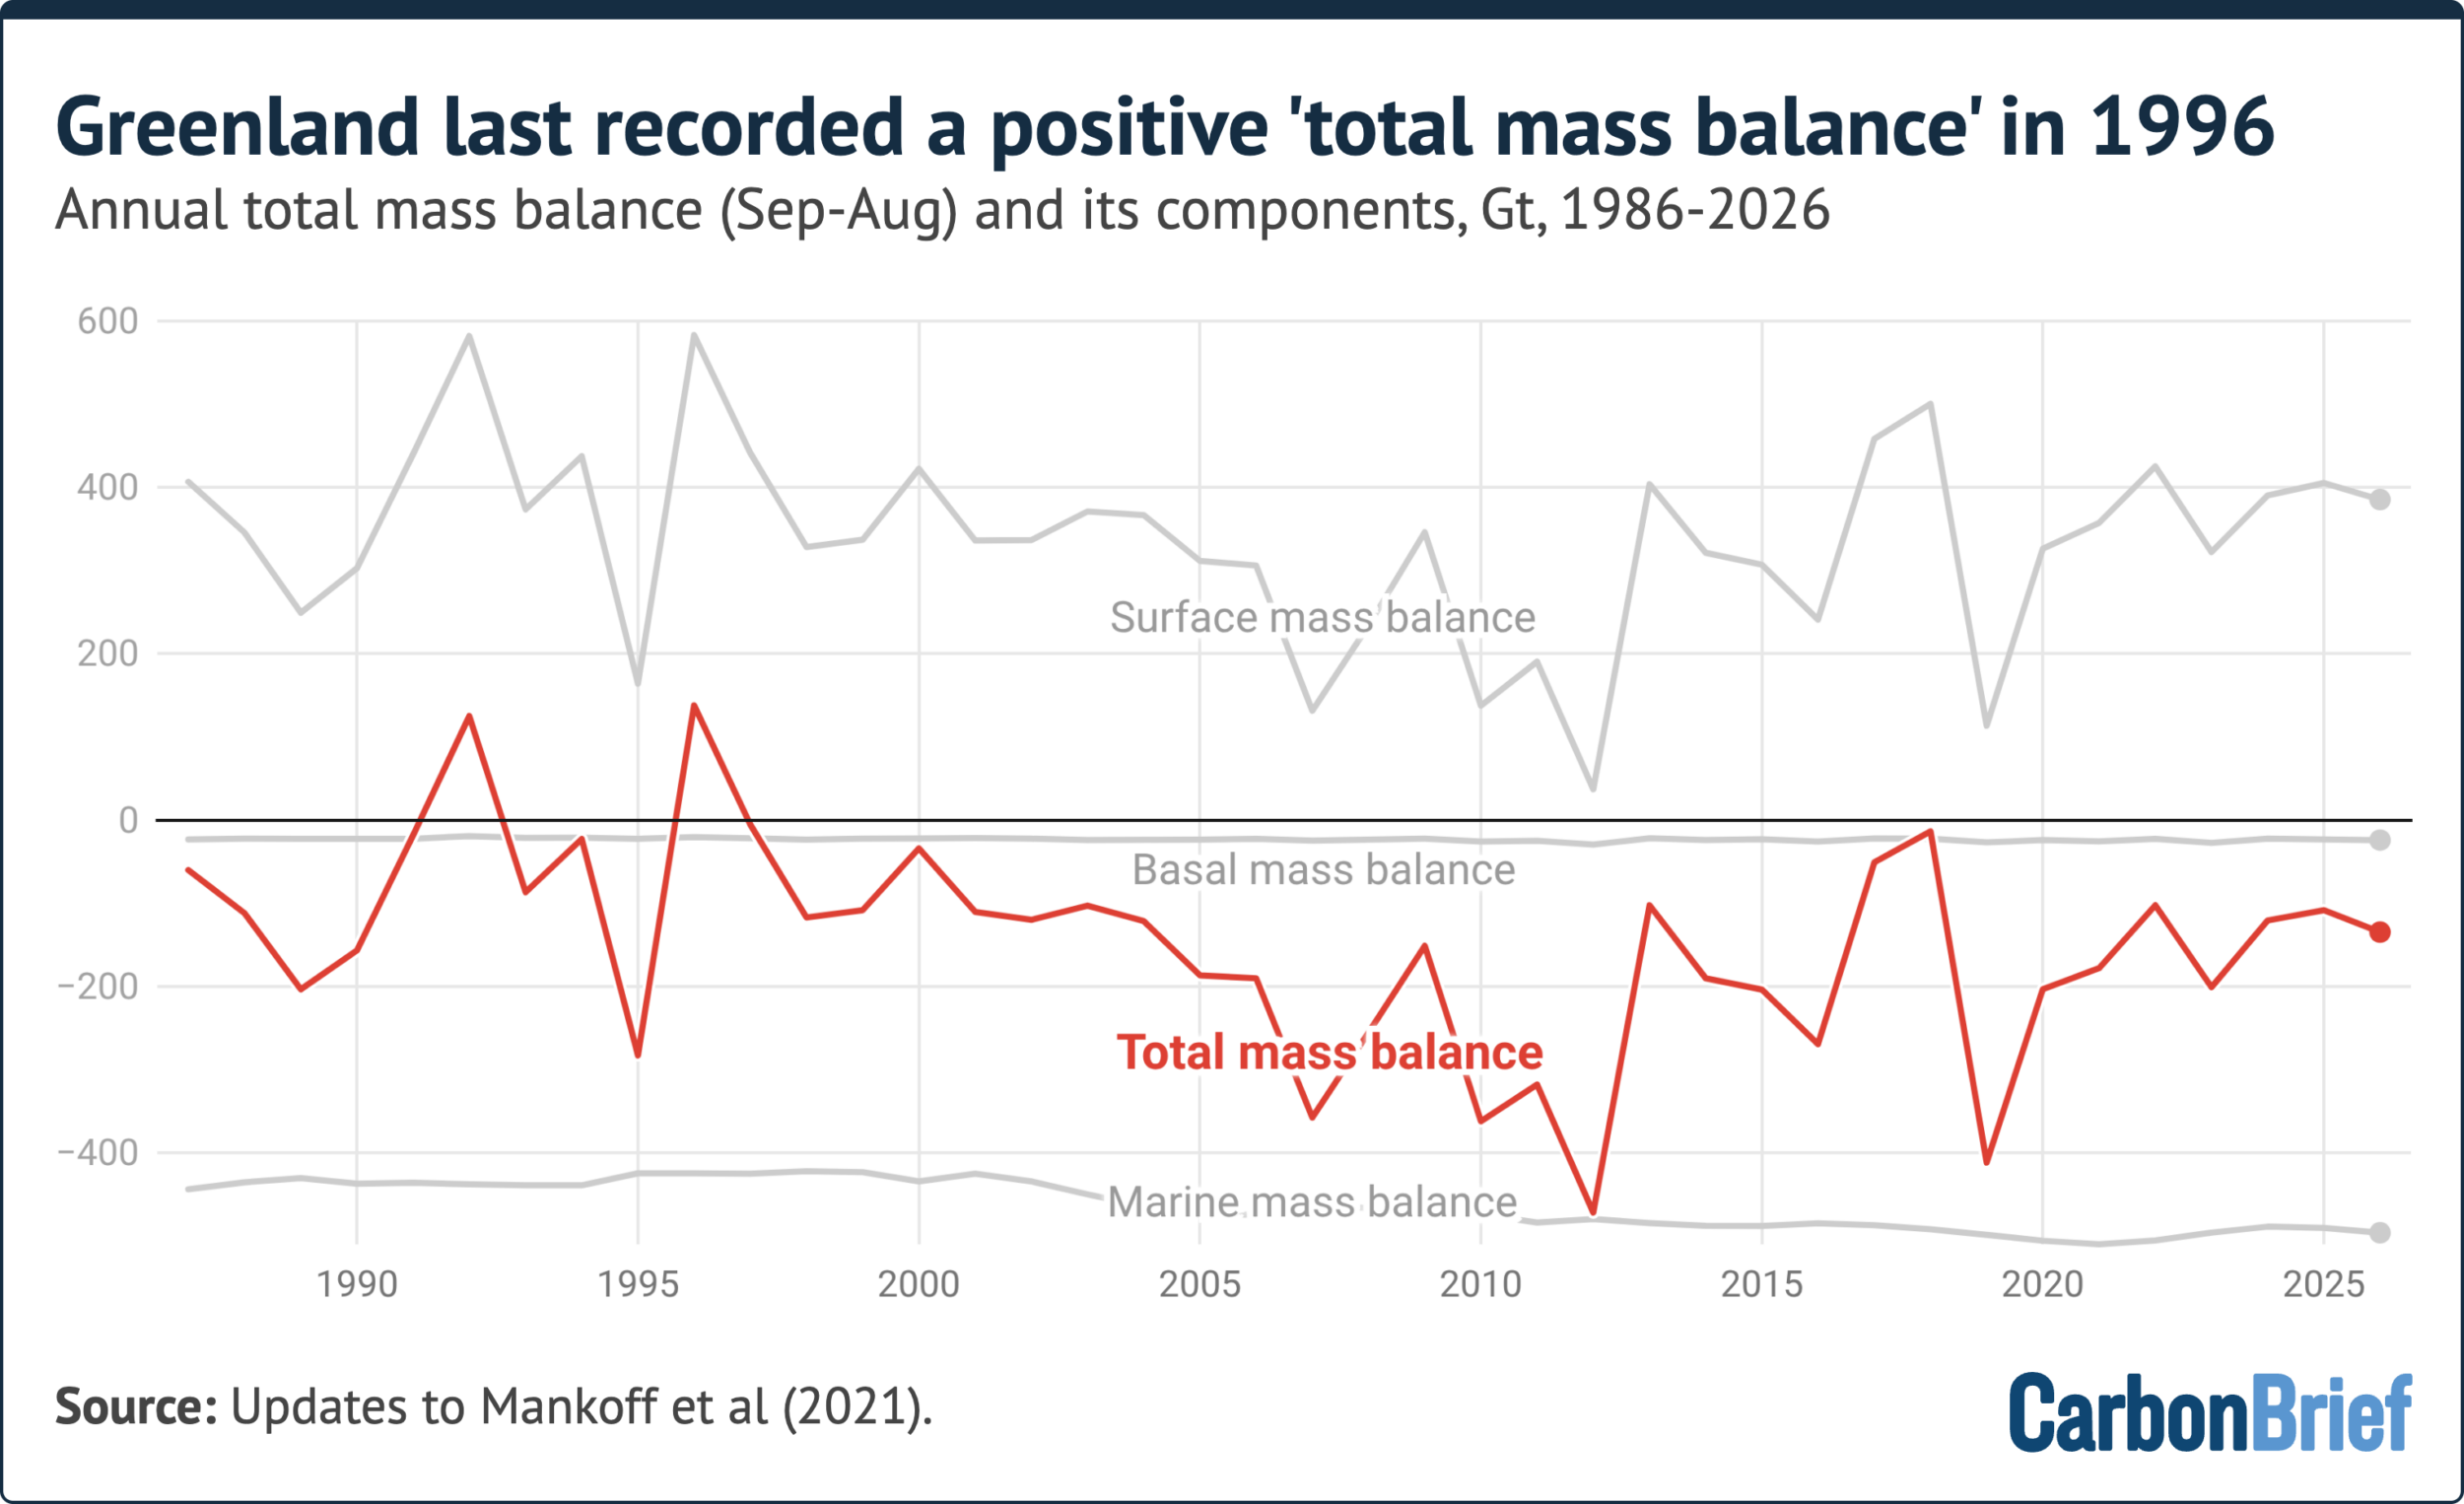
It also accounts for a small amount of ice melt at the underside of the ice sheet. This is known as the “basal mass balance”.
In recent decades, Greenland’s total mass balance at the end of the ice cycle year has been negative.
The 12 months to August 2026 were no different. Once all these factors are considered, Greenland lost around 135bn tonnes of ice.
We reached this figure using the same method featured in previous Carbon Brief analyses of Greenland ice cover. This approach is based on an average of three climate models.
However, for the first time, this year’s update includes a separate estimate for Greenland ice loss, based on data from one climate model and automatic weather stations, satellites, GPS data and observations from planes.
This approach estimates that the ice sheet lost an even greater 173bn tonnes of ice over 2025-26.
(Scientific estimates for ice loss in Greenland vary because there is incomplete information about how thick the ice sheet is, how fast it is moving as well as the rate at which it is melting at the surface. Scientists use different approaches for accounting for these uncertainties.)
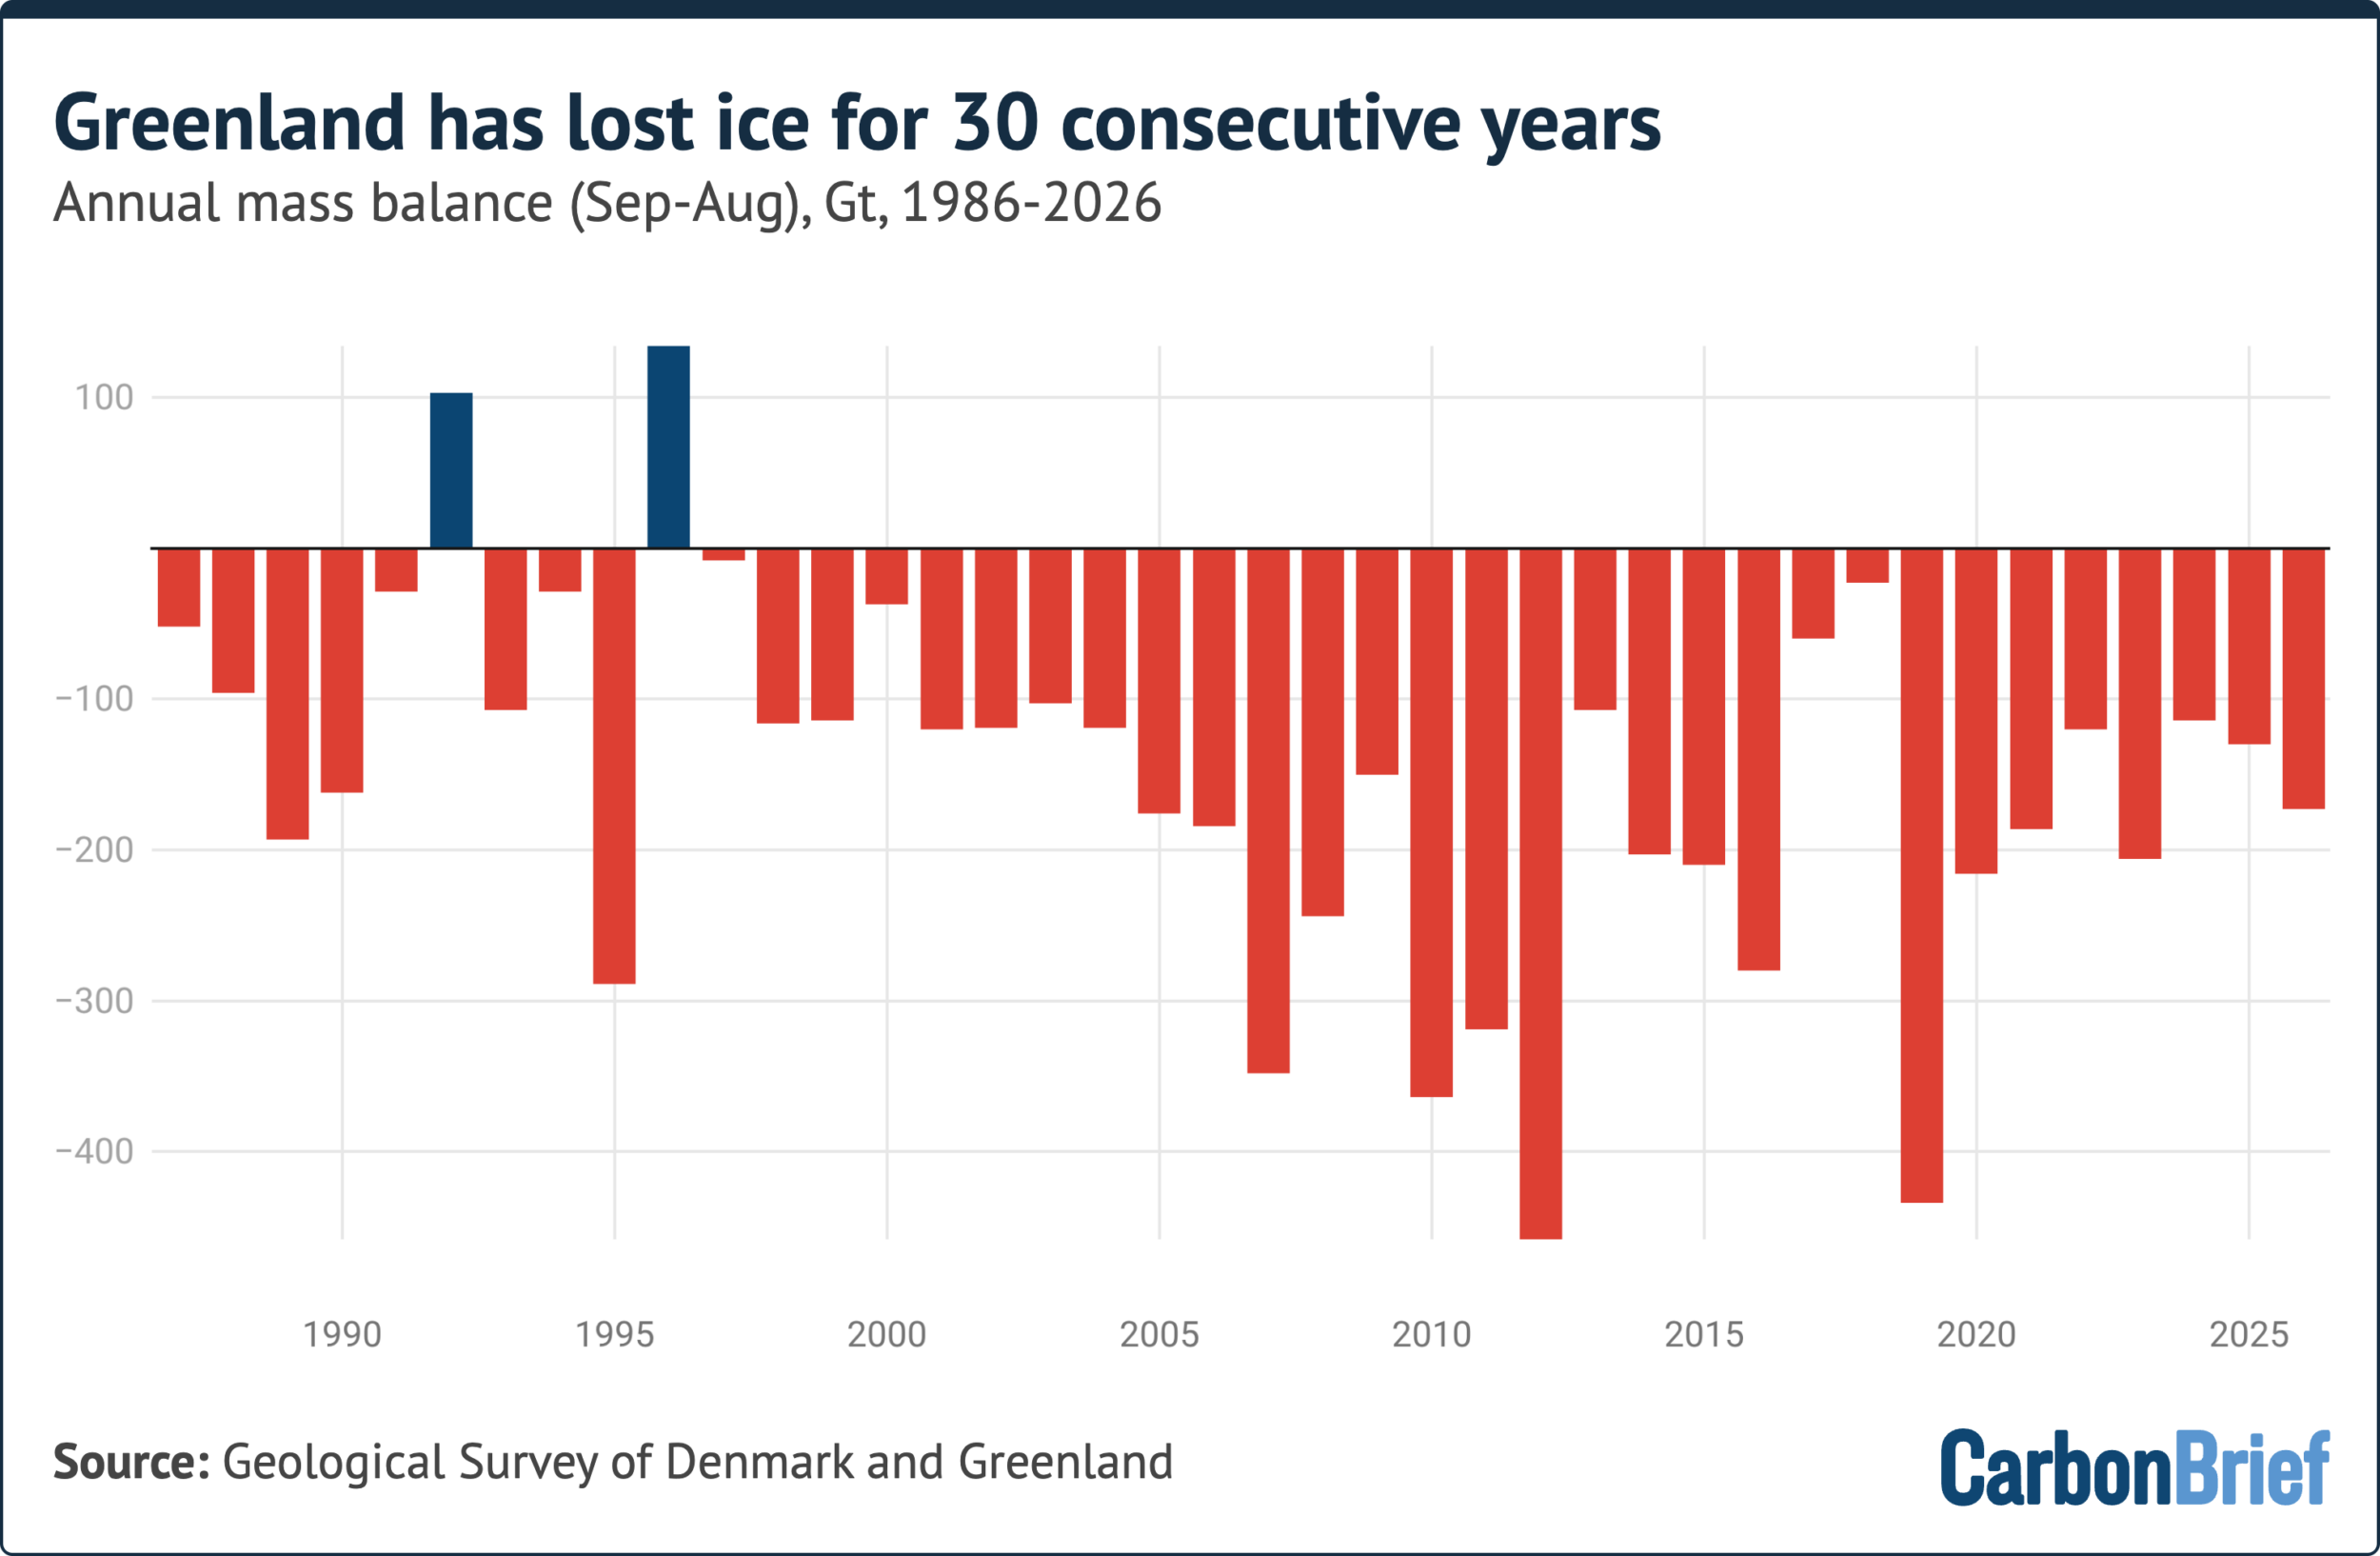
The chart below shows how Greenland’s total mass balance has changed since 1985, featuring the higher 173bn estimate for the last ice cycle year.
It shows how 2025-26 was the 30th consecutive year of ice loss in Greenland, with 1996 the last year that saw an annual net gain of ice.
The chart below shows how Greenland’s surface mass balance, marine mass balance and basal mass balance have changed since 1985. All of these components are combined to calculate the ice sheet’s total mass balance (red).
Surface melt
Winter and early spring in 2025-26 were unusually dry in the southern half of Greenland, leaving around 40bn tonnes less snow on the ice sheet than normal.
Dry winters typically mean high ice melt rates later on, given that heavier winter snowfall often acts as a protective shield that prevents ice loss in the early part of summer.
However, the relatively dry winter was followed by a relatively cool start of summer. Frequent snowfall and extensive cloud cover limited the sun’s ability to warm the surface at the time of year when solar radiation is typically strongest.
The onset of the melt season – the first of at least three consecutive days with melting over more than 5% of the ice sheet – occurred on 5 June, nine days later than the 1981-2010 average.
From the end of June, the weather in Greenland changed markedly, as warm, sunny conditions took hold.
During the first 20 days of July, melting was well above the 1981-2020 average. At its peak on 22 July, melting covered 74.9% of the ice sheet.
(For comparison, July 2025 holds the record for melt area in Greenland, when 81.2% of the continent was melting simultaneously.)
However, the early season fresh snow in June helped to form a cold and bright buffer, reducing the subsequent summer ice melt and runoff.
The map below shows how roughly three-quarters of Greenland’s ice sheet – shaded in red – was experiencing surface melt on 22 July. The chart shows how surface melt on that date (blue line) outpaced the 1981-2010 average (grey line and shading).