


Disseminated on behalf of Alaska Energy Metals Corporation.
On the surface, the global nickel market looks comfortable. Supply appears ample. Prices remain under pressure. Inventories continue to climb. However, this apparent balance hides a deeper problem. The world’s nickel supply has become heavily concentrated in one country, creating long-term risks that today’s surplus does not fully reflect.
The S&P Global Nickel CBS January 2026 report makes this point clear. While Indonesia continues to push large volumes of nickel into the market, warning signs are emerging. Policy uncertainty, slowing demand, and swelling inventories now shape the near-term outlook. At the same time, today’s oversupply is quietly setting the stage for future instability.
The Nickel Market is in Surplus, But Not in Balance
At first glance, the nickel market seems well supplied. S&P Global projects a 156,000-tonne surplus in 2026, even after Indonesia announced sharp cuts to its nickel ore quotas. This surplus explains why prices struggle to move higher, despite occasional rallies.
However, the quota cuts have not reduced output as much as expected. Indonesian smelters continue to run at high utilization rates. They rely on existing ore stockpiles and imports from the Philippines to keep production steady. As a result, global supply still runs ahead of demand.
This imbalance shows up clearly in inventories. LME nickel stocks climbed to 275,634 tonnes in January 2026, marking the largest inflows since 2019. Rising inventories signal that excess nickel has nowhere to go. Even Class 1 nickel remains widely available, keeping prices capped.
Weak Nickel Demand Keeps the Surplus Alive
Strong supply alone does not explain the surplus. Weak demand plays an equally important role.
S&P Global further analysed that in late 2025, manufacturing activity slowed across key regions. U.S. and Eurozone PMIs fell into contraction, weighed down by trade tariffs introduced under President Trump. These tariffs raised costs and disrupted supply chains, hurting industrial activity. At the same time, consumer confidence weakened, reducing demand for stainless steel and other nickel-intensive products.
China offered some support, but not enough to change the overall picture. Its PMI showed mild expansion, backed by measures in the 2026–2030 Five-Year Plan aimed at stabilizing the property sector. Even so, stainless steel production remains oversupplied, and EV battery makers continue to adjust designs to use less nickel.
As a result, near-term nickel demand growth stays muted. Despite this, speculative investors remain optimistic. Net long positions have stayed elevated for seven months, reflecting bets that supply disruptions will eventually outweigh weak fundamentals.
Is Oversupply More Than a Price Problem?
Oversupply does more than suppress prices. It distorts market balance.
When supply consistently exceeds demand, prices lose their ability to send clear signals. Even meaningful policy actions, such as Indonesia’s quota cuts, fail to trigger lasting price increases. The market simply absorbs the news and moves on.
At the same time, oversupply discourages investment outside low-cost regions. Higher-cost producers struggle to survive. In Australia, several operations have already cut output due to poor margins. These curtailments reduce supply diversity without tightening the market.
As a result, the world becomes more dependent on Indonesian nickel. While this keeps prices low today, it increases vulnerability tomorrow.
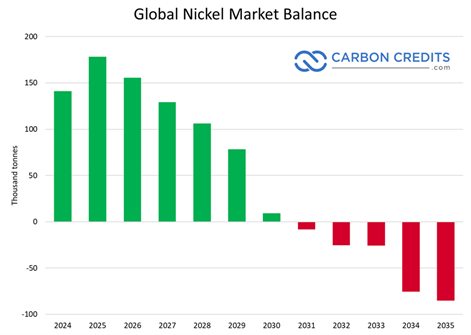
2030s Set to Flip the Nickel Market Balance
According to S&P Global, today’s surplus will not last forever.
The report projects that global nickel stocks will peak around 2028. After that, inventories begin to fall as demand improves and supply growth slows. By the early 2030s, the market balance flips.
By 2031, S&P Global expects the primary nickel balance to turn negative. EV battery demand accelerates as electrification expands. Stainless steel consumption recovers alongside global manufacturing. Meanwhile, Indonesian supply growth slows as easy expansions run out and regulatory risks increase.
Once inventories drop below comfortable weeks-of-consumption levels, prices respond quickly. S&P Global points to nickel prices rising toward $25,000 per tonne or higher, especially for Class 1 material.
Non-Indonesian Projects Hold the Key to Future Balance
As we understand now, oversupply is reshaping how the market thinks about security. During surplus periods, buyers focus on price. Origin matters less. Reliability takes a back seat. However, as balance tightens, priorities shift. A stable, politically secure supply becomes critical.
This is when non-Indonesian projects regain importance. Oversupply may delay their development, but it also ensures that fewer alternatives exist when demand rebounds. As a result, high-quality projects outside Indonesia gain strategic value.

AEMC’s Nikolai Project Stands Apart
This shifting market context brings Alaska Energy Metals Corp. (AEMC) into focus.
AEMC’s Eureka deposit, part of the Nikolai Nickel Project in Alaska, is now the largest known nickel resource in the United States. Importantly, the project is polymetallic. Alongside nickel, it hosts copper, cobalt, chromium, platinum, and palladium—materials critical to clean energy, infrastructure, and defense.
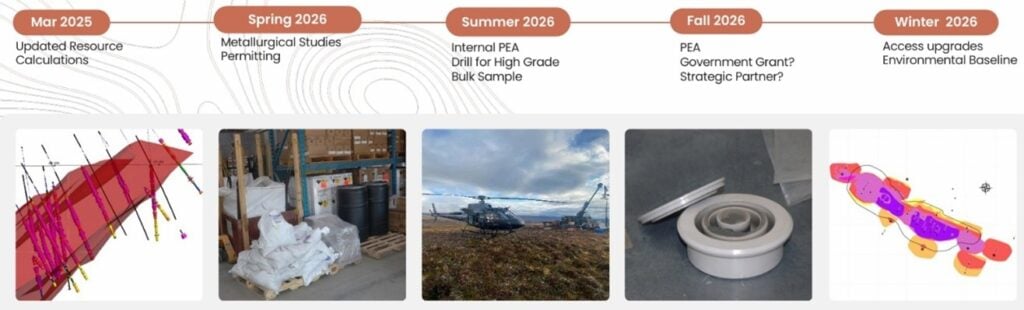
In March 2025, AEMC released an updated NI 43-101 compliant mineral resource estimate, prepared by Stantec Consulting Services. The update significantly expanded the project’s scale.
The estimate includes:
- 1.19 billion tonnes of Indicated resources, up 46%
- 2.09 billion tonnes of Inferred resources, up 133%
- 61 billion pounds of contained nickel in the Indicated category
- 9.38 billion pounds of nickel in the Inferred category
On a nickel-equivalent basis, the resource exceeds 29 billion pounds, placing it among the world’s largest undeveloped nickel assets.
Long-Life Supply with Strong Economics
Beyond size, the project’s quality strengthens its case.
The Eureka deposit features a low strip ratio of about 1.6:1, which supports lower operating costs. A higher-grade core sits near the surface, reducing early capital requirements. Mineralization remains consistent and continuous, extending in multiple directions with room for expansion.
Early metallurgical work suggests the ore should respond well to conventional processing, avoiding complex or risky technologies. Together, these factors support a long-life, stable supply source—something the U.S. currently lacks.
Why AEMC Fits the U.S. Strategy
The United States faces a widening gap between critical mineral demand and domestic supply. Nickel ranks near the top of that list, driven by EVs, grid infrastructure, and defense needs.
AEMC aligns closely with this strategy. The company is advancing permitting under the FAST-41 framework, plans to deliver a Preliminary Economic Assessment in Q1 2026, and continues hydrometallurgical testing to support future U.S.-based refining.
In a market dominated by Indonesian supply, AEMC offers diversification, security, and scale.
Today’s nickel surplus keeps prices low and inventories high. However, it also hides growing structural risks.
As oversupply fades and demand accelerates, the market will need new, reliable sources of nickel. Projects like AEMC’s Nikolai are not competing with today’s surplus—they are preparing for tomorrow’s shortage.
And when balance finally tightens, supply security may matter just as much as price.
Live Nickel Spot Price
- MUST READ: AEMC’s Nikolai: America’s Answer to Indonesia’s Nickel Crunch
DISCLAIMER
New Era Publishing Inc. and/or CarbonCredits.com (“We” or “Us”) are not securities dealers or brokers, investment advisers, or financial advisers, and you should not rely on the information herein as investment advice. Alaska Energy Metals. (“Company”) made a one-time payment of $75,000 to provide marketing services for a term of three months. None of the owners, members, directors, or employees of New Era Publishing Inc. and/or CarbonCredits.com currently hold, or have any beneficial ownership in, any shares, stocks, or options of the companies mentioned.
This article is informational only and is solely for use by prospective investors in determining whether to seek additional information. It does not constitute an offer to sell or a solicitation of an offer to buy any securities. Examples that we provide of share price increases pertaining to a particular issuer from one referenced date to another represent arbitrarily chosen time periods and are no indication whatsoever of future stock prices for that issuer and are of no predictive value.
Our stock profiles are intended to highlight certain companies for your further investigation; they are not stock recommendations or an offer or sale of the referenced securities. The securities issued by the companies we profile should be considered high-risk; if you do invest despite these warnings, you may lose your entire investment. Please do your own research before investing, including reviewing the companies’ SEDAR+ and SEC filings, press releases, and risk disclosures.
It is our policy that information contained in this profile was provided by the company, extracted from SEDAR+ and SEC filings, company websites, and other publicly available sources. We believe the sources and information are accurate and reliable but we cannot guarantee them.
CAUTIONARY STATEMENT AND FORWARD-LOOKING INFORMATION
Certain statements contained in this news release may constitute “forward-looking information” within the meaning of applicable securities laws. Forward-looking information generally can be identified by words such as “anticipate,” “expect,” “estimate,” “forecast,” “plan,” and similar expressions suggesting future outcomes or events. Forward-looking information is based on current expectations of management; however, it is subject to known and unknown risks, uncertainties, and other factors that may cause actual results to differ materially from those anticipated.
These factors include, without limitation, statements relating to the Company’s exploration and development plans, the potential of its mineral projects, financing activities, regulatory approvals, market conditions, and future objectives. Forward-looking information involves numerous risks and uncertainties and actual results might differ materially from results suggested in any forward-looking information. These risks and uncertainties include, among other things, market volatility, the state of financial markets for the Company’s securities, fluctuations in commodity prices, operational challenges, and changes in business plans.
Forward-looking information is based on several key expectations and assumptions, including, without limitation, that the Company will continue with its stated business objectives and will be able to raise additional capital as required. Although management of the Company has attempted to identify important factors that could cause actual results to differ materially, there may be other factors that cause results not to be as anticipated, estimated, or intended.
There can be no assurance that such forward-looking information will prove to be accurate, as actual results and future events could differ materially. Accordingly, readers should not place undue reliance on forward-looking information. Additional information about risks and uncertainties is contained in the Company’s management’s discussion and analysis and annual information form for the year ended December 31, 2025, copies of which are available on SEDAR+ at www.sedarplus.ca.
The forward-looking information contained herein is expressly qualified in its entirety by this cautionary statement. Forward-looking information reflects management’s current beliefs and is based on information currently available to the Company. The forward-looking information is made as of the date of this news release, and the Company assumes no obligation to update or revise such information to reflect new events or circumstances except as may be required by applicable law.
The post Nickel Demand for EVs Could Flip the 2030 Market Balance appeared first on Carbon Credits.

EU carbon credit claims changed on 27 September 2026, the day the Directive (EU) 2024/825 began to apply across the European Union. The change is narrow. It changes how a company can talk about the credits it buys. A product can no longer be called neutral on the strength of compensation alone; however, every specific, evidenced statement about what a company measured, reduced, and funded stays fully available.

The post Promoting Improved Cooking Practices in Nigeria appeared first on Terrapass.



