


IEA defines energy intensity as the amount of primary energy used to produce a given amount of economic output. It is the key global indicator to track energy efficiency- which is technically the rate of change in primary energy intensity.
At COP28, at least 200 countries pledged to double energy efficiency improvements by 2030. This is because this factor drives the world’s climate goals. Recently, IEA has rolled out its 2024 Energy Efficiency Report which has decoded the significance of energy efficiency with rising energy demands.
Let’s deep dive into this…
Energy Demand Surges with Electrification
A transition to electrification has gained ample significance with electricity’s share in total energy demand rising faster than in previous years. Electrification means shifting from fossil-fuel-powered systems to efficient electric alternatives. And this stands out as a positive force in an otherwise slow year for global energy efficiency.
The demand is further spurred by increased EV sales, industrial growth, and cooling needs, particularly in warmer regions. On the contrary, the demand for gasoline is slowing down in many regions due to the same reasons.
In 2024, the share of electricity in overall energy demand is expected to grow by nearly 2%, double the 1% average growth seen from 2010 to 2019.
Talking about EVs, the market continues to expand. IEA predicts, in 2024 EV sales can reach 17 million if one in five cars is sold worldwide. China remains a dominant player, accounting for about 60% of global EV sales last year. Overall, the EV boom is an example of electrification’s role in improving energy intensity even if overall efficiency progress remains modest.
However, reaching the net zero target by 2050 will require faster and sustained progress.

The Missing Piece in Achieving Net Zero Emissions
Energy efficiency is essential for reducing fossil fuel reliance and cutting emissions. In the IEA’s net zero pathway, ramping up energy efficiency could account for over 70% of the anticipated drop in oil demand and 50% of the reduction in gas demand by 2030. Thus, this energy efficiency is like the missing block that needs to be placed to bridge the net zero pathway.
However, the global efforts to reduce energy intensity are yet to reach targeted levels. In 2024, global energy efficiency progress is projected to improve by just 1%, the same rate as 2023, despite energy demand expected to rise by 2%.
Despite the historic pledge, a significant increase in policy action is necessary to accelerate the process of energy efficiency.

Energy Efficiency: Advanced Economies Slow in, Emerging Markets Pick Up
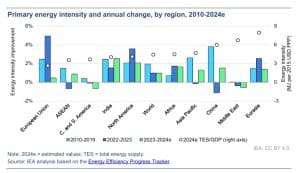
Last year advanced economies like the European Union and the United States showed strong improvements in energy intensity. In contrast, China, a long-time leader in energy efficiency gains, saw its energy intensity sharply decline from its decade-long average of 3.8% annual improvements. India’s progress also slowed, posting just 1.5% improvement.
However, in 2024, the momentum has shifted. Advanced economies are seeing slower energy efficiency progress, with the EU expected to improve by only 0.5% and the U.S. by 2.5%.
Meanwhile, emerging markets and developing economies (EMDEs) are starting to pick up the pace. China’s energy intensity is projected to improve by 1.5%, bouncing back from 2023’s decline, while India’s progress has accelerated to around 2.5%. Similar gains are anticipated in Southeast Asia, where energy efficiency initiatives are gaining traction.
As energy demand rises, maintaining efficiency improvements is becoming more challenging. Advanced economies are slowing, while EMDEs are showing modest progress. This shift highlights the need for tailored policies to drive efficiency across diverse regions and economic stages, especially when the world has already set an ambitious energy target.
Flexibility: Eases Grid Strain and Boosts Affordability
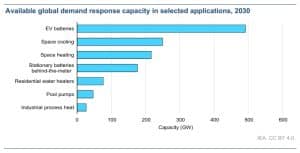
Another system-wide theme highlighted by IEA is flexibility across the grid. As renewable energy grows globally, the need for flexibility to balance grids is rising. Traditionally, grids relied on thermal and hydropower for flexibility. But now, demand-side management—such as smart appliances and battery storage, is emerging to provide this flexibility.
Following record growth in renewables in 2023, when nearly 565 GW was added, scaling up flexible, efficient solutions is crucial to manage demand and stabilize prices.
Government Strategies
Governments worldwide are responding. For example, the UK plans to release its Flexibility Markets Strategy by the end of 2024. It will focus on building a flexible market that contracted 4 GW last year. Australia’s New South Wales initiative is adding 1 GW of grid stability projects, and the Netherlands is committing $108 million to support battery storage integration.
Consumer Level Shift
The shift is not just confined to government policies but is also happening at the consumer level. In the UK, the Demand Flexibility Service trial involved 2.6 million households and 8,000 businesses, shifting demand and saving over 3.7 GWh during winter 2023-2024.
In the US and California, several federal initiatives are directed at improving grid flexibility and the growth of EVs. They are looking ahead to achieve this with support for smart heat pumps, dynamic-rate pilot programs, and funding for community-based grid innovation.
Digitization
Digitization plays a vital role in unlocking flexibility. New data-sharing platforms and dynamic tariffs, like Octopus Energy’s real-time rate and EDF’s EV charging scheme, incentivize users to adapt their energy consumption to grid needs. This will ease pressure on the grid and improve affordability. These efforts also highlight the growing integration of renewables, flexibility, and consumer-driven innovations.
The post IEA’s 2024 Blueprint: Energy Efficiency is the Key to Emission Reduction appeared first on Carbon Credits.


Most businesses that decide to act on their net-zero targets reach the same point of friction. Buying carbon credits has meant tracking down brokers, sitting through sales calls, and requesting a quote just to learn a price, sometimes with limited proof of what you are buying.

The earnings calls that quietly reframed climate from sustainability question to operating risk.
Three earnings calls in the last 18 months tell the story without any help from a press release.
Hershey, May 2024: cocoa price exposure compresses margin, and the company attributes part of the cost shock to West African weather. Olam, July 2024: coffee climate exposure quantified in the annual report. JBS, January 2025: supply chain climate disclosures expanded materially in response to investor pressure and regulatory expectation. None of these companies issued the announcement as climate news. They issued it as financial news. The climate-linked supply chain risk did not arrive with a sustainability framing; it arrived as a P&L line.
You are probably reading this article because you suspect the same thing is happening to your business. This piece walks through what is showing up on which earnings calls, how procurement and finance leaders are quantifying the exposure, and what serious corporates are doing about it before the regulator asks.
Where climate risk has already appeared in earnings
The pattern is consistent across resource-intensive sectors. A weather event compresses supply, the price spikes, the cost flows through the income statement, and the analyst on the call asks whether the event is anomalous or structural. Increasingly, the honest answer is the second one.
Cocoa is the cleanest example. The 2023 to 2024 West African harvest fell sharply on the back of erratic rainfall and disease. Cocoa futures more than tripled. Companies with concentrated West African sourcing absorbed the cost; companies with diversified sourcing absorbed less. The exposure was not climate as ESG topic. It was climate as cost of goods.
Coffee follows the same pattern. Brazilian and Vietnamese harvests have moved on weather more sharply across the last several seasons. Roasters with long-tenor supplier relationships and origin diversification have managed the volatility; roasters with spot-market exposure have not. Wheat, sugar, palm oil, beef: the same dynamic in different commodities, a pattern the IPCC AR6 Working Group II report projects will intensify across agricultural systems through mid-century.
What this means: climate risk is no longer a footnote in the 10-K. It is a line item the CFO has to explain on the call.
The three commodity exposures that hit margin first
For most companies with material Scope 3 exposure, three exposures dominate the near-term P&L risk.
- Concentrated single-origin sourcing in a climate-vulnerable region. If your tier-one supply for any material commodity sits in one geography, you have a concentration risk that climate amplifies. Diversification across origins is the obvious hedge, but it takes years to build and requires relationships you cannot acquire by tender.
- Supplier financial fragility under climate stress. Smallholder farmers, who supply a large share of the global cocoa, coffee, and palm oil market, do not carry the balance sheets to absorb yield shocks. When yields collapse, they exit. When they exit, your supply base shrinks, and the surviving suppliers raise prices. The risk is structural, not cyclical.
- Logistics and storage exposure to extreme weather. Hurricane disruptions to Gulf shipping, drought-driven Panama Canal restrictions, flooding in European inland waterways: each of these has moved input costs in the last three years, a pattern documented in Munich Re’s natural catastrophe data. The exposure shows up as a one-quarter event in the financial press but accumulates over time on the cost line.
TCFD and ISSB disclosure changes
The disclosure architecture has now caught up with the risk. The Task Force on Climate-related Financial Disclosures, whose recommendations are now embedded in the ISSB’s IFRS S2 climate standard, requires companies to disclose climate-related risks across physical and transition categories, with quantification where possible.
For physical risk specifically (the climate-linked supply chain risk you are reading about), the disclosure must address both acute exposures (extreme weather events) and chronic exposures (gradual changes in temperature, precipitation, and growing seasons). The disclosure must address the time horizon over which the risk is material, the parts of the value chain exposed, and the financial impact under different scenarios.
The CSRD imposes similar requirements under European law, with double materiality (both financial and impact materiality) embedded in the assessment. The practical effect: your auditors and your investor relations team now need a defensible answer to the climate-linked supply chain risk question, and the answer needs to be quantified.
What procurement and finance can do now
Three actions matter near-term.
Map your exposure. Most companies do not have a clear view of which tier-one and tier-two suppliers sit in which climate-vulnerable geographies. Without the map, you cannot quantify the risk, and without the quantification, you cannot disclose it credibly. The map is the foundation, and World Resources Institute climate risk research provides useful public tooling to start.
Diversify and deepen, in that order. Diversification across origins reduces concentration risk, but the deeper move is to invest in the resilience of the suppliers you already have. Regenerative practices, agroforestry, soil health interventions: these reduce yield volatility under climate stress and protect your input cost trajectory.
Embed the climate spend inside procurement, not outside it. Treating climate risk as a sustainability cost line subordinates it to the ESG budget. Treating it as a procurement and resilience investment puts it in the budget that matters, which is the cost-of-goods budget that the CFO defends quarterly.
Nature-based supply chain investments are the asset class designed for exactly this purpose. They sit inside the value chain, they reduce climate-linked supply risk, they generate verifiable Scope 3 reductions, and they produce the documentation an auditor and a regulator can both test.
If you are quantifying climate-linked supply chain risk in advance of the next earnings cycle or the next disclosure period, the carbon and sustainability experts at Carbon Credit Capital can help you map your exposure and structure a Dual-Value Model response that addresses reduction, resilience, and disclosure-readiness in a single program. Schedule a consultation.

More and more small and medium-sized businesses are hearing the same question from their larger customers: What is your carbon footprint? That question now travels down entire supply chains, and it arrives next to tender requirements, certification criteria, and rising customer expectations.




-
Climate Change1 year ago
Guest post: Why China is still building new coal – and when it might stop
-

 Greenhouse Gases2 years ago
嘉宾来稿:满足中国增长的用电需求 光伏加储能“比新建煤电更实惠”
-
Greenhouse Gases1 year ago
Guest post: Why China is still building new coal – and when it might stop
-

 Climate Change2 years ago
嘉宾来稿:满足中国增长的用电需求 光伏加储能“比新建煤电更实惠”
-

 Renewable Energy11 months ago
Sending Progressive Philanthropist George Soros to Prison?
-
Climate Change2 years ago
Bill Discounting Climate Change in Florida’s Energy Policy Awaits DeSantis’ Approval
-
Greenhouse Gases1 year ago
嘉宾来稿:探究火山喷发如何影响气候预测
-

 Carbon Footprint2 years ago
US SEC’s Climate Disclosure Rules Spur Renewed Interest in Carbon Credits