

Our new scientific assessment of how humans are affecting the climate is nothing short of alarming, yet it does contain some encouraging news.
The second “Indicators of Global Climate Change” report, published in Earth System Science Data, provides an annual update on a set of metrics originally assessed by the Intergovernmental Panel on Climate Change (IPCC).
With the latest IPCC assessment report on climate science completed in 2021 and the next one not expected until at least 2027, there is a substantial gap to fill.
This is crucial at a time when human activity is changing the climate system at a rate and scale not experienced since records began.
For 2023, which smashed the record for the warmest year, our best estimate of the warming caused by human activity is 1.31C above pre-industrial levels.
This is the first year where this estimate has reached the 1.3C threshold. Our report also shows that human-caused warming has been increasing at a rate of 0.26C per decade.
This high rate of warming is caused by a combination of greenhouse gas emissions being close to an all-time high and a reduction in the cooling impacts of aerosols as society tackles deadly air pollution.
Yet, there is some positive news: greenhouse gas emissions have not yet risen beyond pre-pandemic levels and there is evidence that the rate of increase in CO2 emissions over the past decade has slowed compared to the 2000s.

Tracking climate change
We track and document how datasets and methods evolve between IPCC report cycles. The aim is to increase transparency and consistency from one cycle to the next, as well as filling the gap between reports.
This takes an international team of more than 50 scientists, including former IPCC authors and curators of global datasets.
The work builds a chain of evidence from emissions to temperature change, bringing around 20 global datasets together, to make a consistent estimate of human-caused warming based on the best-available current data and science.
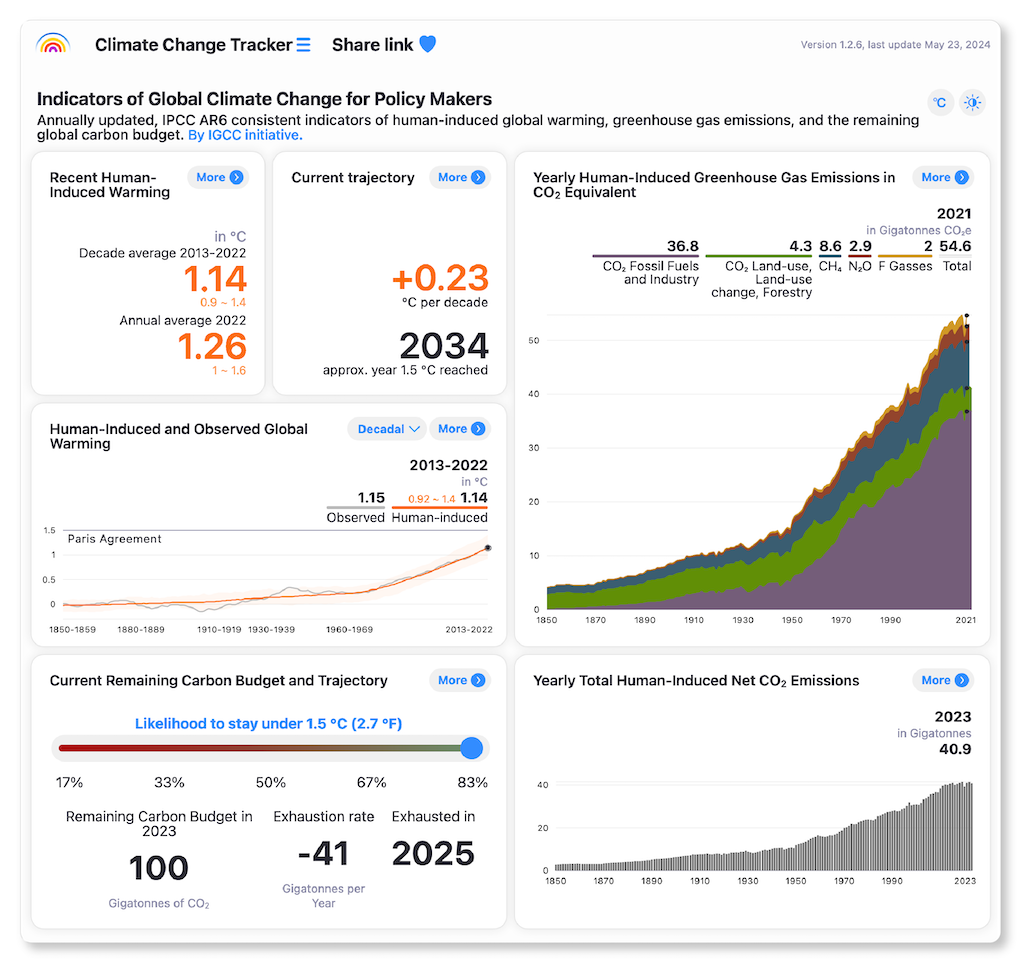
The data and their changes are displayed on a dedicated Climate Change Tracker platform, shown below.
Greenhouse gas emissions
The starting point for updating the indicators is data on greenhouse gas (GHG) emissions. The most recent decade we have data for (2013-22) shows that average global GHG emissions were equivalent to 53bn tonnes of CO2 (GtCO2) per year.
Total GHG emissions remain ever so slightly below the pre-pandemic high set in 2019, as the chart below illustrates.

With emissions rebounding in the wake of the Covid-induced lockdowns around the world, it is too early to say whether GHG levels have already peaked. For example, both CO2 emissions from coal and gas and emissions of non-CO2 gases are rising. Emissions from oil are also increasing again, but remain below pre-pandemic levels.
These growing emissions have been offset by a small decline in land-use emissions.
With the high levels of ongoing emissions, GHGs have continued to build up in the atmosphere. These in turn affect the heat gained by the Earth system, which is increasing its effective radiative forcing (ERF).
ERF resulting from human activity rose to 2.79 watts per metre squared (W/m2) in 2023, compared to 2.72 W/m2 in 2019. However, last year’s ERF is lower than 2022’s (2.91 W/m2), mainly because of the increase in aerosols from wildfires in 2023, which had a cooling effect. In 2023, the increased aerosols from wildfires more than compensated for the ongoing fall in sulphur emissions from shipping and other sources. (See sections below for more detail.)
Warming impact
High GHG emission levels are also affecting the Earth’s energy balance, with observations showing an increase in the rate of heating on land and in oceans. Satellites and ocean buoys are tracking unprecedented flows of heat into the Earth’s oceans, ice caps, soils and atmosphere.
This rate of heat flow has doubled from the levels seen in the 1970s and 1980s to 0.96W/m2 measured over 2011 to 2023. This means nearly 1W/m2 of additional heat is flowing into every square metre of the Earth surface, 24 hours a day, 365 days per year.
Human-caused global warming has also increased by 0.1C in the four-year gap in tracking since the last IPCC report.

Remaining carbon budget
Our publication also reassesses the remaining carbon budget – the amount of CO2 that can be emitted while still keeping global warming below a certain level.
In 2020, the remaining carbon budget for a 50% likelihood of staying below 1.5C was around 500GtCO2, with an uncertainty range of 300-900GtCO2. At current emissions rates, that would be exhausted within around 12 years.
Since then, CO2 emissions and global warming have continued. At the start of this year, the same budget stood at 200GtCO2, with a range of 100-450GtCO2. This would be blown within less than five years at current rates.
The remaining carbon budget is also impacted by future non-CO2 emissions such as methane, as well as the cooling effects of aerosols such as sulphates. With non-CO2 emissions expected to contribute to warming going forward, the carbon budget also accounts for their predicted warming effect.
In this future scenario, we also assume methane and nitrous oxide emissions decline; if they do not, the carbon budget will be even smaller.
Record warmth in 2023
Last year saw a large increase in global temperatures, approaching 1.5C above pre-industrial levels in some datasets and reaching 1.43C in the average of four datasets used in the IPCC report.
Seeing 1.5C total warming during one year – or even more than one – does not mean that the Paris Agreement has been breached, nor does reaching or exceeding 1.5C warming in a particular month or location.
The Paris Agreement’s long-term temperature goal reflects global, human-caused, long-term temperature change that excludes short-term natural variability in the climate system. However, higher and rising annual temperatures clearly mean that we are heading in the wrong direction.
Our indicators show that, for the 2014-23 decade, observed global warming was 1.19C, of which 1.19C – that is, 100% – was caused by human emissions.
This is shown in the chart below, which compares the estimated human contribution to warming in individual years (grey) with assessments for 2023 (red), the trend in 2023 (blue) and the 2014-23 decadal average (green).

For the individual year of 2023, humans were responsible for 1.31C of the 1.43C that was recorded globally. This means that there was a substantial contribution from other causes to the record temperatures of 2023.
Contributing factors
The reasons for the record warm 2023 are still being investigated – for example, they could include shipping emission reductions (see below) as well as natural factors, such as the climate phenomenon El Niño.
Sometimes these factors are not easily distinguished as human or natural. For example, growing forest fires and their impact on emissions and the climate system.
Last year, Canada experienced its most severe fire season of the modern era, while there were also catastrophic fires in Hawaii, the Mediterranean, central Amazonia and central Chile.
Establishing how much of this biomass burning, the resulting emissions of aerosols and their effect on the climate is from natural wildfires is not easy.
For example, if the wildfires were caused by higher temperatures, themselves caused by human activity, this would be a climate feedback rather than from direct human activity.
This is an area where development of a consistent approach across datasets is needed. The same goes for methane, where emissions are primarily from fossil fuel production, agriculture and waste. Yet, emissions are also increasing from tropical wetlands under a warming climate.
There has been a lot of interest in how sulphur regulations from shipping led to a rapid fall in sulphur dioxide emissions in 2020 and possibly contributed to high global temperatures in 2023.
Our paper makes a preliminary investigation of its climate impact and we find that the global radiative forcing effect of the declining emissions would likely only have had a minor role in the high 2023 global temperatures.
We estimate that, globally, the cooling effect of the aerosols from the fires in Canada likely dominated any warming effect from shipping emission regulation changes.
Next steps
As 2024 unfolds, we hope that the indicators can shed further light on how human activity is shaping our climate at rates and levels not previously seen.
The aim is that they help lay the groundwork for the level of ambition needed for the latest national pledges under the Paris Agreement – the 2035 nationally determined contribution (NDC) commitments – where we expect countries to put more ambitious targets forward to the UN Framework Convention on Climate Change (UNFCCC) by 2025.
Perhaps our next update, which will be delivered to the Bonn negotiations in 2025, will begin to track a change in direction for the climate system that reflects a realisation of stronger and ambitious climate action for the longer-term.


The post Guest post: Tracking the unprecedented impact of humans on the climate appeared first on Carbon Brief.
Guest post: Tracking the unprecedented impact of humans on the climate

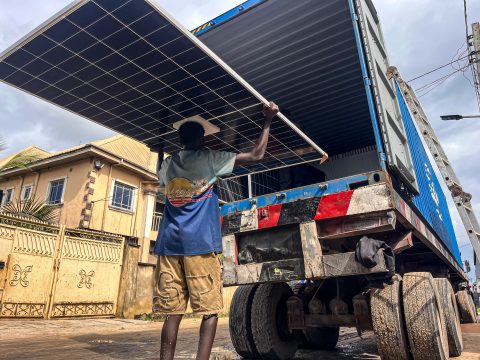
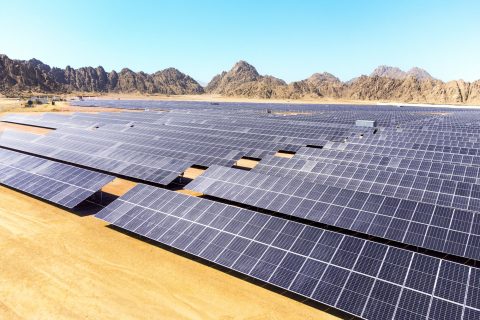
More than 300,000 solar panels and 120 battery containers are helping to power Africa’s largest copper mine with continuous clean energy in the Democratic Republic of the Congo, as miners turn to solar as an alternative to expensive diesel and energy imports.
The project at the Kamoa Copper mine in the south of the DRC, which became operational last month, is one of the largest solar and battery facilities generating baseload power on the continent.
The clean electricity is displacing millions of litres of polluting diesel and costs less than a fifth of the price of generator power per kilowatt hour, the mining company said.
The project is part of a massive solar deployment across the continent. Recent data from global energy think-tank Ember found record solar capacity of 17 GW will be installed in Africa this year – a 45% rise from 2025.
Installed by CrossBoundary Energy, a developer of distributed renewable energy systems, the solar-battery facility at the DRC mine is “proof of concept” that solar and battery systems can provide the reliable power at scale needed by remote industrial operations, Annebel Oosthuizen, managing director at Kamoa Copper, told Climate Home News in an interview.
“There’s always been this perception in the DRC that solar isn’t ideal because it is raining half of the year. But it’s perfectly ideal. We are seeing a lot of interest from other mines that are still depending on generators and power imports,” she said.
Mining drives solar and battery surge
Like Kamoa Copper, a growing number of miners in the DRC are looking to solar power to compensate for the country’s chronic energy deficit at a lower cost as global diesel prices hit record highs amid ongoing attacks on oil infrastructure in the Middle East.
As a result, the mining sector has become a key driver of the country’s growing clean energy demand and one of the biggest importers of large-scale solar equipment.
Ember found the DRC is set to install a record 1.7 gigawatts (GW) of solar panels this year – a 544% increase compared to 2025 and the equivalent of adding more than 60% of the country’s entire 2023 grid capacity.
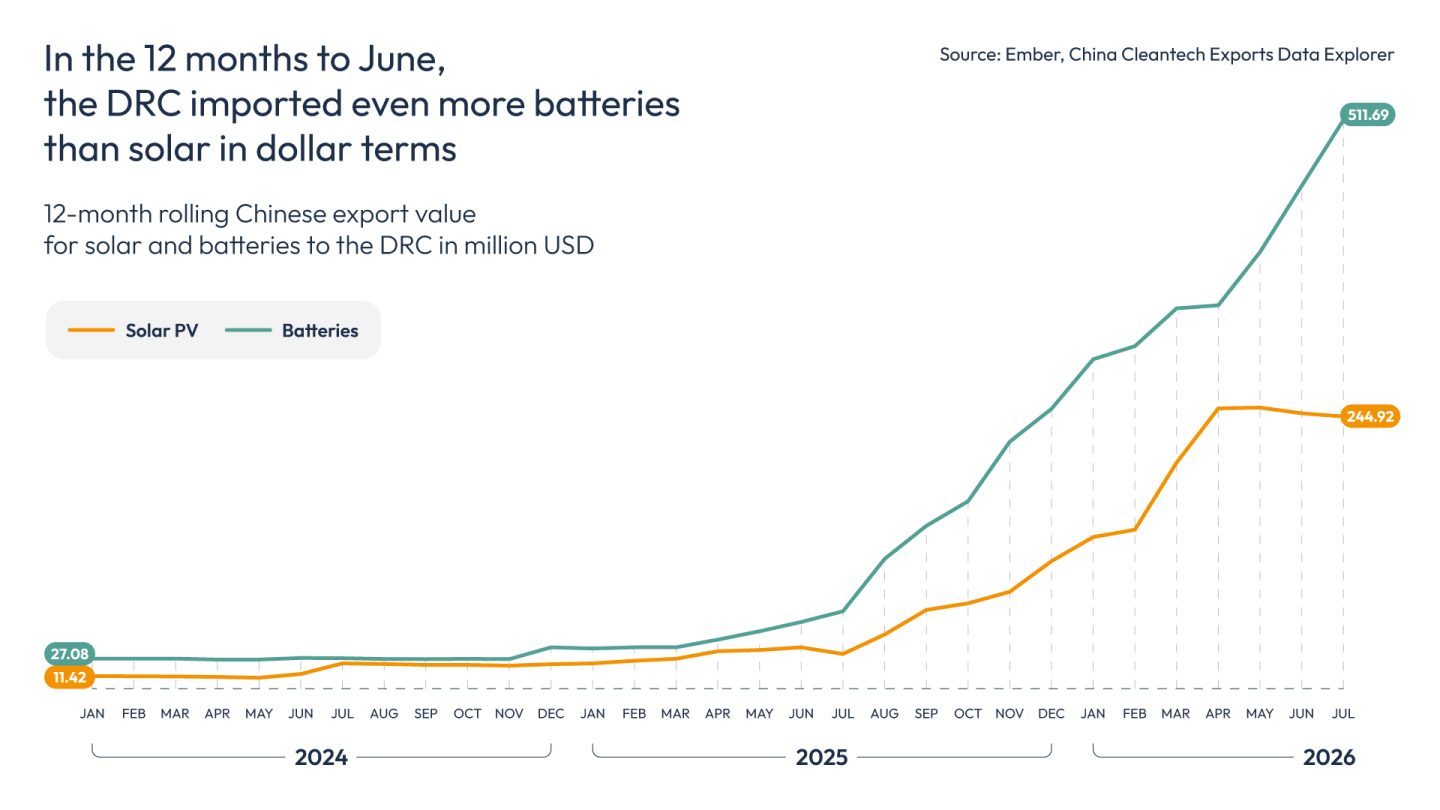
The deployment of combined solar and battery storage solutions to deliver stable energy supplies to mines has also caused battery imports to surge. In dollar terms, the DRC’s imports of batteries from China far exceeded that of solar in the year to June 2026, according to Ember.
A crippling power deficit
The DRC holds significant energy resources and some of the world’s largest reserves of the minerals required to manufacture clean energy technologies. It is the world’s largest producer of cobalt, which is needed to make batteries, and Africa’s top producer of copper – a metal sought after for its electrical conductivity which is pivotal to the world’s electrification efforts.
Yet just 22.5% of the DRC’s population had access to electricity in 2024 – one of the lowest rates in the world, according to the World Bank. And as mining expands and more of the minerals extracted are being processed in the country, unreliable power supply has become a major constraint for the sector, which contributed to more than a quarter of the country’s GDP in 2024, excluding oil and gas.
The country has enormous hydropower potential, with the hydroelectric potential of the Congo River estimated at around 100 GW. But only a fraction is being harnessed.
-
Made in Nigeria: The race to build an African solar industry from scratch
A solar power revolution is gathering pace in Africa and Nigeria wants a slice of the fast-growing industry, but competing with Chinese imports won’t be easy -
Can giant batteries unlock Africa’s green industrial future?
Battery energy storage systems (BESS) could drive clean tech manufacturing in Africa but shortfalls in finance and data are still limiting deployment at scale -
Egypt seeks to unlock renewable potential to power regional clean energy hub
Europe is investing in Egypt’s bid to position itself as a clean electricity exporter to reduce its emissions and generate a new source of income

Still, virtually all of the DRC’s grid-connected electricity is generated by hydropower by the state-owned utility, Société Nationale d’Électricité (SNEL).
The electricity then has to be transported more than 1,500 kilometres to reach the mining belt in the south – a challenge made more difficult by ageing grid infrastructure and limited transmission capability. SNEL did not respond to a request for comment.
“It is estimated that there’s around a 1 GW energy deficit for the DRC mining sector,” said Matt Tilleard, CEO of CrossBoundary Energy, which owns the solar and battery equipment at the Kamoa Copper mine and provides the power as a service.
“The interest in solar from the mining industry is not theoretical – it is already translating into large-scale solar and battery procurement for mining operations in the region,” he added.
Solar displaces gas, saves energy costs
The facility installed by CrossBoundary is part of a plan by Kamoa Copper to supply more of the electricity it needs with solar energy and batteries as its operations expand, a faster solution than relying on harder-to-build hydropower projects.
“Our processing capacity has increased drastically over the last couple of years. We’ve constructed the largest copper smelter in Africa and that is so power-intensive,” said managing director Oosthuizen.
A joint venture between Canadian firm Ivanhoe Mines, Chinese company Zijin Mining Group and the DRC government, the mine needs 235 megawatts (MW) of power, which is expected to nearly double to 450 MW in the next five years.
Kamoa Copper currently receives 100 MW from state utility SNEL – “and the rest we have to find a solution for”, said Oosthuizen.
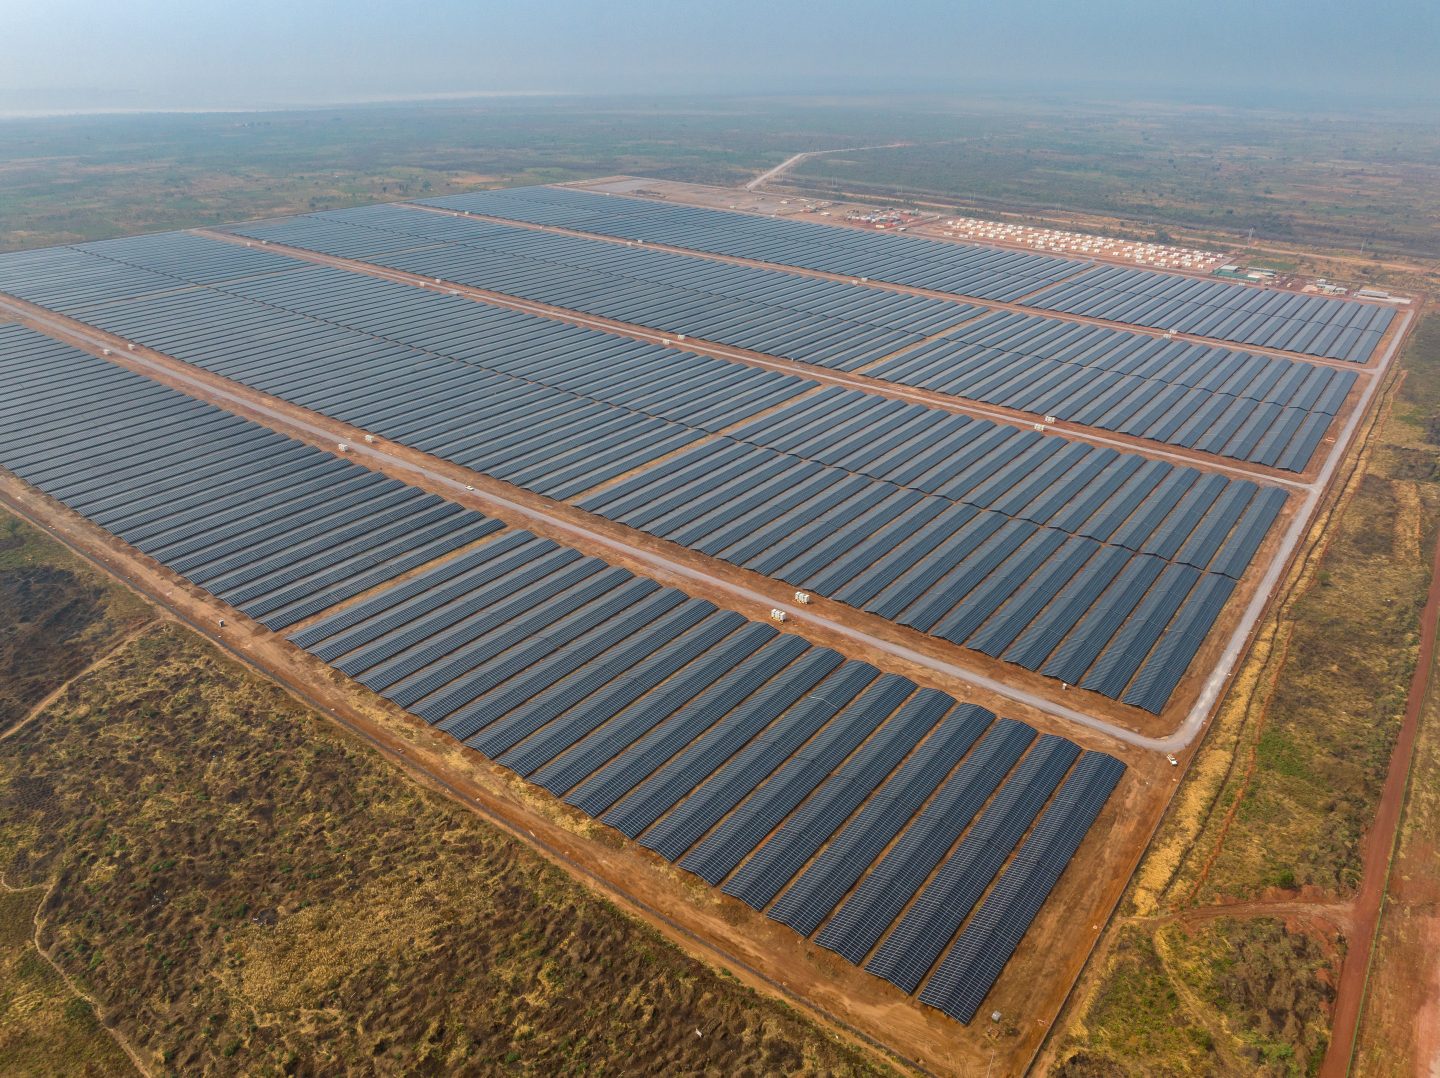
Another 30 MW solar and battery baseload facility is expected to come into operation this month, enabling around 25% of the mine’s power needs to be generated by solar energy. An additional 60 MW of continuous solar power will be added by the end of 2027, and the company is exploring options for more solar capacity and two hydropower projects.
The operational 30 MW of clean electricity provided by CrossBoundary Energy will power pumps that prevent 400 million litres of water from flooding the underground mine every day.
In August alone, the facility has reduced the mine’s diesel consumption by around four million litres, generating an estimated $11 million dollars in savings at current diesel prices, Oosthuizen said.
The mine still relies on generators to meet a 20-40 MW deficit and to power the trucks used in the mine, which Oosthuizen said would be difficult to electrify in the next five years because the technology isn’t yet ready to operate in the mine’s tough and wet conditions.
Avoiding a two-speed transition
To prevent a major imbalance between industrial players’ access to clean, reliable energy and the millions of Congolese who remain without power, the government requires private electricity producers to reserve at least 10% of their generated power for local communities living near rural production sites.
Delivering this, combined with rural electrification, mini-grid development and national grid expansion, is critical to prevent a two-speed energy transition that leaves people behind, said Catherine Mukobo, head of ACERD, the Congolese Association for Renewable and Decentralised Energies.
“Without implementing these policies, the DRC could get in a situation where mines have access to abundant modern energy while a large part of the population remains without electricity,” she said.
The post DR Congo’s power-hungry mining sector drives record solar surge appeared first on Climate Home News.
DR Congo’s power-hungry mining sector drives record solar surge
Climate Change
Commencement of NSW Forestry assessment a ‘chance to fix a broken system’ and deliver urgent forest protection
SYDNEY, Friday 18 September 2026 — In response to the Federal and NSW government’s announcement to commence an assessment of NSW forestry under the new national nature laws, Adele Chasson, Nature Policy Lead at Greenpeace Australia Pacific said:
“This is the Federal Government’s chance to fix a broken system that has enabled the destruction of NSW’s precious forests for far too long.
“Native forest logging continues to smash threatened species habitat. In NSW, it is pushing unique wildlife like koalas, greater gliders and glossy black cockatoos towards extinction. The state-owned logging agency has a disastrous record of environmental damage and breaches.
“The Regional Forest Agreement (RFA) system has failed, allowing the industrial logging of special forests for decades across Australia with no oversight. Thankfully, the Federal Government has started the process to finally remove the logging industry’s exemption from national nature laws.
“It’s time for the Federal Government to deliver the protection that forests urgently need, and that Australians overwhelmingly want. The Government must ensure a thorough assessment of the devastating impacts of native forest logging in NSW, and establish strong environmental rules that states must follow.
“These forests have been cared for by First Nations people for tens of thousands of years. They are some of the most biodiverse on the planet, store carbon, clean our air and water. It’s critical we protect them.”
ENDS
Media contact:
Kate O’Callaghan on 0406 231 892 or kate.ocallaghan@greenpeace.org
What happens when a love of marine life meets a playful imagination?
Sydney artist, illustrator and children’s author Sha’an d’Anthes, better known as Furry Little Peach, has teamed up with Greenpeace to create Happy Ocean Happy Planet: a joyful celebration of the extraordinary creatures that call our oceans home.
Sha’an felt inspired to create an illustration celebrating the beauty and resilience of marine life. Its hopeful message, A Happy Ocean is a Happy Planet, sparked a special collaboration with Greenpeace and a limited-edition t-shirt designed to help protect the oceans that inspired it.
The exclusive Furry Little Peach tee is available as a gift to new regular Greenpeace donors who give $30 or more and make at least three donations. By becoming a regular giver, you’ll help Greenpeace campaign for ocean protection.

ARTIST INTERVIEW: Sha’an d’Anthes (Furry Little Peach)
Sha’an shares the story behind the artwork, the local marine creatures featured in the design and why hope can be such a powerful force for action.
Hi Sha’an! Can you tell us a little about yourself and what you do?
My name is Sha’an d’Anthes, I also go by the pseudonym Furry Little Peach and I’m an illustrator, artist and children’s author based in Sydney, Australia. I love creating joyful, vibrant and nostalgic art that looks at the world through the lens of childlike wonder.

What do you love about drawing animals and nature?
I love all of the different shapes, colour and narrative you get to explore when drawing animals and nature. I’m also a city-slicker these days, and so I think that my work is a sort of escapism (for myself and hopefully for my audience).
How did the Greenpeace collaboration come about?
I went to the premiere of David Attenborough’s documentary Ocean, and felt compelled to create something to share the message of the film. This t-shirt is actually based off of that illustration including the tagline in I included when I shared it “A Happy Ocean is a Happy Planet”. I’m so grateful Greenpeace approached me for the project – it was a blast.
Where did you start when creating the Happy Ocean Happy Planet design?
The Happy Ocean tee starts the same as all of my work – with a brainstorm/braindump and really loose concept sketches.
How did you choose the animals for the illustration?
I actually asked Greenpeace to help me with the research of local marine life and they were so accommodating. They very quickly delivered me a huge list of local species of fish, mammals and coral and I just went through and looked up each creature and curated a little group of sea life that I thought would look sweet together – a mix of sizes, types, colours, textures and shapes.
What did you use to create the artwork?
So much of my work is traditional, but when it comes to things like t-shirts I always use digital drawing programs because I like to draw each colour in a separate layer which requires me to jump in and out of layers because it allows me to control colour and printing. When working digitally I always sketch in Procreate (an Australian digital art app), and then with this project I created final art in Adobe Fresco because it called for a vector graphic (an image that can be blown up to any size).
Do you have a favourite creature in the design?
I love painting Humpback Whales and always have, but I also have a soft spot for the sweet little Jelly Blubber jellyfish.
What did you want people to feel when they saw the artwork?
I specifically wanted to focus on the outcome that all of us want to see – a happy, thriving ocean where creatures are given the time and space to balance themselves. I feel that even when tackling tough subjects, leaning into hope is my natural inclination. As long as we have hope that things can be better, we will continue to take action.
What was the most fun part of creating it?
I actually documented the entire process of this project in a studio vlog on YouTube – and you can see how much fun I’m having doing final art jumping between layers and building the image. I had just come off completing final art for two books which are multi-year long projects, so being able to do a project that from start to finish in just a few days was really freeing at the time.
What does a “happy ocean” mean to you?
An ocean that given the time and space to repair and balance itself. Something I really took away from David Attenborough’s Ocean is that ocean ecosystems are actually really good at repairing themselves if we just let them do their thing.
How can people get their hands on the t-shirt?
The shirt is a reward for regular givers to Greenpeace – those who commit to at least 3 months of donations will receive the tee as a gift. Read about how at http://act.gp/flp-tee
How is Greenpeace helping to make our oceans happier places?
They have a deep focus on the health and happiness of our oceans through advocating for the set up of marine sanctuaries, holding big ocean polluters to account and calling for a ban on deep sea mining.
What are you working on next?
I will be jumping headfirst into Peachtober – an annual daily art challenge I run each year in October, if there are any artists reading this it’s a great time so please come join! In terms of publications my next picture book The Late Bird will be out in February 2027 (published by Harper Collins US) and then I have an creative activity book for adults coming out next August with Chronicle US and Penguin Australia. Otherwise you can always check out what I’m tinkering away with in my studio on Instagram and YouTube.




-

 Greenhouse Gases2 years ago
嘉宾来稿:满足中国增长的用电需求 光伏加储能“比新建煤电更实惠”
-
Climate Change1 year ago
Guest post: Why China is still building new coal – and when it might stop
-
Greenhouse Gases1 year ago
Guest post: Why China is still building new coal – and when it might stop
-

 Climate Change2 years ago
嘉宾来稿:满足中国增长的用电需求 光伏加储能“比新建煤电更实惠”
-

 Renewable Energy11 months ago
Sending Progressive Philanthropist George Soros to Prison?
-
Climate Change2 years ago
Bill Discounting Climate Change in Florida’s Energy Policy Awaits DeSantis’ Approval
-
Greenhouse Gases1 year ago
嘉宾来稿:探究火山喷发如何影响气候预测
-

 Carbon Footprint2 years ago
US SEC’s Climate Disclosure Rules Spur Renewed Interest in Carbon Credits