

Estimating Earth’s climate sensitivity, the global average warming from doubling CO2 above pre-industrial levels, is an urgent task as it governs how much the world will warm from fossil-fuel emissions.
Recent work has essentially ruled out low values of climate sensitivity below about 2C, but how much do we know about high values of climate sensitivity?
There is an active debate about the likely upper bound of climate sensitivity, which informs the worst-case projections of warming over the coming decades.
One way to narrow this down is to study the major climate changes of Earth’s past seen in palaeoclimate “proxy data”. These records are scattered across the planet, found in everything from ice cores and ocean sediments to tree rings and coral reefs.
Combining proxy data with climate models helps scientists understand what past changes were caused by natural fluctuations in CO2 and what changes we can expect from human-caused CO2 increases in the future.
In our new study, published in Science Advances, we find that the Last Glacial Maximum – a period of extensive ice cover about 21,000 years ago – provides even stronger evidence for modern-day climate sensitivity than previously thought.
Our estimates suggest a central estimate of “equilibrium” climate sensitivity of 2.9C, with a very likely range of 2.1-4.1C.
This is around a 30% narrowing of the 2.0-5.0C range in the latest assessment from the Intergovernmental Panel on Climate Change (IPCC).
Our findings give us more confidence that very high climate sensitivity is unlikely. They also support the IPCC’s central estimate for climate sensitivity of around 3.0C and lower estimate of 2.0C, confirming that warming would still be severe if we do not reduce fossil-fuel emissions.
Progress in climate sensitivity
For many years, the estimated range for equilibrium climate sensitivity (ECS) remained stubbornly wide.
After the landmark Charney report established a “consensus” position from a study group convened by the US National Research Council back in 1979, many IPCC assessments over several decades were unable to narrow it further.
This is illustrated in the chart below, which shows the Charney report estimated range for ECS (grey bar) on the left, followed by each IPCC report in sequence, from the first in 1990 (“FAR”, light blue) through to the most recent AR6 range on the right (red). Central estimates are shown with a dot, where available. The coloured bars indicate the estimated likely range for ECS and very likely ranges are marked with whiskers.

Estimates of ECS published in successive IPCC assessments since the Charney report in 1979. Dots show central estimates. The coloured bars show the likely range and the very likely range is given by whiskers. Chart by Carbon Brief
Ahead of the IPCC’s sixth assessment report (AR6), a four-year project from an international team of scientists made a significant advance.
The resulting paper by Prof Steven Sherwood, Dr Mark Webb and colleagues, published in the Review of Geophysics in 2020, formally combined multiple lines of evidence from observed data to improve understanding of the climate “feedbacks” that can amplify or dampen surface warming. The paper played a key role in the narrower ECS range in AR6 (red bar in chart above) – particularly in raising the lower bound to 2.0C and setting the upper bound at 5.0C.
However, observed data from recent warming are not as useful for constraining the upper end of ECS estimates. This is because climate feedbacks – especially how warming affects cloud properties that either enhance or reduce their overall cooling effect – depend on spatial patterns of temperature change. Climate scientists have dubbed this phenomenon the “pattern effect”.
Pattern effects
Temperature patterns over recent decades differ substantially from what we expect in the long-term. This means that climate feedbacks are likely to change in the future too, making observed warming a relatively poor predictor of how high climate sensitivity could be.
This is where palaeoclimate data comes in. The Last Glacial Maximum (LGM) has been touted as the best evidence for or against high values of climate sensitivity. By estimating how much colder the Earth was when CO2 levels were so much lower during the LGM, scientists can predict how much warmer the Earth would be with higher CO2 levels decades from now.
However, doing so requires isolating how much of the LGM cooling came from lower CO2 and correcting for how the climate’s sensitivity to CO2 differs between the cold LGM and the warm modern-day climate. Prior to our study, no one had quantified the impact of temperature patterns on climate sensitivity in the palaeoclimate record.
Traditionally, the additional cooling effect of the vast LGM ice sheets, which covered much of Canada and northern Eurasia, has been estimated from the amount of sunlight they directly reflect. But the ice sheets also caused the nearby northern Pacific and Atlantic oceans to cool and produce more low clouds, amplifying global cooling by reflecting even more sunlight. This ocean cooling is illustrated by the dark blue shading in the left-hand map below.
By linking these adjacent cloud changes to the ice sheets, we found that relatively more of the LGM cooling was caused by the ice sheets and relatively less came from the lowered CO2.

Importantly, these amplifying cloud feedbacks are unique to the climate during the ice age and, therefore, do not apply to modern CO2-driven warming that will not have similarly large ice-sheet changes.
As a result, the amount of cooling from lower CO2 at the LGM is not consistent with very high values of modern-day climate sensitivity above around 4C.
Accounting for differences between the LGM and modern climates allows us to lower the upper end of climate sensitivity estimates, representing a major shift in how palaeoclimate data is used to inform our future.
Combining palaeoclimate data with climate models
Quantifying the climate differences mentioned above for the LGM requires estimating temperature patterns and climate feedbacks from 21,000 years ago.
An obvious challenge is that our instrumental temperature records span only centuries and our satellite observations of clouds span only decades. Fortunately, there have been two major advances in recent years that allowed us to quantify the pattern effects from the distant past.
First, palaeoclimate data assimilation is a recently developed method that combines climate model simulations with proxy data, producing globally complete reconstructions of surface temperatures during the LGM. However, there are still major uncertainties in this method. Various groups have recently reconstructed the ice age, finding somewhat different temperature patterns. To assess this uncertainty, we use four available reconstructions.
Second, we use these reconstructed surface temperatures in global atmosphere models to estimate climate feedbacks during the LGM and compare them to feedbacks expected from CO2 doubling. Because different models produce different climate feedbacks – even when given the same reconstructed surface temperatures – we assess this feedback uncertainty using five different atmosphere models.
Despite the uncertainties, a consistent story emerged. Climate feedbacks strongly amplified LGM temperature changes, much more so than climate feedbacks under modern-day warming from CO2 alone. We traced these differences primarily to cloud feedbacks in the North Pacific and North Atlantic Oceans where the patterns of temperature change strongly differ between the LGM – due to the presence of large ice sheets – and future warming from CO2.
At first glance, the extra amplifying feedbacks of the LGM could appear to suggest that climate sensitivity is higher than we thought. A recent study led by Dr James Hansen, former director of the NASA Goddard Institute for Space Studies, reported that some of the same reconstructions used here are consistent with a modern-day climate sensitivity of around 4.8C.
However, that interpretation is reversed when we recognise that those amplifying feedbacks are unique to the ice age climate and do not apply to the modern-day climate.
The result is that modern-day climate sensitivity, as estimated from the LGM, is actually lower than has been reported by studies such as Hansen’s that have not accounted for the unique effect of ice sheets on climate feedbacks.
Our findings also challenge a common assumption that warmer climates are more sensitive than colder climates. While that assumption appears likely to be true for climates warmer than today, it appears to be false for climates colder than today when the effect of ice sheets on temperature patterns and feedbacks is included.
Implications for future warming
The LGM, after accounting for how temperature patterns impact climate feedbacks, ends up being an even stronger constraint on modern-day climate sensitivity – especially the upper bound.
To the best of our knowledge, this is the first time that considering pattern effects has helped constrain climate sensitivity instead of adding to its uncertainty for modern-day climate.
Given the importance of combining multiple lines of evidence, we use the community framework from the Sherwood, Webb et al (2020) study, updated to include our estimate of how climate feedbacks differ between the LGM and modern-day warming.
As the chart below shows, our revised best estimate of climate sensitivity (blue) becomes 2.9C with a very likely range of 2.1-4.1C, a substantial narrowing of uncertainty by reducing the upper bound.
In contrast, the IPCC AR6 very likely range was 2.0-5.0C with a best estimate of 3C (red), while the Sherwood, Webb et al (2020) study reported 2.3-4.7C and central estimate of 3.1C (yellow).
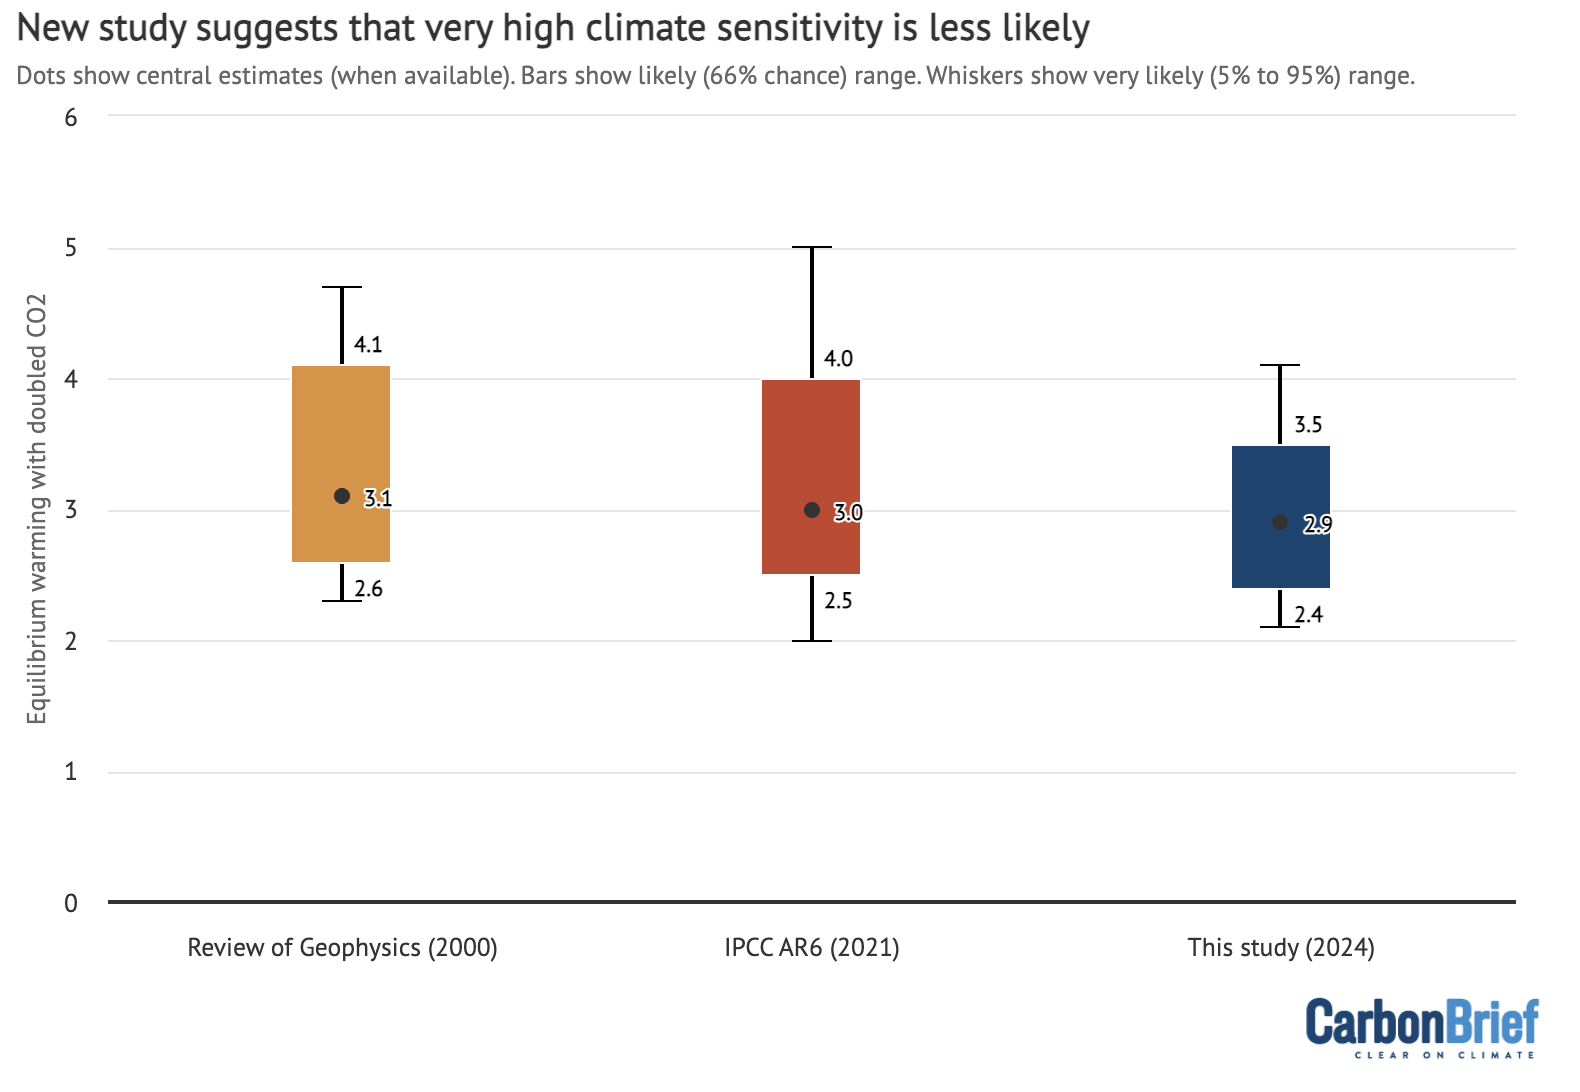
Modern-day ECS estimates from recent assessments, including the Sherwood, Webb et al (2020 study (yellow), IPCC AR6 (red) and this study (blue). Dots show central estimates. The coloured bars show the likely range and the very likely range is given by whiskers. Chart by Carbon Brief based on data provided by V Cooper and K Armour
While the lower bound and central estimates are mostly unchanged, our findings reduce the upper bound by approximately 1C.
Based on the modelled relationship between climate sensitivity and future warming, lowering the upper bound on climate sensitivity from 5C to 4.1C translates to a reduction of 0.4-0.8C in the upper end of global warming estimates by 2100 (the range reflects uncertainty in future emissions). In other words, this is a substantial reduction in the likelihood of extremely high warming.
Our results for the LGM show that temperature patterns and their effects on climate feedbacks must be accounted for when using past climates to estimate modern-day climate sensitivity.
Spatial reconstructions of past climates are a necessity and there are opportunities for further progress in constraining climate sensitivity by analysing temperature patterns and feedbacks in other past climates.


The post Guest post: Ice-age analysis suggests worst-case global warming is less likely appeared first on Carbon Brief.
Guest post: Ice-age analysis suggests worst-case global warming is less likely

Climate Change
“Sink or swim”: WA Gov hugely underestimating decline in regional gas demand while sleeping on green exports, new report finds
PERTH, Tuesday 13 October 2026 — A new report from Greenpeace Australia Pacific and Springmount Advisory reveals green commodity exports are an untapped economic opportunity for Western Australia in a declining Asian gas market, while offering a genuine solution for decarbonising Asia.
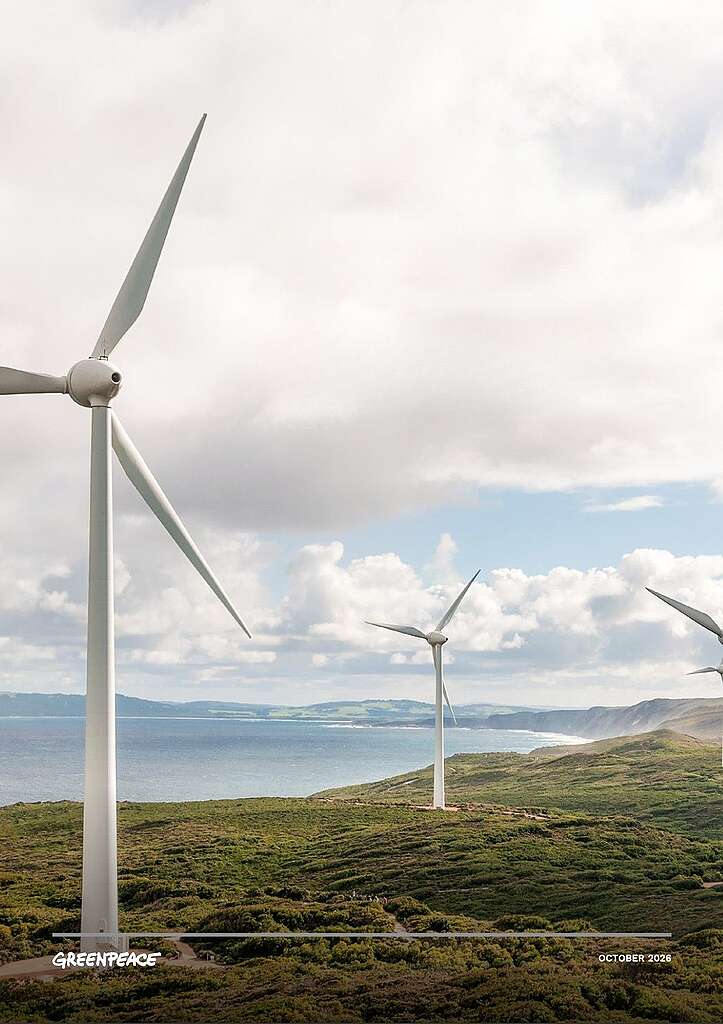
From Gas to Green: Building Western Australia’s Future State is a comprehensive analysis of the declining gas market in Asia, and the untapped economic opportunity for WA to become a global leader in green commodity exports while driving the regional shift away from fossil fuels.
The report offers key recommendations for the WA Government to support regional decarbonisation through an orderly phase out of gas exports in favour of green iron and other green exports. It comes as global climate leaders from across business, politics and advocacy prepare to meet for the Global Citizen Now: Perth event focused on decarbonising WA.
Key findings:
- Gas demand is falling across WA’s core markets in Asia: Gas demand fell in 2025 and is projected to continue to decline, driven by a combination of global geopolitical factors and domestic concerns.
- Policy shifts in key markets since the war on Iran now prioritise renewables and nuclear over gas: Japan, South Korea and China have legislated energy plans that prioritise renewables and nuclear over gas.
- New WA gas would arrive in a saturated, uncertain Asian market filled with cheaper gas: The US is now the world’s largest liquefied gas producer and plans to double its capacity as it also targets Asian markets.
- Green commodities offer a real solution to sustain WA’s economy: WA can lead Australia’s green commodity exports, which by 2060 could be worth almost a trillion dollars.
- Exporting more WA gas is likely to delay or impede Asia decarbonisation: Despite claims by the gas industry, there is no evidence that WA gas is displacing coal in Asia, and in fact diverts resources from genuine decarbonisation options.
Geoff Bice, WA Campaign Lead at Greenpeace Australia Pacific said: “As our export partners in Asia shift away from expensive and polluting gas, the WA Government has a golden opportunity to pivot our economy to green exports, like green iron, which is the most effective way to help our region to decarbonise.
“The writing is on the wall: gas is in decline, renewables are our future. In this context, it makes zero sense for the government to encourage high risk projects like Woodside’s reckless Browse gas proposal at Scott Reef.
“This report clearly shows that the WA Government faces a choice: sink or swim. They can either allow the gas industry to keep ripping off West Australians and continue propping up its decline, or choose the path that will deliver enormous benefits to the state and the world by becoming a leader in the rapidly expanding green economy.”
Tom Quinn, Managing Director of Springmount Advisory: “Western Australia prospers when it looks to the future and builds for future demand. Twenty years from now, what the world needs is green commodities made using WAs abundant renewable resources. Just like it did with iron ore in the 1950s and gas in the 1970s, WA should look to the future and build what the world will need, not sunsetting industries like gas that are already past their peak.”
-ENDS-
Media contact
Kate O’Callaghan on 0406 231 892 or kate.ocallaghan@greenpeace.org
Lucy Keller on 0491 135 308 or lucy.keller@greenpeace.org
A report from Greenpeace Australia Pacific and Springmount Advisory reveals the untapped green economic opportunity for Western Australia in a declining Asian gas market, which also offers a genuine solution for decarbonisation in Asia.
Is Western Australia clinging to a fading gas industry while a thriving green future passes it by? As major Asian trading partners rapidly pivot away from volatile gas imports toward cheap solar and battery storage, this report exposes a high-stakes choice: risk becoming stranded in an oversupplied fossil fuel market, or harness WA’s unmatched sun and wind to lead the global clean energy transition.
Summary
From Gas to Green: Building Western Australia’s Future State reveals that Western Australia (WA) faces a critical juncture as falling Asian gas demand, geopolitical gas supply volatility and accelerating renewable energy deployment undermine the long-term economic viability of gas exports. By harnessing its world-class wind and solar resources, the report demonstrates that WA can execute an orderly phase-out of gas and pioneer a green commodity export economy that could generate $987 billion in economic value by 2060, create 24,000 ongoing jobs, and drive a 9.6% reduction in global greenhouse gas emissions.
Key Findings
- Gas demand is falling in Asia – WA can no longer rely on gas exports: Gas demand in core Asian markets fell in 2025 and is projected to continue to decline in 2026. Legislated energy plans in Japan, South Korea, and China now prioritise renewables and nuclear over gas.
- Asia is increasing renewables, importing gas just gets in the way: Evidence from markets like Thailand suggests that gas imports are increasingly crowding out cheaper renewable energy investments and battery storage rather than displacing coal, locking in more emissions over time.
- Green commodities offer a real solution to decarbonise Asia – this is a major win for WA: With world-class renewables, WA can lead Australia’s green commodity exports, which by 2060 could be worth almost a trillion dollars ($987 billion) and support a genuine 9.6% reduction in global emissions.
Recommendations to WA government
Recommendation 1: Plan an orderly gas phase-out aligned with a trading partner pivot plan
Implement a managed, orderly phase-out of gas exports aligned with trading partners’ decarbonisation pathways, rather than waiting for demand to collapse, by:
- Developing and implementing a staged phase-out of gas facilities aligned with feedstock supply expiry or typical end of facility lifespans.
- Committing to no new gas development for gas expansion, including Browse and Kimberley fields.
- Developing new, reciprocal trade relationships with existing gas trade partners, structured to progressively replace gas exports with green commodities – integrated with recommendation 2.
Recommendation 2: Develop an integrated green commodity export strategy, positioning WA as a global green iron manufacturing hub
Establish an integrated green commodity export strategy that immediately prioritises green iron development, positioning WA as a global green iron manufacturing hub, by:
- Committing to green commodity export targets to give industry and investors a clear demand signal.
- Prioritising green iron as the lead sector within the broader green commodity strategy, given WA’s iron ore endowment and first-mover potential.
Recommendation 3: Reject false solutions such as carbon dumping (CCS) and blue hydrogen
Reject carbon dumping (also described as carbon capture and storage, or CCS) and blue hydrogen as viable decarbonisation technologies, and prioritise green hydrogen and proven renewables for clean energy and fuel production by:
- Excluding blue hydrogen projects (and CCS-dependent projects) from all government support programs.
- Requiring existing hydrogen-based production (including ammonia, methanol, synthetic fuels) to have clear, near-term transition timelines to switch to green hydrogen production.

What you can do
Together, we can push for a prosperous green future.
You can help by:
- Sending an email to Environment Minister Murray Watt and Prime Minister Anthony Albanese, calling on them to reject Browse.
- Sharing this story to help more Australians understand what’s at stake.
- Encouraging your friends and family to take action.
REPORT: “From Gas to Green” Building Western Australia’s Future State
Cleaner cooking projects in the UN carbon market will have to set aside a share of their credits to insure against the risk that the trees they save are lost to fire, drought or logging, after the market’s regulator rejected calls to exempt the sector.
The requirement is part of a new rulebook that the Paris Agreement carbon market regulator – the Article 6.4 Supervisory Body –