
Methane, a potent greenhouse gas, is responsible for about 30% of the global temperature increase observed since the industrial revolution.
China accounts for more than 10% of annual global human methane emissions, in large part due to unintended releases – known as “fugitive” emissions – from its energy sector.
In a recently published study, we take a closer look at China’s coal-mine methane (CMM) emissions, which account for roughly 40% of the nation’s total methane emissions.
Leveraging newly collected, mine-specific data, we develop granular estimates of CMM emissions in China since 2000.
These estimates reveal that China’s coal production is shifting towards provinces with lower-emission mines.
In addition, there has been a significant increase in the capturing of methane from coal mines for energy use.
Together, these developments have helped to limit the rise of CMM emissions, despite an overall increase in coal production since 2016.
Mine data
To estimate CMM emissions at a granular level, we needed to understand how emissions vary from one mine to the next across China.
To do this, we made use of existing safety regulations in China. As methane is a highly flammable gas, the Chinese government enforces mandatory methane gas level identification in coal mines and implements safety regulations accordingly.
Coal mines are categorised based on their “methane emission factors”, the volume of methane emitted per tonne of coal produced.
At one end are low-gas mines, with an emissions factor of less than 10 cubic metres (m3) of methane emitted per tonne of coal. At the other are high-gas mines, at more than 10m3 of methane emitted per tonne. Beyond this are “outburst” mines, which are those that have experienced coal seam or gas outburst incidents.
To get a clearer sense of how much low-gas, high-gas and outburst mines emit in practice, we built a model of the relationship between gas levels and emission factors, using a 2011 database of all Chinese coal mines.
This database includes information on methane gas levels, mine-specific emission factors, coalbed depth, mine ownership and production capacity. We further validated this relationship with newly collected coal mine data from 2023, published by Chinese local governments.
The results show that the distribution of emission factors, as shown in the figure below, varies significantly with gas level.
The top row in the figure below shows the emissions factors for a range of mines in 2011 classed as low-gas (top left, green), high-gas (top centre, pink) or outburst (top right, red). The dashed vertical lines show the central estimate for each type, ranging from 4.1m3 per tonne for low-gas mines through to 19.9m3/tonne for high-gas and 28.4m3/tonne for outburst mines.
The bottom row shows the same metrics based on the more recent 2023 data.
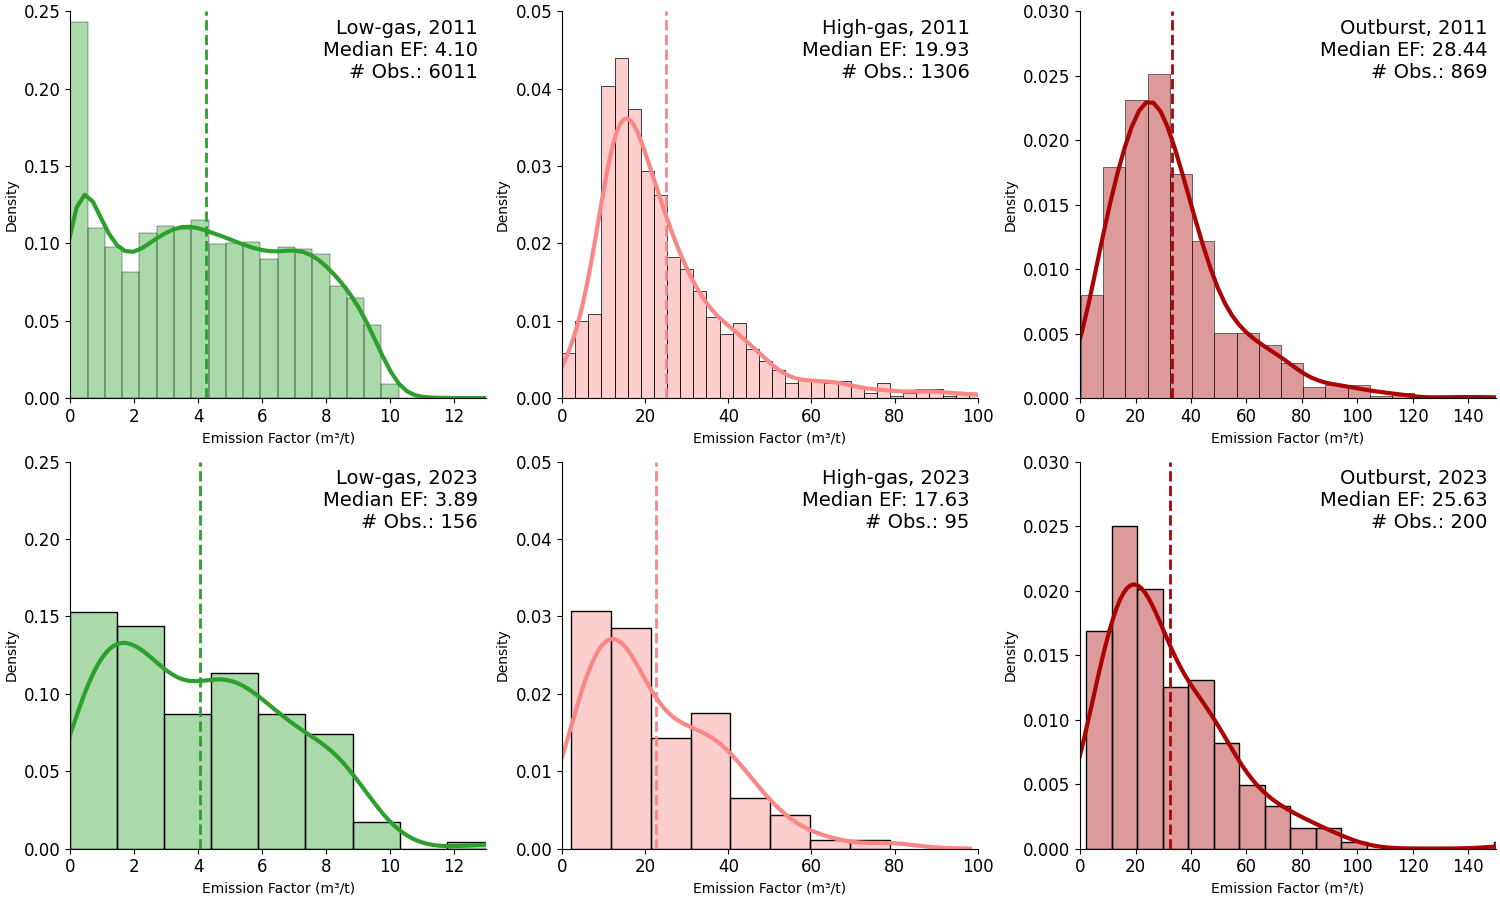
The strong correlation shown in the data above suggests that gas level is a crucial indicator of how much methane a coal mine emits.
In contrast, our analysis reveals no significant correlation between how much a coal mine emits and either coal mine depth or ownership.
Comparing the distributions for the same gas levels between 2011 and 2023 also shows that the link between gas levels and methane emissions remains fairly constant over time.
Therefore, the gas level of a mine can reliably serve as a proxy for its methane emissions per tonne of production, when direct measurements are unavailable.
Provincial shift
To estimate CMM emissions for each province in China, we assumed that the percentage of coal produced by mines of each gas level remains roughly constant as in 2011.
For instance, if 20% of Guizhou’s coal production in 2011 came from low-gas mines, we maintained this percentage for subsequent years.
We then calculated CMM emissions by multiplying provincial-level production-weighted emission factors by total coal production.
The line chart below illustrates our estimated CMM emissions since 2000.
The raw estimates, depicted by the lower grey dashed line, show a rapid increase in CMM emissions from approximately 5m tonnes in 2000 to nearly 21m tonnes in 2013.
This was followed by a decrease to 15m tonnes in 2016 and a subsequent rebound to 24m tonnes in 2023.
The decline between 2013 and 2016 aligns with a period of reduced coal production in China.
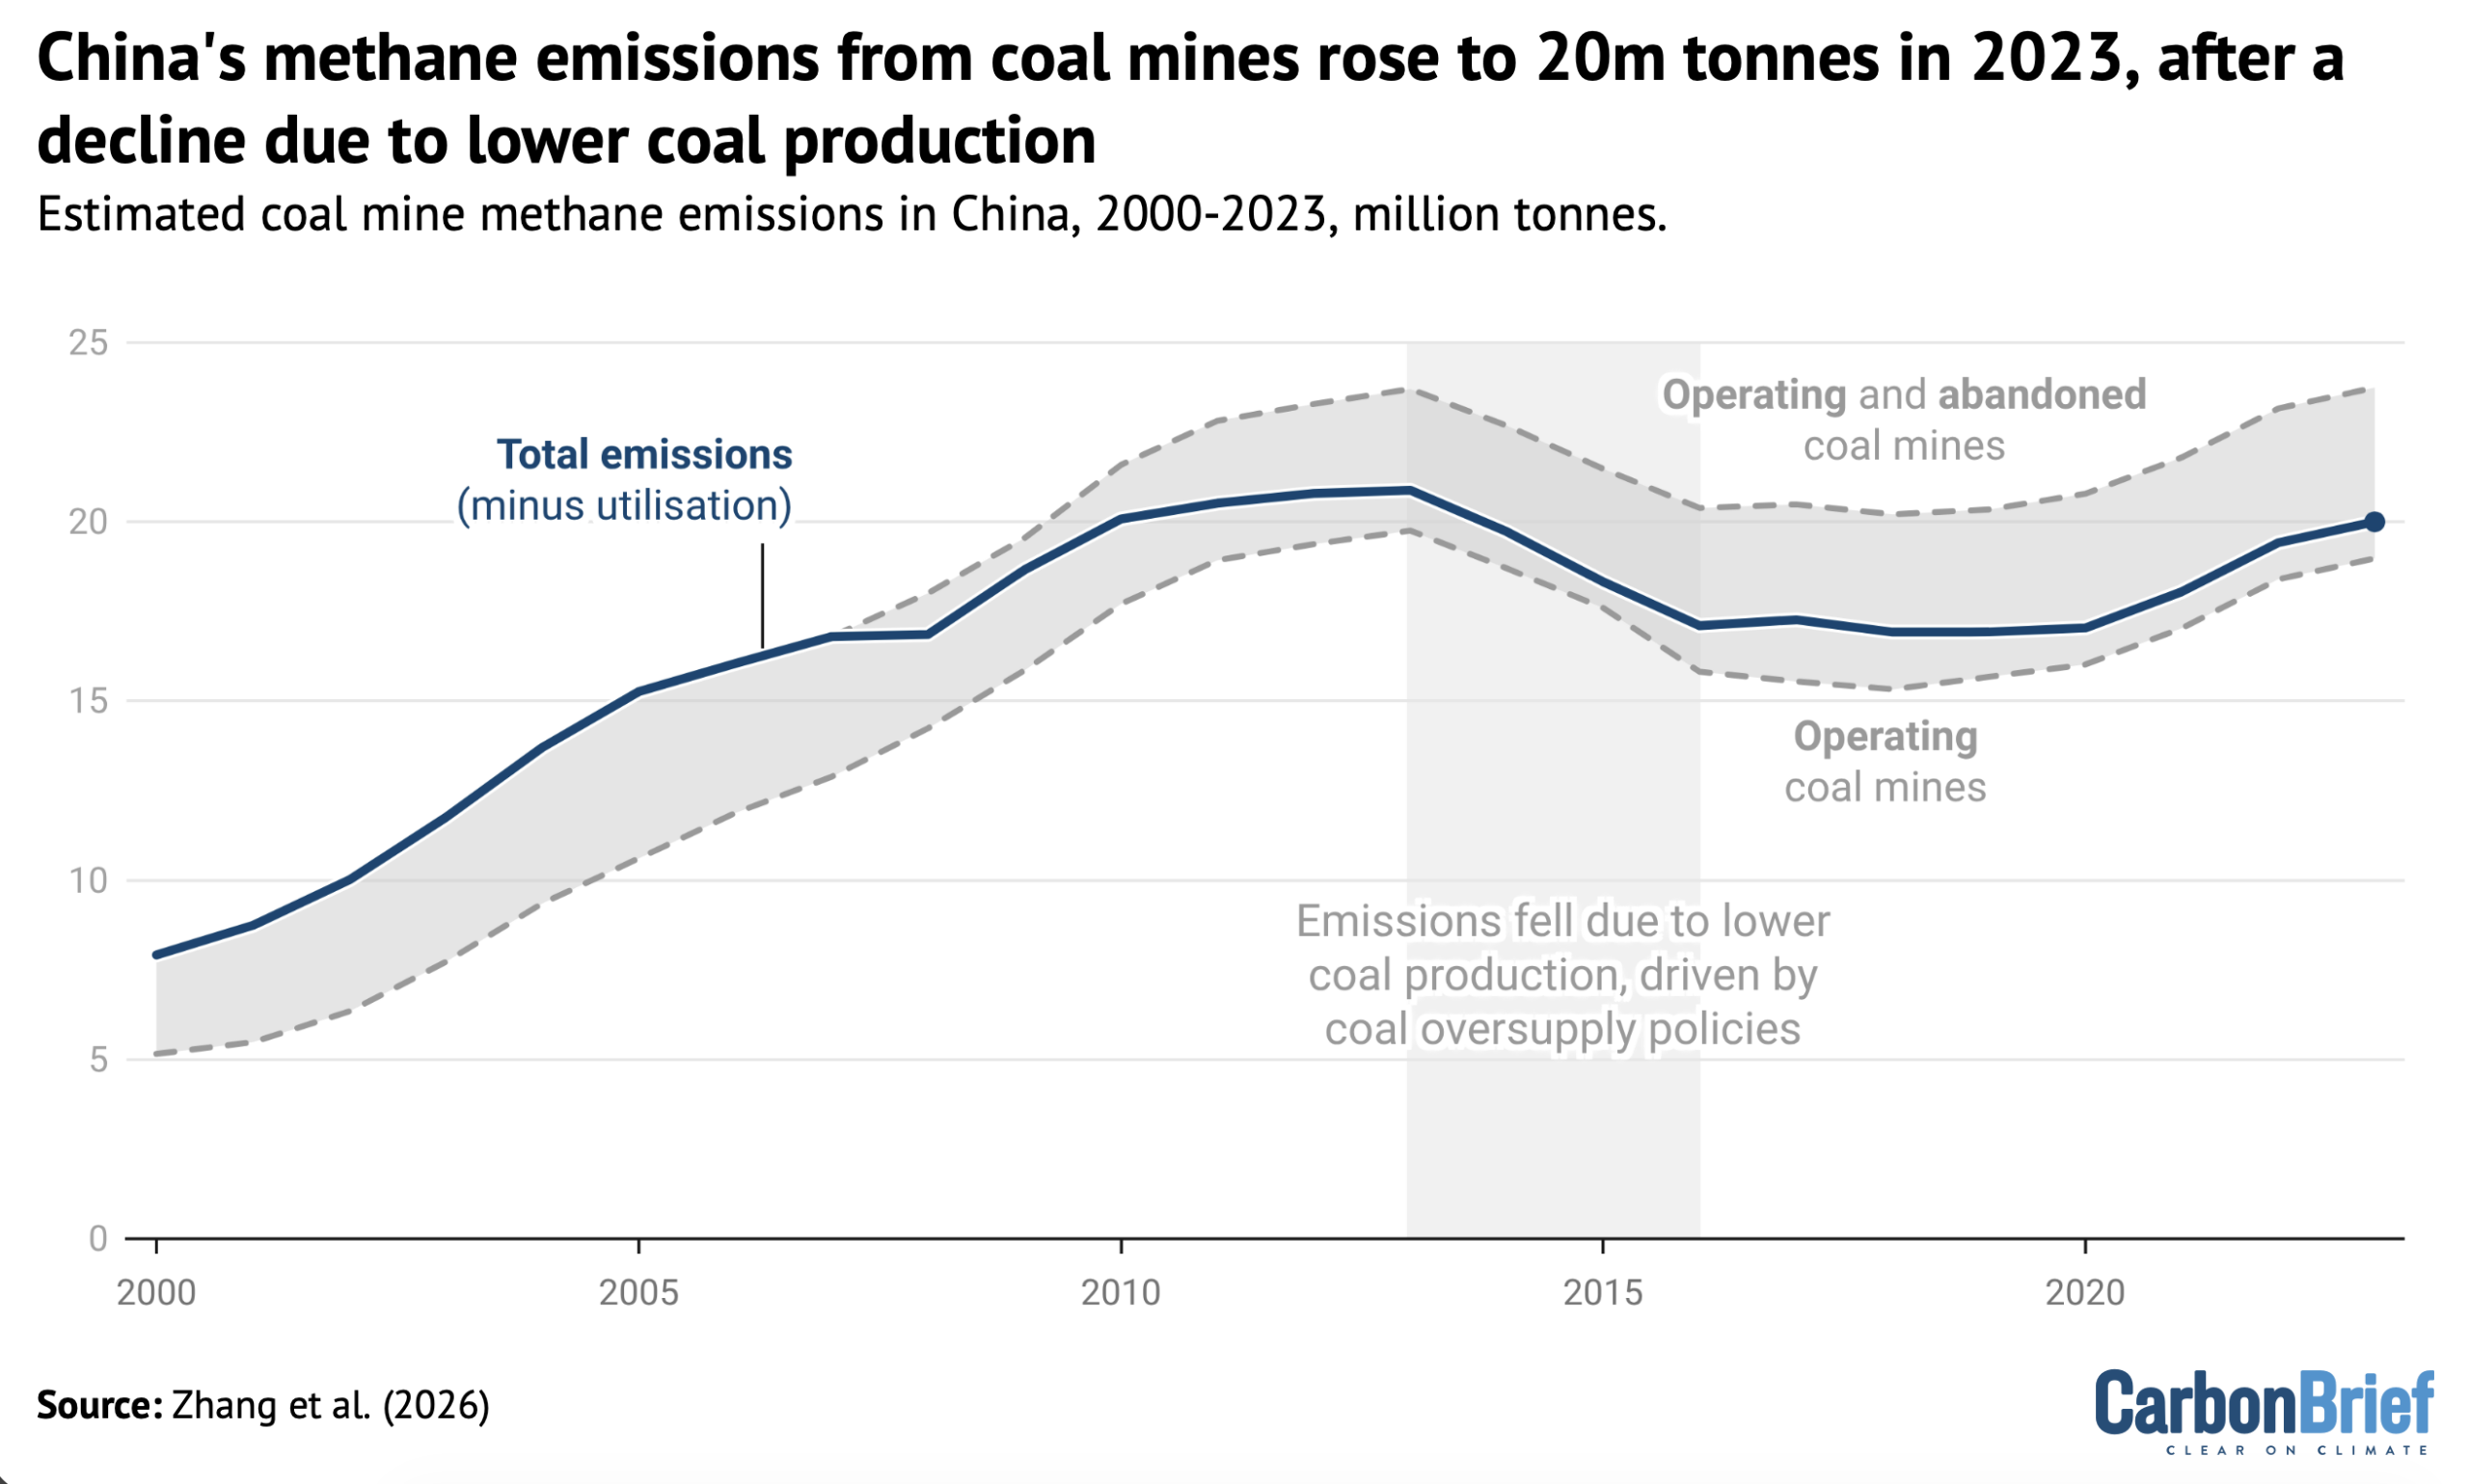
On the chart, the upper grey line represents CMM emissions when abandoned coal mines are included.
These mines, which continue to release methane long after operations cease, were responsible for 4.8m tonnes of methane emissions in 2020, contributing approximately 25% to the total CMM emissions.
Meanwhile, the blue line shows CMM emissions when the capture and use of methane in energy supply is taken into consideration.
National methane utilisation increased from 1.2m tonnes in 2008 to 3.7m tonnes in 2020, resulting in a reduction of total emissions by 5% and 17%, respectively.
It is noteworthy that CMM emissions did not immediately rebound after 2016, despite a reported increase in coal production by China’s National Bureau of Statistics.
This delay can likely be attributed to shifts in production locations to lower-emissions provinces, the closure of high-emissions mines and the adoption of technologies for capturing and using methane that effectively mitigate emissions.
The figure below compares CMM emissions across provinces in 2012 and 2021, two years with nearly identical total coal production levels.
Overall, changes in methane emissions closely mirrored shifts in where the coal was being mined. There is a clear geographic trend: production and emissions surged in northern and north-western regions such as Xinjiang, Shaanxi and especially Shanxi.
In fact, Shanxi alone emitted nearly 8m tonnes of coal-mine methane in 2021, making up roughly half of China’s total CMM emissions.
Meanwhile, both production and emissions dropped in south-western provinces, including Guizhou, Sichuan and Yunnan.
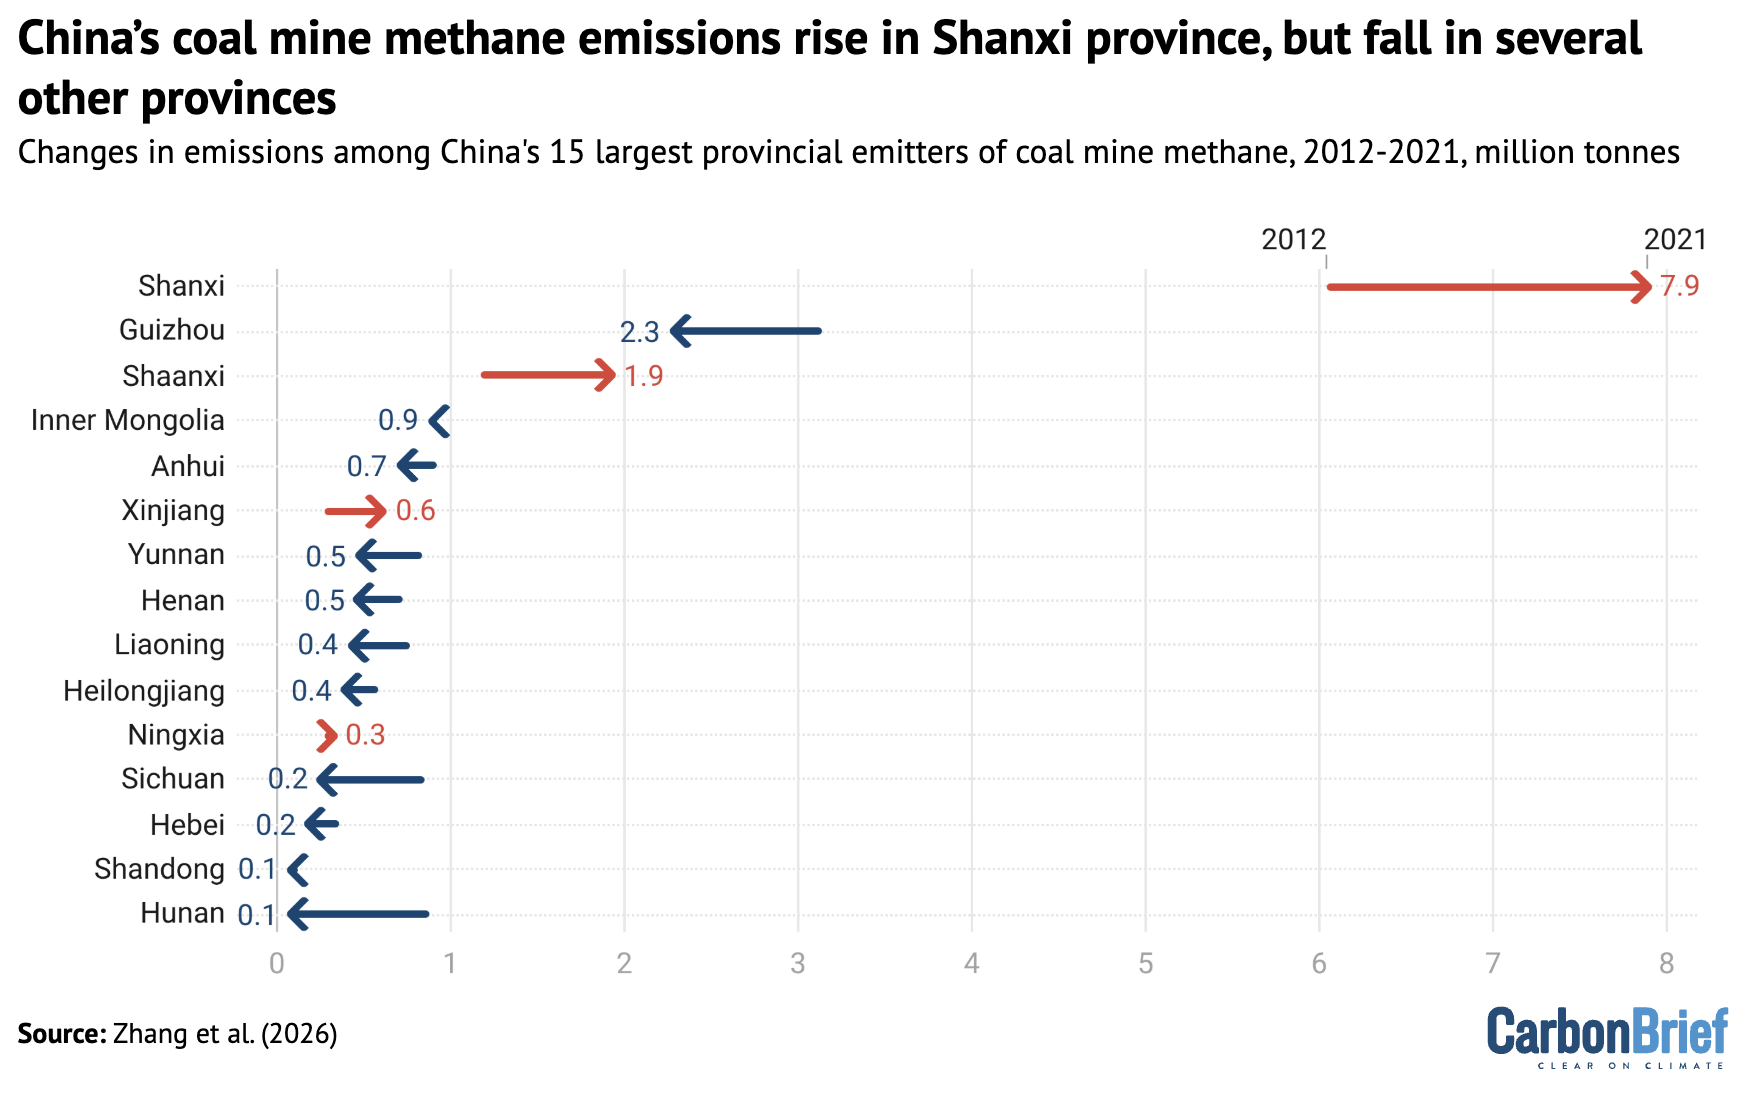
The figure shows that China’s coal production has switched from regions in the south-west where emissions per unit of coal production are relatively high, to lower-emission areas in the north and north-west. At the same time, total production levels have stayed similar, at just over 4bn tonnes in both 2012 and 2021.
Tackling methane
China has signalled its intention to address methane emissions, with key tasks for the next five years outlined in a national methane action plan published in 2023.
The broad trends of CMM emissions observed in this study will likely continue in China.
Small-scale coal mines – those producing less than 300,000 tonnes of coal per year – are at risk of closing or being consolidated, while increased production from large-scale, lower-emission mines in Xinjiang and Inner Mongolia will likely lead to an overall reduction in national production-weighted emission factors.
(This reduction in the rate of emissions per unit of coal production does not guarantee a reduction in methane emissions overall, as several analyses show this also depends on the total coal output. Even following closures, methane may still leak from abandoned mines.)
However, this regional shift in coal production – and, thus, methane emissions – could also help to address public health concerns from pollution associated with the gas.
The Chinese government has also introduced significant changes in policy on the capturing and use of methane gas. The Ministry of Ecology and Environment recently revised coal-mine methane standardsto mandate the capture and use of methane with concentrations above 8%, down from a previous 30%.
In addition, the government has a programme providing financial incentives for capturing methane and reducing CMM emissions.
Together, these measures could help China achieve its short- and medium-run methane capture and use goals set by the methane action plan.

The post Guest post: How changes to coal mining have affected China’s methane emissions appeared first on Carbon Brief.
Guest post: How changes to coal mining have affected China’s methane emissions
With the U.S. bombing Iran and the Strait of Hormuz closed, energy experts say countries transitioning to renewables will be more resilient in the “face of the shock.”
The United States’ war on Iran could fundamentally alter how countries consume and generate energy and hamper international progress in combating climate change, a panel of energy experts said today.
The Global Energy Supply in a Decade ‘Is Not a World We’re Going to Recognize’
One month into the US and Israel’s war on Iran, at least 60 countries have taken emergency measures in response to the subsequent global energy crisis, according to analysis by Carbon Brief.
So far, these countries have announced nearly 200 policies to save fuel, support consumers and boost domestic energy supplies.
Carbon Brief has drawn on tracking by the International Energy Agency (IEA) and other sources to assess the global policy response, just as a temporary ceasefire is declared.
Since the start of the war in late February, both sides have bombed vital energy infrastructure across the region as Iran has blocked the Strait of Hormuz – a key waterway through which around a fifth of global oil and liquified natural gas (LNG) trade passes.
This has made it impossible to export the usual volumes of fossil fuels from the region and, as a result, sent prices soaring.
Around 30 nations, from Norway to Zambia, have cut fuel taxes to help people struggling with rising costs, making this by far the most common domestic policy response to the crisis.
Some countries have stressed the need to boost domestic renewable-energy construction, while others – including Japan, Italy and South Korea – have opted to lean more on coal, at least in the short term.
The most wide-ranging responses have been in Asia, where countries that rely heavily on fossil fuels from the Middle East have implemented driving bans, fuel rationing and school closures in order to reduce demand.
‘Largest disruption’
On 28 February, the US and Israel launched a surprise attack on Iran, triggering conflict across the Middle East and sending shockwaves around the world.
There have been numerous assaults on energy infrastructure, including an Iranian attack on the world’s largest LNG facility in Qatar and an Israeli bombing of Iran’s gas sites.
Iran’s blockade of the Strait of Hormuz, a chokepoint in the Persian Gulf, is causing what the IEA has called the “largest supply disruption in the history of the global oil market”.
A fifth of the world’s oil and LNG is normally shipped through this region, with 90% of those supplies going to destinations in Asia. Without these supplies, fuel prices have surged.
Governments around the world have taken emergency actions in response to this new energy crisis, shielding their citizens from price spikes, conserving energy where possible and considering longer-term energy policies.
Even with a two-week ceasefire announced, the energy crisis is expected to continue, given the extensive damage to infrastructure and continuing uncertainties.
Asian crunch
Carbon Brief has used tracking by the IEA, news reports, government announcements and internal monitoring by the thinktank E3G to assess the range of national responses to the energy crisis roughly one month into the Iran war.
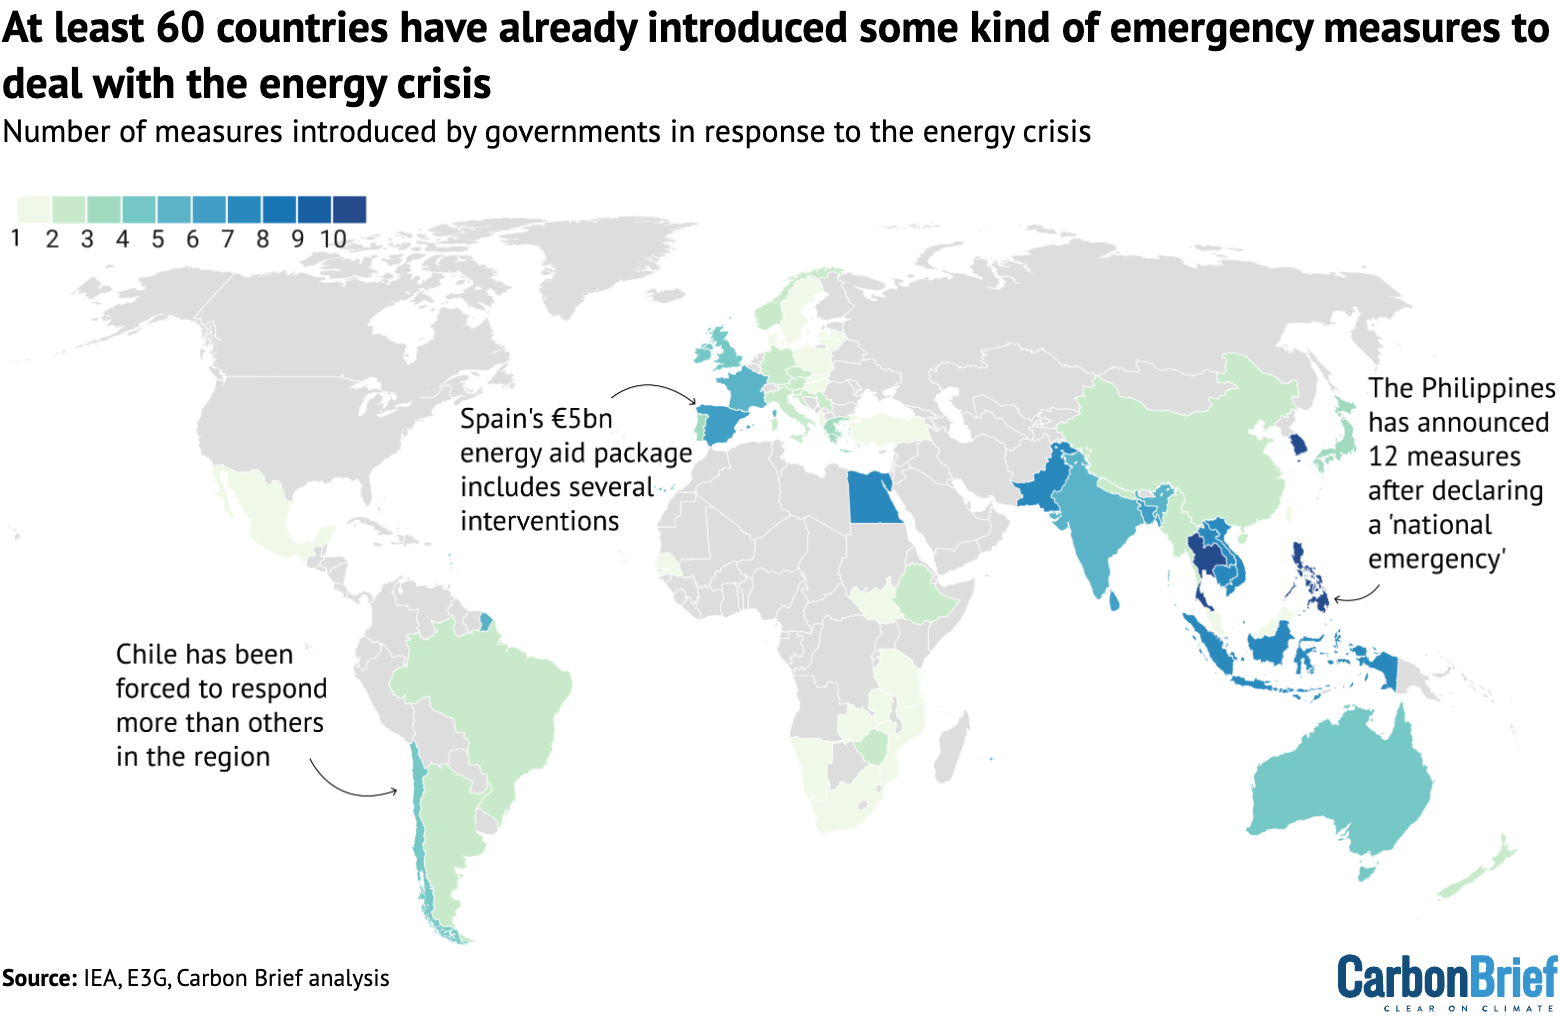
In total, Carbon Brief has identified 185 relevant policies, announcements and campaigns from 60 national governments.
As the map below shows, these measures are concentrated in east and south Asia. These regions are facing the most extreme disruption, largely due to their reliance on oil and gas supplies from the Middle East.
Nations including Indonesia, Japan, South Korea and India are already spending billions of dollars on fuel subsidies to protect people from rising costs.
At least 16 Asian countries are also taking drastic measures to reduce fuel consumption. For example, the Philippines has declared a “state of national emergency”, which includes limiting air conditioning in public buildings and subsidising public transport.
Other examples from the region include the government in Bangladesh asking the public and businesses to avoid unnecessary lighting, Pakistan reducing the speed limit on highways and Laos encouraging people to work from home.
Europe – which was hit hard by the 2022 energy crisis due to its reliance on Russian gas – is less immediately exposed to the current crisis than Asia. However, many nations are still heavily reliant on gas, including supplies from Qatar.
The continent is already feeling the effects of higher global energy prices as countries compete for more limited resources.
At least 18 European nations have introduced measures to help people with rising costs. Spain, which is relatively insulated from the crisis due to the high share of renewables in its electricity supply, nevertheless announced a €5bn aid package, with at least six measures to support consumers.
Many African countries, while also less reliant on direct fossil-fuel supplies via the Strait of Hormuz than Asia, are still facing the strain of higher import bills. Some, including Ethiopia, Kenya and Zambia, are also facing severe fuel shortages.
There have been fewer new policies across the Americas, which have been comparatively insulated from the energy crisis so far. One outlier is Chile, which is among the region’s biggest fuel importers and is, therefore, more exposed to global price increases.
Tax cuts
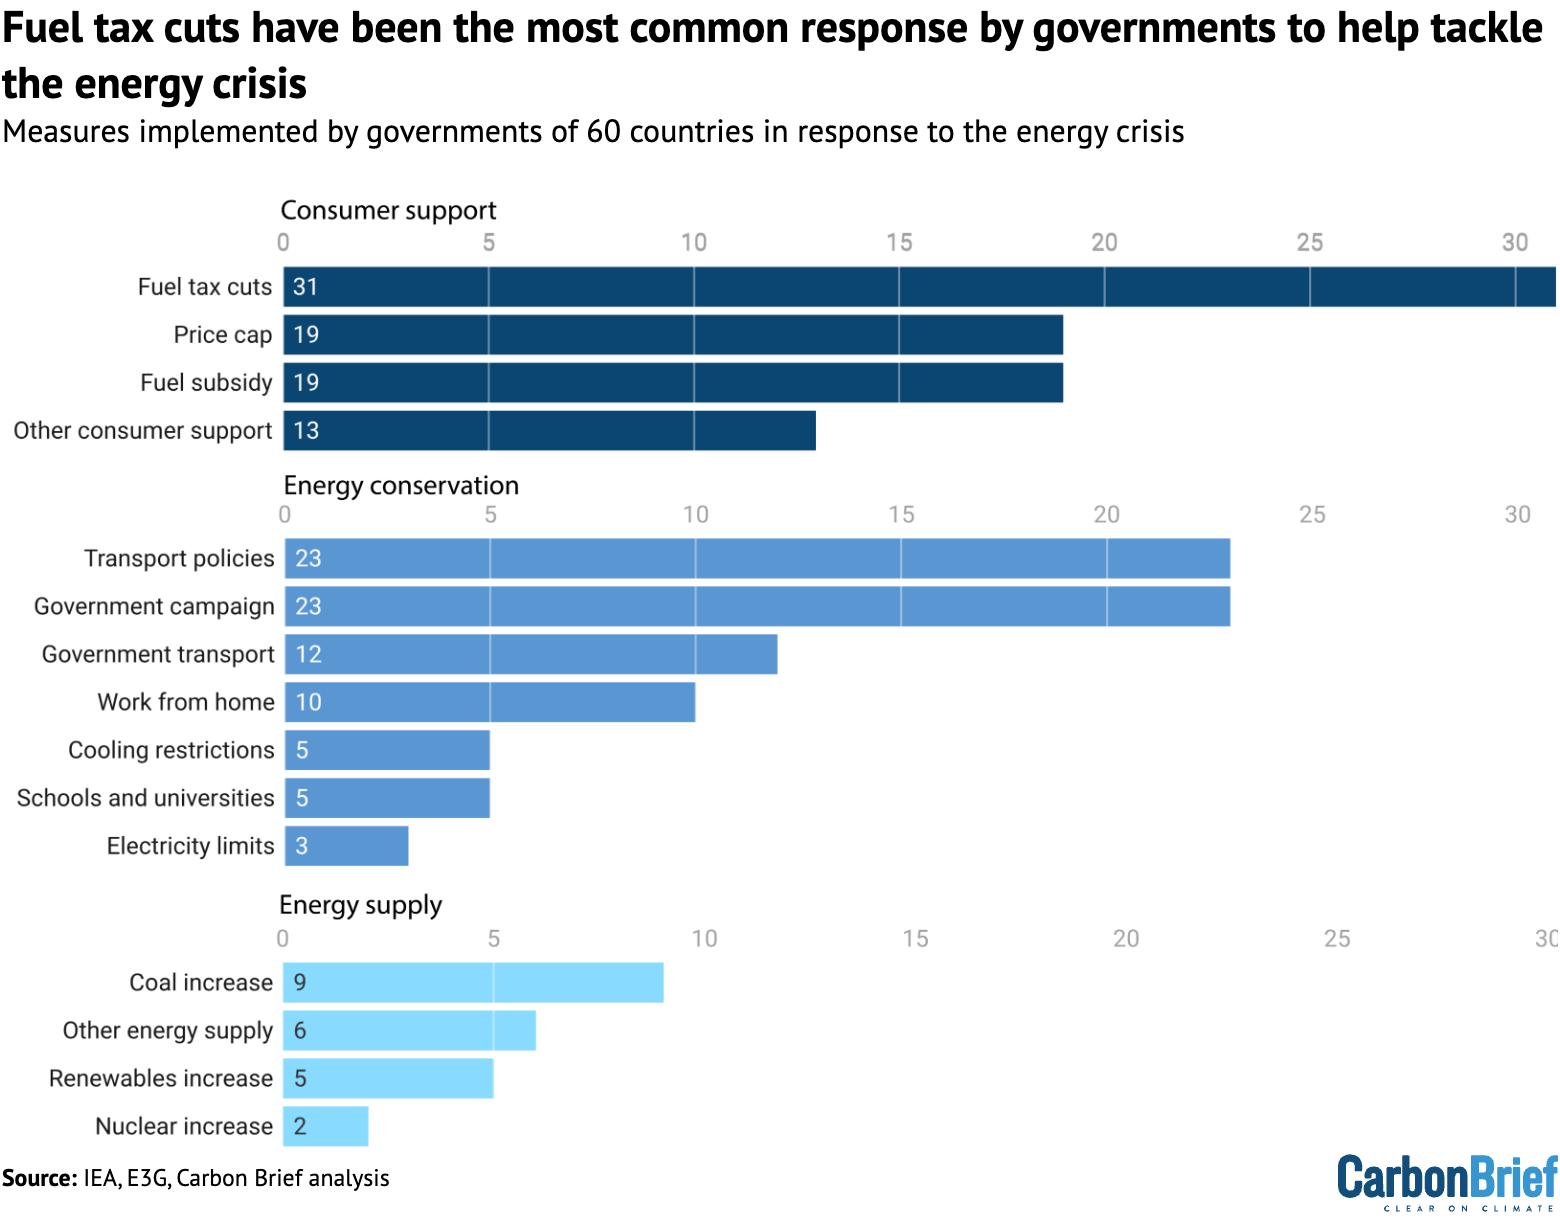
The most common types of policy response to the energy crisis so far have been efforts to protect people and businesses from the surge in fuel prices.
At least 28 nations, including Italy, Brazil and Australia, have introduced a total of 31 measures to cut taxes – and, therefore, prices – on fuel.
Even across Africa, where state revenues are already stretched, some nations – including Namibia and South Africa – are cutting fuel levies in a bid to stabilise prices.
Another 17 countries, including Mexico and Poland, have directly capped the price of fuel. Others, such as France and the UK, have opted for more targeted fuel subsidies, designed to support specific vulnerable groups and industries.
These measures are all shown in the dark blue “consumer support” bars in the chart below.
Such measures can directly help consumers, but some leaders, NGOs and financial experts have noted that there is also the risk of them driving inflation and reinforcing reliance on the existing fossil fuel-based system.
Christine Lagarde, president of the European Central Bank, spoke in favour of short-term measures to “smooth the shock”, but noted that “broad-based and open-ended measures may add excessively to demand”.
Measures to conserve energy, of the type that many developing countries in Asia have implemented extensively, have been described by the IEA as “more effective and fiscally sustainable than broad-based subsidies”.
So far, there have been at least 23 such measures introduced to limit the use of transport, particularly private cars.
These include Lithuania cutting train fares, two Australian states making public transport free and Myanmar and South Korea asking people to only drive their cars on certain days.
Clean vs coal
At least eight countries have announced plans to either increase their use of coal or review existing plans to transition away from coal, according to Carbon Brief’s analysis. These include Japan, South Korea, Bangladesh, the Philippines, Thailand, Pakistan, Germany and Italy.
These measures broadly involve delaying coal-plant closure, as in Italy, or allowing older sites to operate at higher rates, as in Japan – rather than building more coal plants.
There has been extensive coverage of how the energy crisis is “driving Asia back to coal”. However, as Bloomberg columnist David Fickling has noted, this shift is relatively small and likely to be offset by a move to cheap solar power in the longer term.
Indeed, some countries have begun to consider changes to the way they use energy going forward, amid a crisis driven by the spiralling costs of fossil-fuel imports.
Leaders in India, Barbados and the UK have explicitly stressed the importance of a structural shift to using clean power. Governments in France and the Philippines are among those linking new renewable-energy announcements with the unfolding crisis.
New renewable-energy capacity will take time to come online, albeit substantially less time than developing new fossil-fuel generation. In the meantime, some nations are also taking short-term measures to make their road transport less reliant on fossil fuels.
For example, the Chilean government has enabled taxi drivers to access preferential credit for purchasing electric vehicles (EVs). Cambodia has cut import taxes on EVs and Laos has lowered excise taxes on them.
Finally, there have been some signs that countries are reconsidering their future exposure to imported fossil fuels, given the current economics of oil and gas.
The New Zealand government has indicated that a plan to build a new LNG terminal by 2027 now faces uncertainty. Reuters reported that Vietnamese conglomerate Vingroup has told the government it wanted to abandon a plan to build a new LNG-fired power plant in Vietnam, in favour of renewables.


The post Iran war analysis: How 60 nations have responded to the global energy crisis appeared first on Carbon Brief.
Iran war analysis: How 60 nations have responded to the global energy crisis
Seven Senate Democrats launched the probe over controversial tax credits to the country’s largest exporter of liquefied natural gas.
Seven Democratic U.S. senators have launched a probe into a $370 million “alternative fuel” payout to Cheniere Energy, made earlier this year by the IRS, that critics say the liquefied natural gas export company never should have received.
US Senators Investigate $370 Million IRS Payout to Cheniere Energy


-
Climate Change8 months ago
Guest post: Why China is still building new coal – and when it might stop
-
Greenhouse Gases8 months ago
Guest post: Why China is still building new coal – and when it might stop
-

 Greenhouse Gases2 years ago
嘉宾来稿:满足中国增长的用电需求 光伏加储能“比新建煤电更实惠”
-
Climate Change2 years ago
Bill Discounting Climate Change in Florida’s Energy Policy Awaits DeSantis’ Approval
-

 Climate Change2 years ago
嘉宾来稿:满足中国增长的用电需求 光伏加储能“比新建煤电更实惠”
-
Climate Change Videos2 years ago
The toxic gas flares fuelling Nigeria’s climate change – BBC News
-

 Renewable Energy6 months ago
Sending Progressive Philanthropist George Soros to Prison?
-

 Carbon Footprint2 years ago
US SEC’s Climate Disclosure Rules Spur Renewed Interest in Carbon Credits