
Once again, the Southern Alliance for Clean Energy (SACE) has teamed up with Atlas Public Policy to crunch the data and provide factual snapshots of the Southeast region’s continued growth trends in EV manufacturing investments, anticipated jobs, sales, charging infrastructure deployment, utility investment and public funding. Our year-end update to the fifth annual “Transportation Electrification in the Southeast” report brings the data underlying the EV market in our six-state region up to date through December 2024.
What the data reveals may surprise you.
Read the October 2024 Report View the Updated Regional & State Pages
Jobs and Investments
The Southeast continues to lead the nation in EV and battery-related jobs and private-sector investments. As of the end of 2024, updated data from the fifth annual “Transportation Electrification in the Southeast” report found that our region is home to a whopping 38% of the nation’s $215 billion in announced private-sector EV and battery investments and 31% of the anticipated 238,000 jobs. Georgia remains #1 in anticipated jobs and committed investments, with North Carolina a close second.
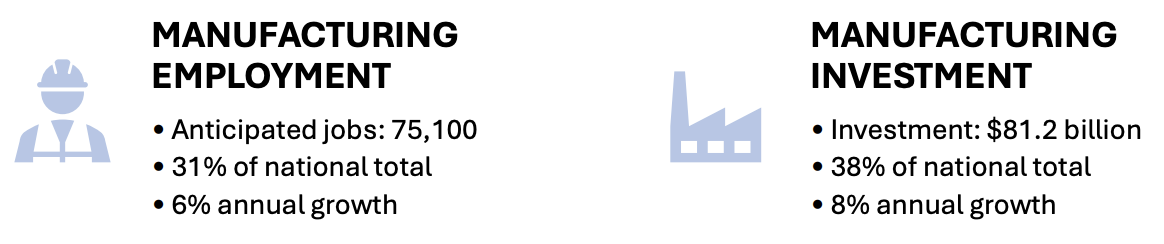
These investments deliver economic development and employment to our region’s rural communities. Toyota’s $13.9 billion battery manufacturing facility in Randolph County, North Carolina, is at the top of the rural economic development list. The facility is expected to create 5,100 jobs and is the nation’s highest clean energy investment. Hyundai has made the second-largest regional investment at its battery manufacturing and EV assembly plant in Bryan County, Georgia. That investment tops $6 billion and is expected to create 3,400 jobs. It has had a massive ripple effect, with Hyundai suppliers announcing more than $2.7 billion in investments and an anticipated 6,900 jobs across the state.
EV Sales and Charging Infrastructure
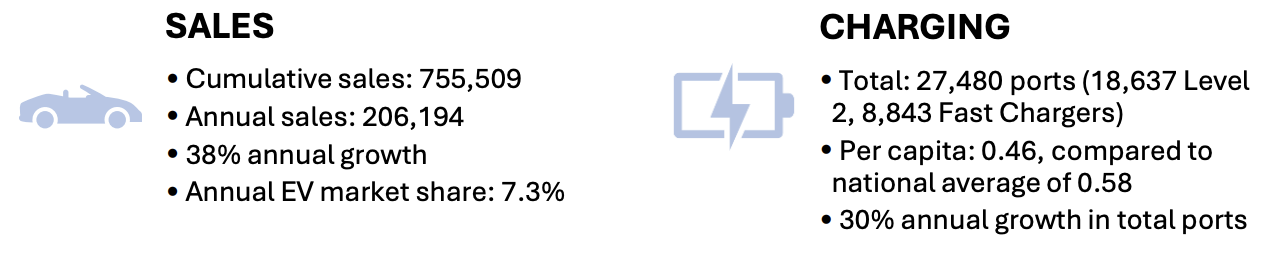
Southeast light-duty EV sales grew by 38% from January 2024 through December 2024, outpacing the national year-over-year average growth rate for the first time. Florida is #1 in the region in EV sales growth, at 42%, and for EV market share, at 9%. The Sunshine State is now hovering just below the national EV market share average, which peaked above 10% in 2024, setting a market record.
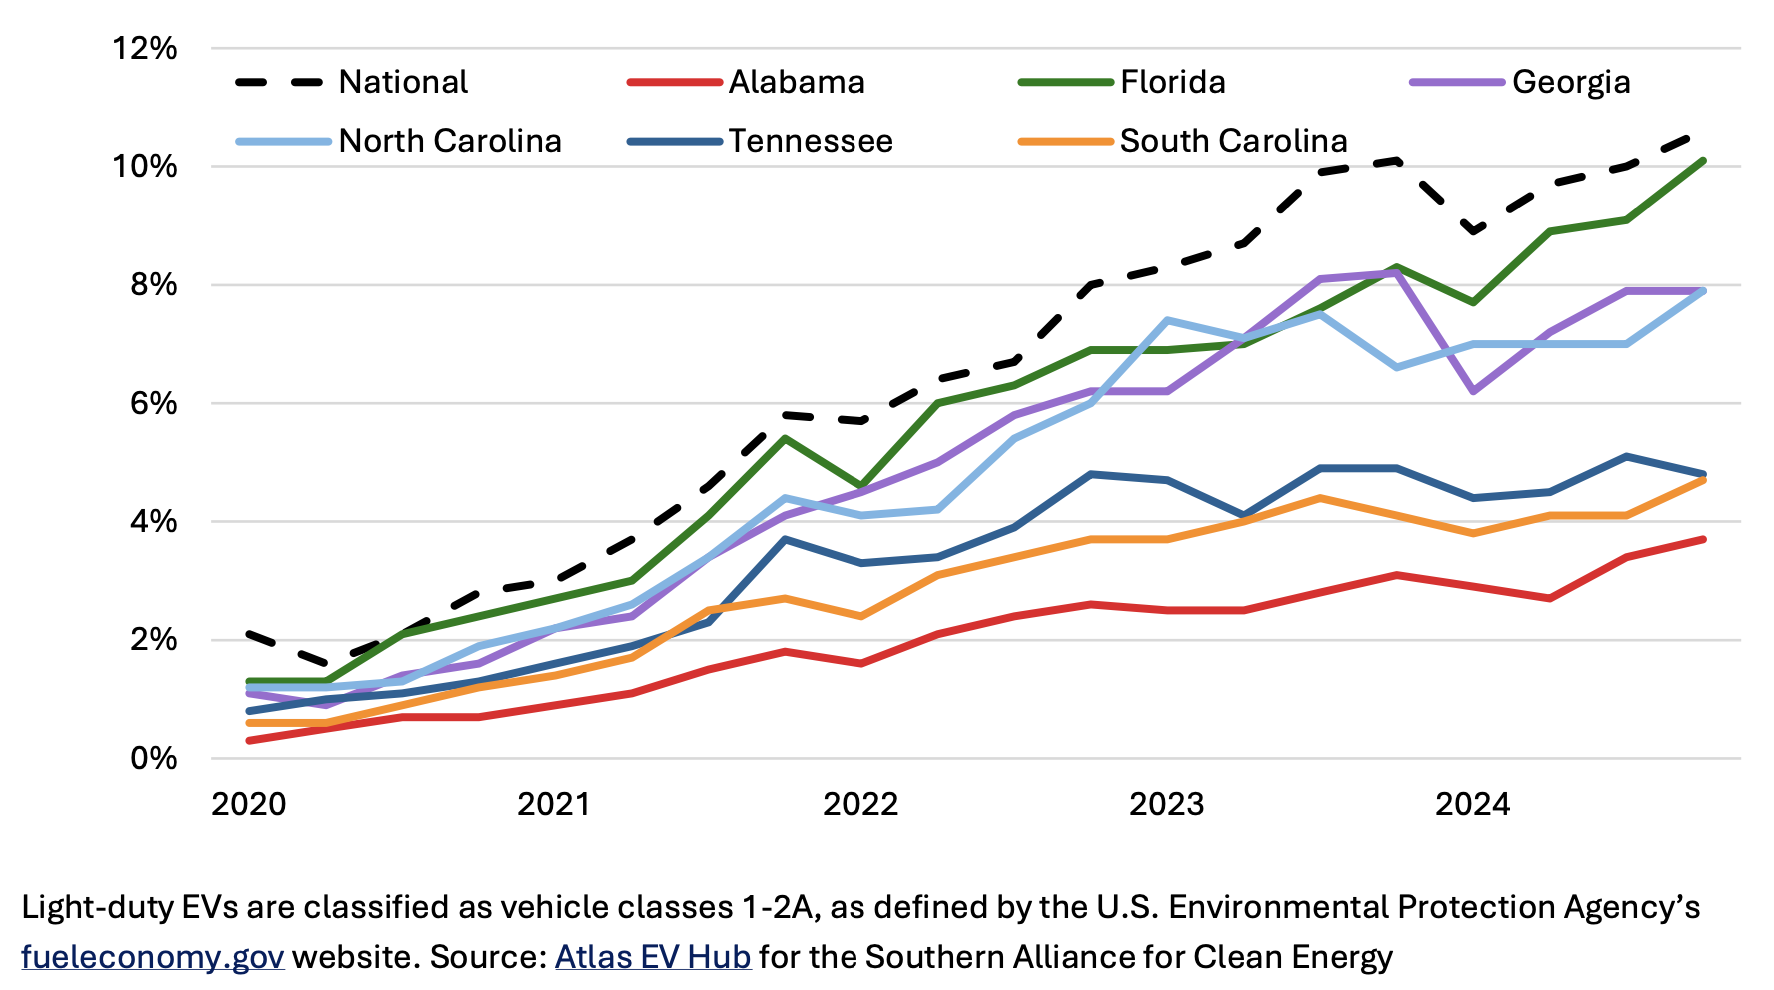
 The region has become divided between two groups. Florida, Georgia, and North Carolina are enjoying strong EV sales and market share growth; while Tennessee, South Carolina, and Alabama continue to lag far behind. The reasons for this divide are not clear, but one trend is apparent: EV growth is self-reinforcing – the more EVs in a market, the more EVs are likely to be purchased. This is because when consumers see EVs on the road and talk to EV-driving family members, friends, and neighbors; and commercial fleet operators see their peers electrifying, they become more familiar with the technology and more likely to consider purchasing their own.
 New EV Sales Market Share for Light-Duty Vehicles in the Southeast
Meanwhile, Southeastern states, local governments, investor-owned utilities (IOUs), and EV charging companies are continuing to do their respective parts to enable the steady deployment of public charging infrastructure. Though 80% of EV charging happens conveniently and affordably at home at night while EV drivers sleep, public charging is critical for supporting long-distance travel, providing EV-driving tourists charging at their destinations, serving local drivers on those days when an extra boost is needed, and supplementing the lack of residential charging at multi-family dwellings. Georgia is #1 in the region in terms of the number of public EV chargers per capita.
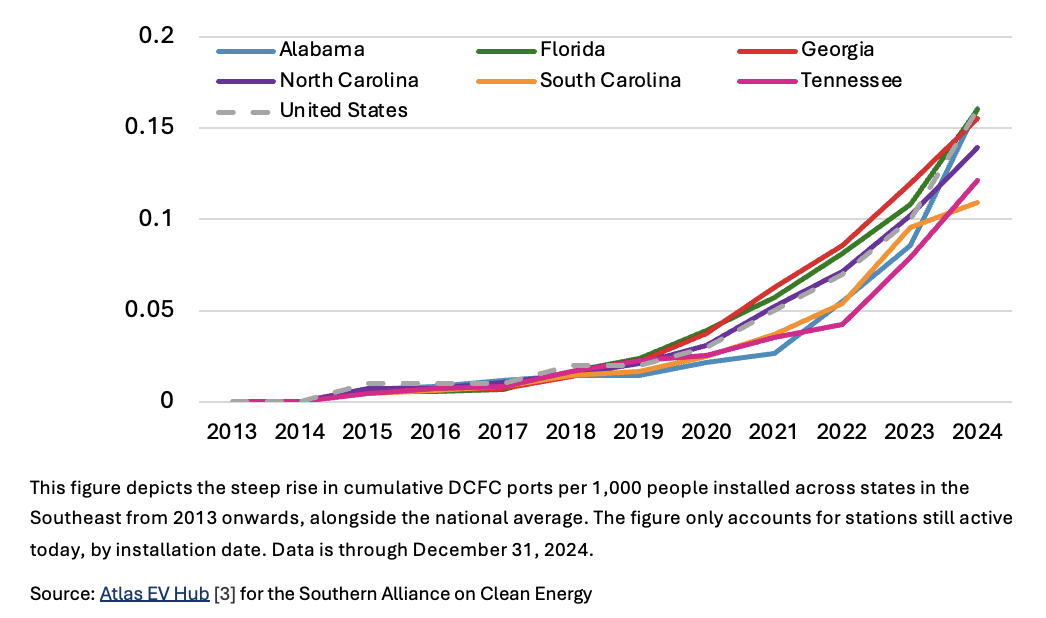
Florida, Georgia, and North Carolina have historically topped the region in per-capita deployment for fast charging to support long-distance travel, on-route fleet vehicle charging, and EV rideshare drivers. But the second half of 2024, Alabama added 300 fast chargers to move ahead of North Carolina and above the national average for fast charging per capita. EV charging deployment and EV market growth go hand in hand, each benefiting the other. So, it is unsurprising that states like Georgia and Florida, which lead regional EV market share, also lead in charging infrastructure deployment; however, Alabama, which ranks last in EV market share, is a fast charging deployment surprise.
Cumulative DCFC Ports per 1,000 People in the Southeast
Utility Investment and Public Funding
Our region’s IOUs have invested $435.5 million in EV infrastructure through 2024. Although that sounds like a lot of money, it only represents approximately 6% of the nation’s IOU investments, despite the Southeast making up about 18% of the nation’s total population. Two things drive this underinvestment: 1) utilities are not proposing EV programs at the scale, choosing instead to propose small pilot programs; and 2) when utilities propose more significant investments, regulators have often required the utilities to scale back their efforts. The result is that on a per capita basis, all of the Southeast’s IOUs are below the national average of $38 per customer in approved EV investments. Only Duke Energy Florida and Florida Power and Light are close at $36 per customer, which is why Florida is #1 in utility investment.
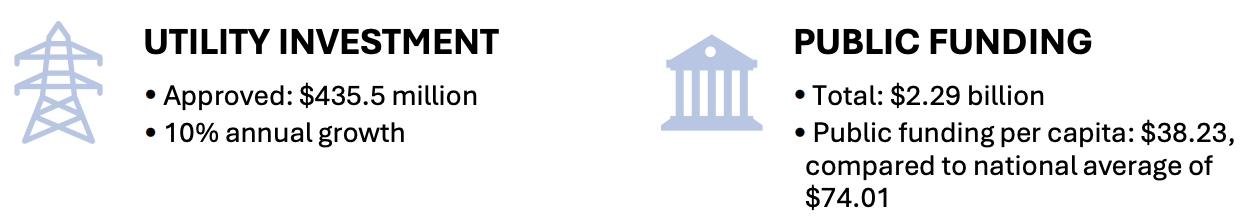
Public funding is another source of capital that supports the EV market. In the Southeast, the overwhelming majority of public EV funding comes from the federal government, with states appropriating next to none of their own taxpayer dollars. No state in the region has done a better job drawing down federal funding than South Carolina, which is #1 in public funding because the state has drawn down $44.32 per capita in federal electric transportation funding, approximately 12% higher than the national average. However, when looking at combined public funding from state and federal sources, the Southeast, at an average of $38.23 per capita, is way behind the national average of $74.01.
Southeast states’ unwillingness to commit state-appropriate funding creates a reliance on the federal government’s support of the emerging EV market. Hence, the new political uncertainty surrounding whether the federal government will honor already committed funds to states to electrify school and transit buses, deploy fast charging along highway corridors, allow government fleets to take advantage of vehicle and infrastructure tax credits, reimburse already committed grants, etc., will disproportionately impact Southeast states’ ability to support EV market growth. To what degree remains unclear, but in the Southeast, this uncertainty is particularly problematic given that the investments and jobs described above depend on a strong EV market to succeed; without a strong demand for EVs, there is the risk that companies could shutter existing EV and battery plants and halt new plant construction, leaving workers without jobs.
What to expect in 2025
So far, the EV market remains strong moving into 2025. After a record-setting December, January EV sales were up over 30% year over year, topping 100,000 units sold for the tenth consecutive month. The rapidly expanding used EV market also grew over 30% year over year, with nearly 27,000 used vehicles sold in January.
The hot used EV market is worth watching for three reasons: 1) the used car market accounts for two-thirds of all the vehicles consumers purchase; 2) used EVs are as affordable as their gas-car counterparts; 3) most new EVs purchased have been leased, which will result in over 1 million EVs coming off lease and into the used market over the next two years. These three factors will enable a new and broader demographic of consumers to enter the EV market and experience the low operating costs and high-performance benefits of EV ownership.
With approximately 45% of car shoppers considering buying an EV and EV shopper demographics becoming more mainstream, 2025 is set to be the year consumer desire collides with political turbulence and rampant misinformation. But uncertainty looms, and questions remain about whether the legal battles against the federal government’s attempt to claw back electric transportation and clean energy funding will prevail; how tariffs and the threat of tariffs impact the auto sector, vehicle prices and investments in EV manufacturing; whether new and EV tax credits will remain available for consumers and commercial fleets; and whether growing consumer demand for EVs will cool.
It will be a telling year for the trajectory of the EV market. Buckle up and stay tuned.
The post Despite Political Headwinds, The Southeast EV Market Accelerates into 2025 appeared first on SACE | Southern Alliance for Clean Energy.
Despite Political Headwinds, The Southeast EV Market Accelerates into 2025
 I see.
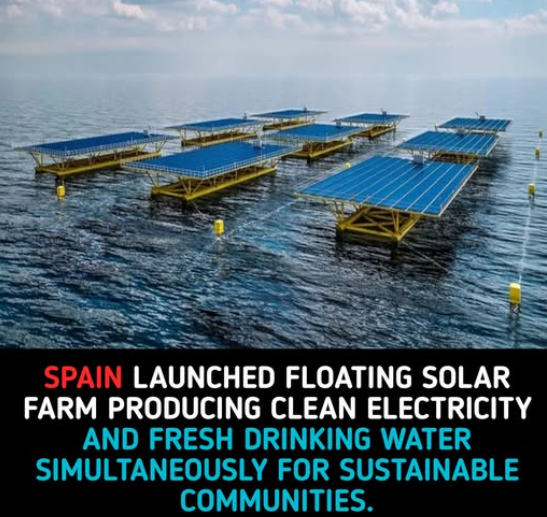
There’s not enough land in Spain to support rooftop and ground-mounted solar at a fraction of the cost.
LOL.
 It’s possible that right now, there are other civilizations observing the human race, studying us from afar, and noticing our decline into savagery and eventual extinction by turning billionaires into trillionaires.
People say that the principal weakness of human beings is that we can’t plan for the future as a species. Dogs are arguably even worse, though they aren’t consumed with greed. They don’t plot the starvation of millions of other dogs so they themselves can have enough food to last a billion years.
As an elderly man, I’ll be leaving this planet soon, but I won’t cease pondering this until my heart stops beating.
 The drawing here reminds me of a conversation I had with my mother in the early days of 2GreenEnergy when she saw that my focus had become an ongoing effort to improve the wellbeing of all the planet’s inhabitants–now and into the future.
She asked me, “Why don’t you just live your life?”
I explained, “This is my life.”

-
Climate Change10 months ago
Guest post: Why China is still building new coal – and when it might stop
-
Greenhouse Gases10 months ago
Guest post: Why China is still building new coal – and when it might stop
-

 Greenhouse Gases2 years ago
嘉宾来稿:满足中国增长的用电需求 光伏加储能“比新建煤电更实惠”
-

 Climate Change2 years ago
嘉宾来稿:满足中国增长的用电需求 光伏加储能“比新建煤电更实惠”
-
Climate Change2 years ago
Bill Discounting Climate Change in Florida’s Energy Policy Awaits DeSantis’ Approval
-

 Renewable Energy8 months ago
Sending Progressive Philanthropist George Soros to Prison?
-

 Carbon Footprint2 years ago
US SEC’s Climate Disclosure Rules Spur Renewed Interest in Carbon Credits
-
Greenhouse Gases11 months ago
嘉宾来稿:探究火山喷发如何影响气候预测