
Welcome to Carbon Brief’s Cropped.
We handpick and explain the most important stories at the intersection of climate, land, food and nature over the past fortnight.
This is an online version of Carbon Brief’s fortnightly Cropped email newsletter. Subscribe for free here.
Key developments
Amazon feels the heat
DOLPHIN DEATHS: More than 150 endangered pink river dolphins have washed up in recent days in the Brazilian Amazon, the Washington Post reported. It said: “The cause is unknown, but scientists say the likeliest culprit is extreme heat and drought, possibly linked to climate change and the El Niño phenomenon.” Water temperatures in a lake in the Amazonas state reached 39C recently, possibly leaving dolphins “disoriented”, a scientist told the publication. “The loss of oxygen triggers an increase in their cell metabolism, and they die of asphyxia [complete loss of oxygen],” it added.
CLIMATE’S ROLE: The deaths come during an extended period of unusual heat across several South American countries. A new analysis from climate scientists at the World Weather Attribution group released this week found that extreme September temperatures in Brazil and Paraguay were made at least 100 times more likely by human-caused climate change. It added that the temperatures were 1.4-4.3C hotter than they would have been in a world without global warming. Meanwhile, Carbon Brief covered new research finding that recent drying over the Amazon could be the “first warning signal” that the rainforest is approaching a tipping point.
RAINFOREST ROAD: Climate Home News reported that Brazilian government officials are considering using the Amazon Fund, a major source of international finance aimed at protecting the rainforest, to pay for a “controversial road project”. According to the publication, officials have a plan for “a road that cuts through the Amazon forest and connects two major cities in the north of Brazil – Manaus and Porto Velho”. Environmentalists and scientists in Brazil told Climate Home News that they disagreed with using the Amazon Fund for such a project. One of the fund’s creators, forest scientist Tasso Azevedo, told the publication: “I don’t think it makes any sense. This project does not fit into any of the fund’s planned support lines.”
EU agri round-up
LOBBY MEET-UPS: Agricultural lobby groups and six “influential” European politicians held “an average of over two meetings a week” in recent years, according to DeSmog. The outlet found that between January 2020 and July 2023, more than 400 meetings took place between six members of the European parliament (MEPs) and agri-industry representatives. The lawmakers met industry-linked groups “eight times as often as [they met] non-governmental groups representing public interests”, the outlet said. The politicians are all members of the centre-right European People’s Party, which was at the heart of climate and nature policy controversies earlier this year (see previous editions of Cropped). One of the MEPs said he does not take orders from industry groups, and the other five politicians involved did not respond to DeSmog’s request for comment.
TILLAGE V DAIRY: “Unbridled support” of the Irish dairy sector has “pushed tillage [crop farming] aside and left it struggling to survive”, according to Noteworthy. The Irish investigative outlet looked at high rental costs and other issues affecting grain growers across the country who say they feel “squeezed out”. In a separate piece, Noteworthy analysis found that around 50m tonnes of animal feed – largely maize and soya – have been imported to Ireland since 2012. The country has “never produced enough cereals – wheat, barley and oats – to meet livestock needs”, the piece added, with imports “only going in one direction – up”. Also in Ireland, the government announced a €3bn “war chest” for climate action and nature regeneration as part of the country’s annual budget, the Irish Independent reported.
OILY ISSUES: Meanwhile, the Guardian said that Europe has “almost run out of local olive oil supplies and is set for more shortages”. Extreme weather has “damaged harvests” for the second year in a row in key producer countries such as Spain, leaving Europe to import supplies from South America to meet demand, the outlet said. Rafa Guzmán, an olive grower in Jaén, “the cradle of Spain’s olive production”, told the Guardian: “It’s just awful for people down here. There’s always been the odd bad harvest, like last year. But two bad harvests in a row? I can’t remember any – and I’m 50 and have been working the trees with my dad since I was a kid.”
Spotlight
Offsets or exploitation?
In the fortnight since Carbon Brief’s week-long special, carbon-offset projects have come under further scrutiny. Bloomberg reported that Dubai-based Blue Carbon signed a deal to generate carbon credits from about a fifth of Zimbabwe’s landmass. Separately, a joint Climate Home News and Unearthed investigation found that projects in Cambodia and Brazil were “selling carbon offsets…despite an uptick in deforestation”.
India is the world’s second-largest source of carbon credits in the voluntary carbon market (VCM). For a new report, magazine outlet Down to Earth and India’s Centre for Science and Environment (CSE) analysed hundreds of offset projects and visited 40 project sites in India – from afforestation projects to paddy fields and villages enlisted in clean cookstove schemes. Carbon Brief spoke to CSE’s Trishant Dev and Avantika Goswami about their findings.
CARBON BRIEF: Perhaps the most worrying takeaway from your report is on farmers rights, especially in afforestation projects in the Araku coffee belt that you say companies such as Evian are using to claim carbon-neutrality. Did Indigenous farmers know what they were signing over? What did they get for their services, other than coffee earnings?
TRISHANT DEV: Just saplings and training [on how to care for them]. This is something that the developer also says: they will not give back incentives from offsetting to communities. When we spoke to farmers, they did not know what a carbon credit is or what rights they have given up…They only know they have signed a document through which they will be given something.
AVANTIKA GOSWAMI: Even if [developers] say they have ownership of the carbon stored in the trees, how you manage those trees and what trees you plant will determine how much carbon is stored in them. So, effectively, developers are controlling their farming methods and their practices by simply controlling the carbon in them. On what grounds does a foreign entity get to have this say over Indigenous communities in India?
The additionality question or the climate benefit was always suspect and we found that in our research. But the bigger finding is about financial benefit-sharing. You have tribal farmers putting in the labour, but earning none of the millions. You have rural households paying for an improved cookstove, which is also generating carbon credits and also earning revenue in the VCM, but the households do not earn that revenue. Our conclusion is that the poor are essentially subsidising or labouring for the emission reductions of the rich.
CB: You mention that all the projects you investigated were “cloaked in secrecy”. How open or transparent were developers in letting you visit sites and verify their claims? How do we know these credits will not be counted twice?
TD: First, we were not allowed to visit the project sites. We were told: “We have non-disclosure agreements with our clients, so we cannot take you [there].” Then we were told: “We cannot disclose the price [of credits] because we have competitors in the market.” Some developers even asked us to sign non-disclosure agreements with their clients, which we didn’t. The whole ecosystem is like a black box.
AG: If companies abroad are claiming the carbon sequestration from the Araku Valley’s coffee forests, what happens to [India’s carbon sink target] in its [Paris Agreement pledge]? Are these forests getting double-counted? Secondly, the VCM functions on a least-cost principle. So as a result, the cheaper mitigation options are essentially being sold off to foreign entities and we are left with the tougher, more expensive options. [India] cannot claim the cheaper methods – transitioning from biomass to include cookstoves or more afforestation – because, technically, if you want to avoid double counting, you have to exclude that from your own balance sheet, while rich countries continue to pollute and have taken our cheaper emission options.
News and views
PLANTATION THREAT: Writing in Trends in Ecology & Evolution, ecologists warned that monoculture tree-planting projects “are threatening tropical biodiversity while only offering modest climate benefit”, the Guardian reported. The popularity of carbon-offsetting plantations is having consequences such as “drying out native ecosystems, acidifying soils, crowding out native plants and turbocharging wildfires”, the story added. The University of Oxford researchers warned against “using carbon as the sole metric for a forest ecosystem’s importance” and argued that afforestation projects “need to encompass ecosystem restoration and biodiversity conservation”, Inside Climate News reported. Political scientist Dr Arun Agrawal, who was not involved in the paper, told the outlet: “Forests do many things, so to focus on any single metric is really to replicate how colonial governments saw forests, which is just as a source of timber.”
SMOG WARS: Indonesia’s firefighters “are rushing to extinguish” fires in southern Sumatra, Jambi and Central Kalimantan, Bloomberg reported. With no recent rainfall, national authorities warned that the fires are likely to persist, while the government is implementing “cloud seeding to induce rain that can keep the peat wet and fill reservoirs”, it added. According to Bloomberg, Malaysia blamed the fires in Indonesia for worsening air quality in its western cities, but Indonesia’s environment minister, Siti Nurbaya Bakar, denied the claims. More than 267,900 hectares of forest have burned so far this year – an area bigger than the area burned in all of 2022, Reuters reported. The haze has now hit Singapore, Reuters reported in another story.
BEDBUGS TAKE PARIS: Reports of a “plague of bedbugs” in Paris and other French cities have provoked “panic” and “insectophobia”, according to BBC News. The number of bedbug sightings have increased in recent weeks, but the upward trend dates back “several years”, the broadcaster said. The broadcaster said climate change “can be ruled out” as a contributing factor, but Prof James Logan from the London School of Hygiene and Tropical Medicine told Vice: “Most insects breed better when it’s warmer, so if there are more months of the year that are warmer, then there’s more chance of insects breeding quicker.”
BIDEN’S BORDER WALLS: In “a marked departure from…efforts to be seen as a climate champion”, the Biden administration waived environmental, health and cultural protections to build 20 new miles of a border wall in Texas, the Guardian reported. The wall will cut through fields where “the Carrizo/Comecrudo Tribe and other tribes source peyote for sacramental use”. The wall threatens to “set back the recovery” of endangered species and has “enraged environmentalists and Indigenous leaders in the Rio Grande valley”, who liken it in the story to “being stabbed in the back”. When asked if he thought the border wall was effective, President Biden responded “no” and pointed to how funds for the wall were allocated during the Trump regime, but hadn’t been cancelled by Congress, the Hill reported.
SYCAMORE STUMP: The Sycamore Gap tree, a hugely popular landmark in England sited next to Hadrian’s Wall in Northumberland, has been cut down – sparking an unusual police investigation, BBC News said. Forensic officers were sent to the site after the tree – once a place for weddings, funerals and the scattering of ashes – was felled on 28 September, BBC News reported, with one remarking: “In 31 years of forensics I’ve never examined a tree.” A 16-year-old boy and a man in his 60s were arrested on suspicion of causing criminal damage, but the investigation is still ongoing, according to the outlet.
Watch, read, listen
REVOLUTION RETROSPECTIVE: A new piece by environmental anthropologist Prof Glenn Davis Stone in the Conversation examined the legacy of Asia’s Green Revolution and the cautionary lessons it holds for Africa.
SAINATH ON SWAMINATHAN: In the Wire, P Sainath looked back on the legacy of MS Swaminathan – the “father” of the Green Revolution in India – and why he will be remembered “in the hearts of millions of peasants”.
LIVING WITH RATS: Can rats, long vilified as plague-spreaders and invasives, co-exist with humans and other species? This longread by JB MacKinnon in Hakai Magazine weighed the evidence, with illustrations by Sarah Gilman.
FOOD LOCALISM: In a new episode of BBC’s The Food Programme, host Sheila Dillon spoke to small farmers, economists and campaigners about what is needed to strengthen local food networks.
New science
Countries’ vulnerability to food supply disruptions caused by the Russia-Ukraine war from a trade dependency perspective
Scientific Reports
A new study found that food supplies in 24 countries – particularly Georgia, Armenia, Kazakhstan, Azerbaijan and Mongolia – were among the most affected by the Russia-Ukraine war, because “they depend almost entirely” on food imports from both countries. Researchers evaluated the impacts of supply disruptions on six crops and three types of fertilisers. Access to fertilisers was particularly affected in Estonia, Mongolia, Kazakhstan, Brazil, the US, China and India, the study found. Its results indicated that the Democratic Republic of Congo, Ethiopia, Egypt and Pakistan are “most vulnerable to such supply disruptions”, based on their populations, import types and purchasing power per capita.
Lessons from COP15 on effective scientific engagement in biodiversity policy processes
Conservation Biology
Scientists can boost the “effectiveness” of global agreements by focusing more on communication and engagement, a new paper found. The researchers looked at challenges limiting scientist involvement in the policy process behind the Kunming-Montreal Global Biodiversity Framework, which was agreed at the COP15 biodiversity summit last year. They drew parallels with similar challenges in global climate negotiations and compared the development of two targets – those focused on genetic diversity and protected areas – under the framework. The analysis showed that scientists can make global agreements more effective and address challenges by prioritising communications, consensus-building and being engaged with the policymaking process.
River interlinking alters land-atmosphere feedback and changes the Indian summer monsoon
Nature Communications
Proposed river “interlinking” projects in India, meant to counter the impact of increasing droughts and floods, could cause average September rainfall to drop by up to 12%, according to a new study. The authors used a coupled regional climate model and multiple datasets to show land-atmosphere feedbacks between river basins in India. They found that increased irrigation from such water transfers would increase the pressure on areas that are already water-stressed. The study’s results showed that reduced rains in September as a result of these projects “can dry rivers post-monsoon, augmenting water stress across the country and rendering interlinking dysfunctional”.
In the diary
- 8-12 October: UNFCCC Middle East and North Africa Climate Week | Riyadh
- 9 October: Deadline for expert comments on the next revision to the System of National Accounts | Online
- 14 October: Australia Indigenous rights referendum
- 14 October: New Zealand general election
- 15-19 October: CBD 25th Meeting of the Subsidiary Body on Scientific, Technical, and Technological Advice (SBSTTA 25) | Nairobi
- 16 October: FAO World Food Day
- 19-20 October: CBD resumed second part of COP15 | Nairobi
Cropped is researched and written by Dr Giuliana Viglione, Aruna Chandrasekhar, Daisy Dunne, Orla Dwyer and Yanine Quiroz. Please send tips and feedback to cropped@carbonbrief.org
The post Cropped 11 October 2023: Amazon dolphin deaths; EU agri round-up; ‘Exploitative’ carbon offsets appeared first on Carbon Brief.
Cropped 11 October 2023: Amazon dolphin deaths; EU agri round-up; ‘Exploitative’ carbon offsets
Climate Change
‘Ride the wave of momentum’: Australia announces once-in-a-decade Marine Parks Network review
In response to the federal government announcing its once-in-a-decade review of Australia’s Marine Parks Network, the following lines can be attributed to Elle Lawless, Senior Campaigner at Greenpeace Australia Pacific:
“Greenpeace Australia Pacific welcomes today’s announcement that the Albanese Government will review Australia’s Commonwealth Marine Parks Network. This is a rare, once-in-a-decade opportunity to strengthen our marine parks and ban industrial fishing in Australia’s marine protected areas.
“Australians would be appalled to know that more than half of Australia’s Marine Parks Network currently allows for extractive industries, like longlining, bottom trawling and oil and gas mining. These so-called ‘protected’ areas were designed to safeguard our beloved ocean wildlife and underwater ecosystems – that is what Australians expect. Damaging industrial industries should not be given a free pass to trawl, fish, drill or extract from our marine parks.”
“With the first Ocean COP just around the corner, and off the back of Australia’s move to ratify the Global Ocean Treaty earlier this year, the Australian government has a unique opportunity to ride the wave of this momentum and solidify itself as a true global ocean leader.
“Greenpeace Australia Pacific is calling for industrial activities to be banned from our protected waters and for at least 30% of Australia’s ocean to be protected as ocean sanctuaries. This review presents a rare opportunity to create more ocean sanctuaries, true blue havens where ocean life can recover, thrive and repopulate the surrounding waters.”
—ENDS—
‘Ride the wave of momentum’: Australia announces once-in-a-decade Marine Parks Network review
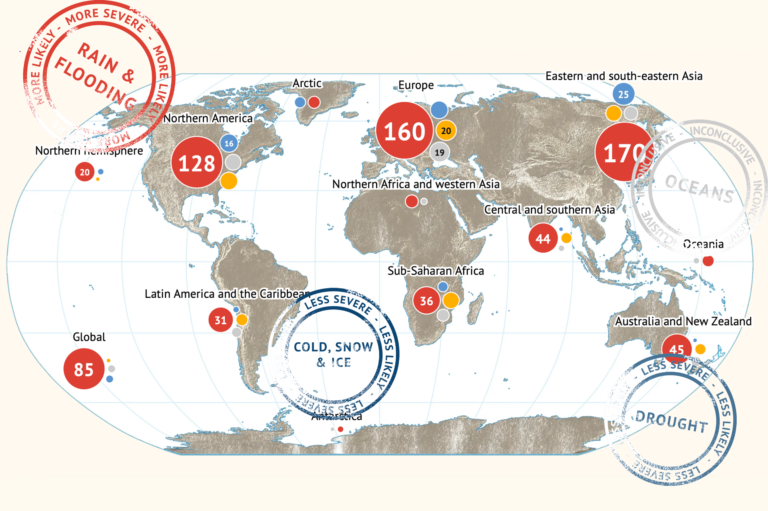
In recent days, prominent climate sceptics and rightwing commentators have shared charts on social media incorrectly implying that Europe is having its “quietest” year for wildfires in 2026.
These include Dr Matthew Wielicki, a former University of Alabama geochemist and self-described “professor in exile”, who was recently appointed by the Trump administration to lead the US Global Change Research Program.
However, these charts paint a misleading picture as they are skewed by encompassing the entirety of Russia in the data – including the vast plains of Siberia.
These charts also use data that include fires that are deliberately lit to manage cropland, which is a declining practice across much of Europe.
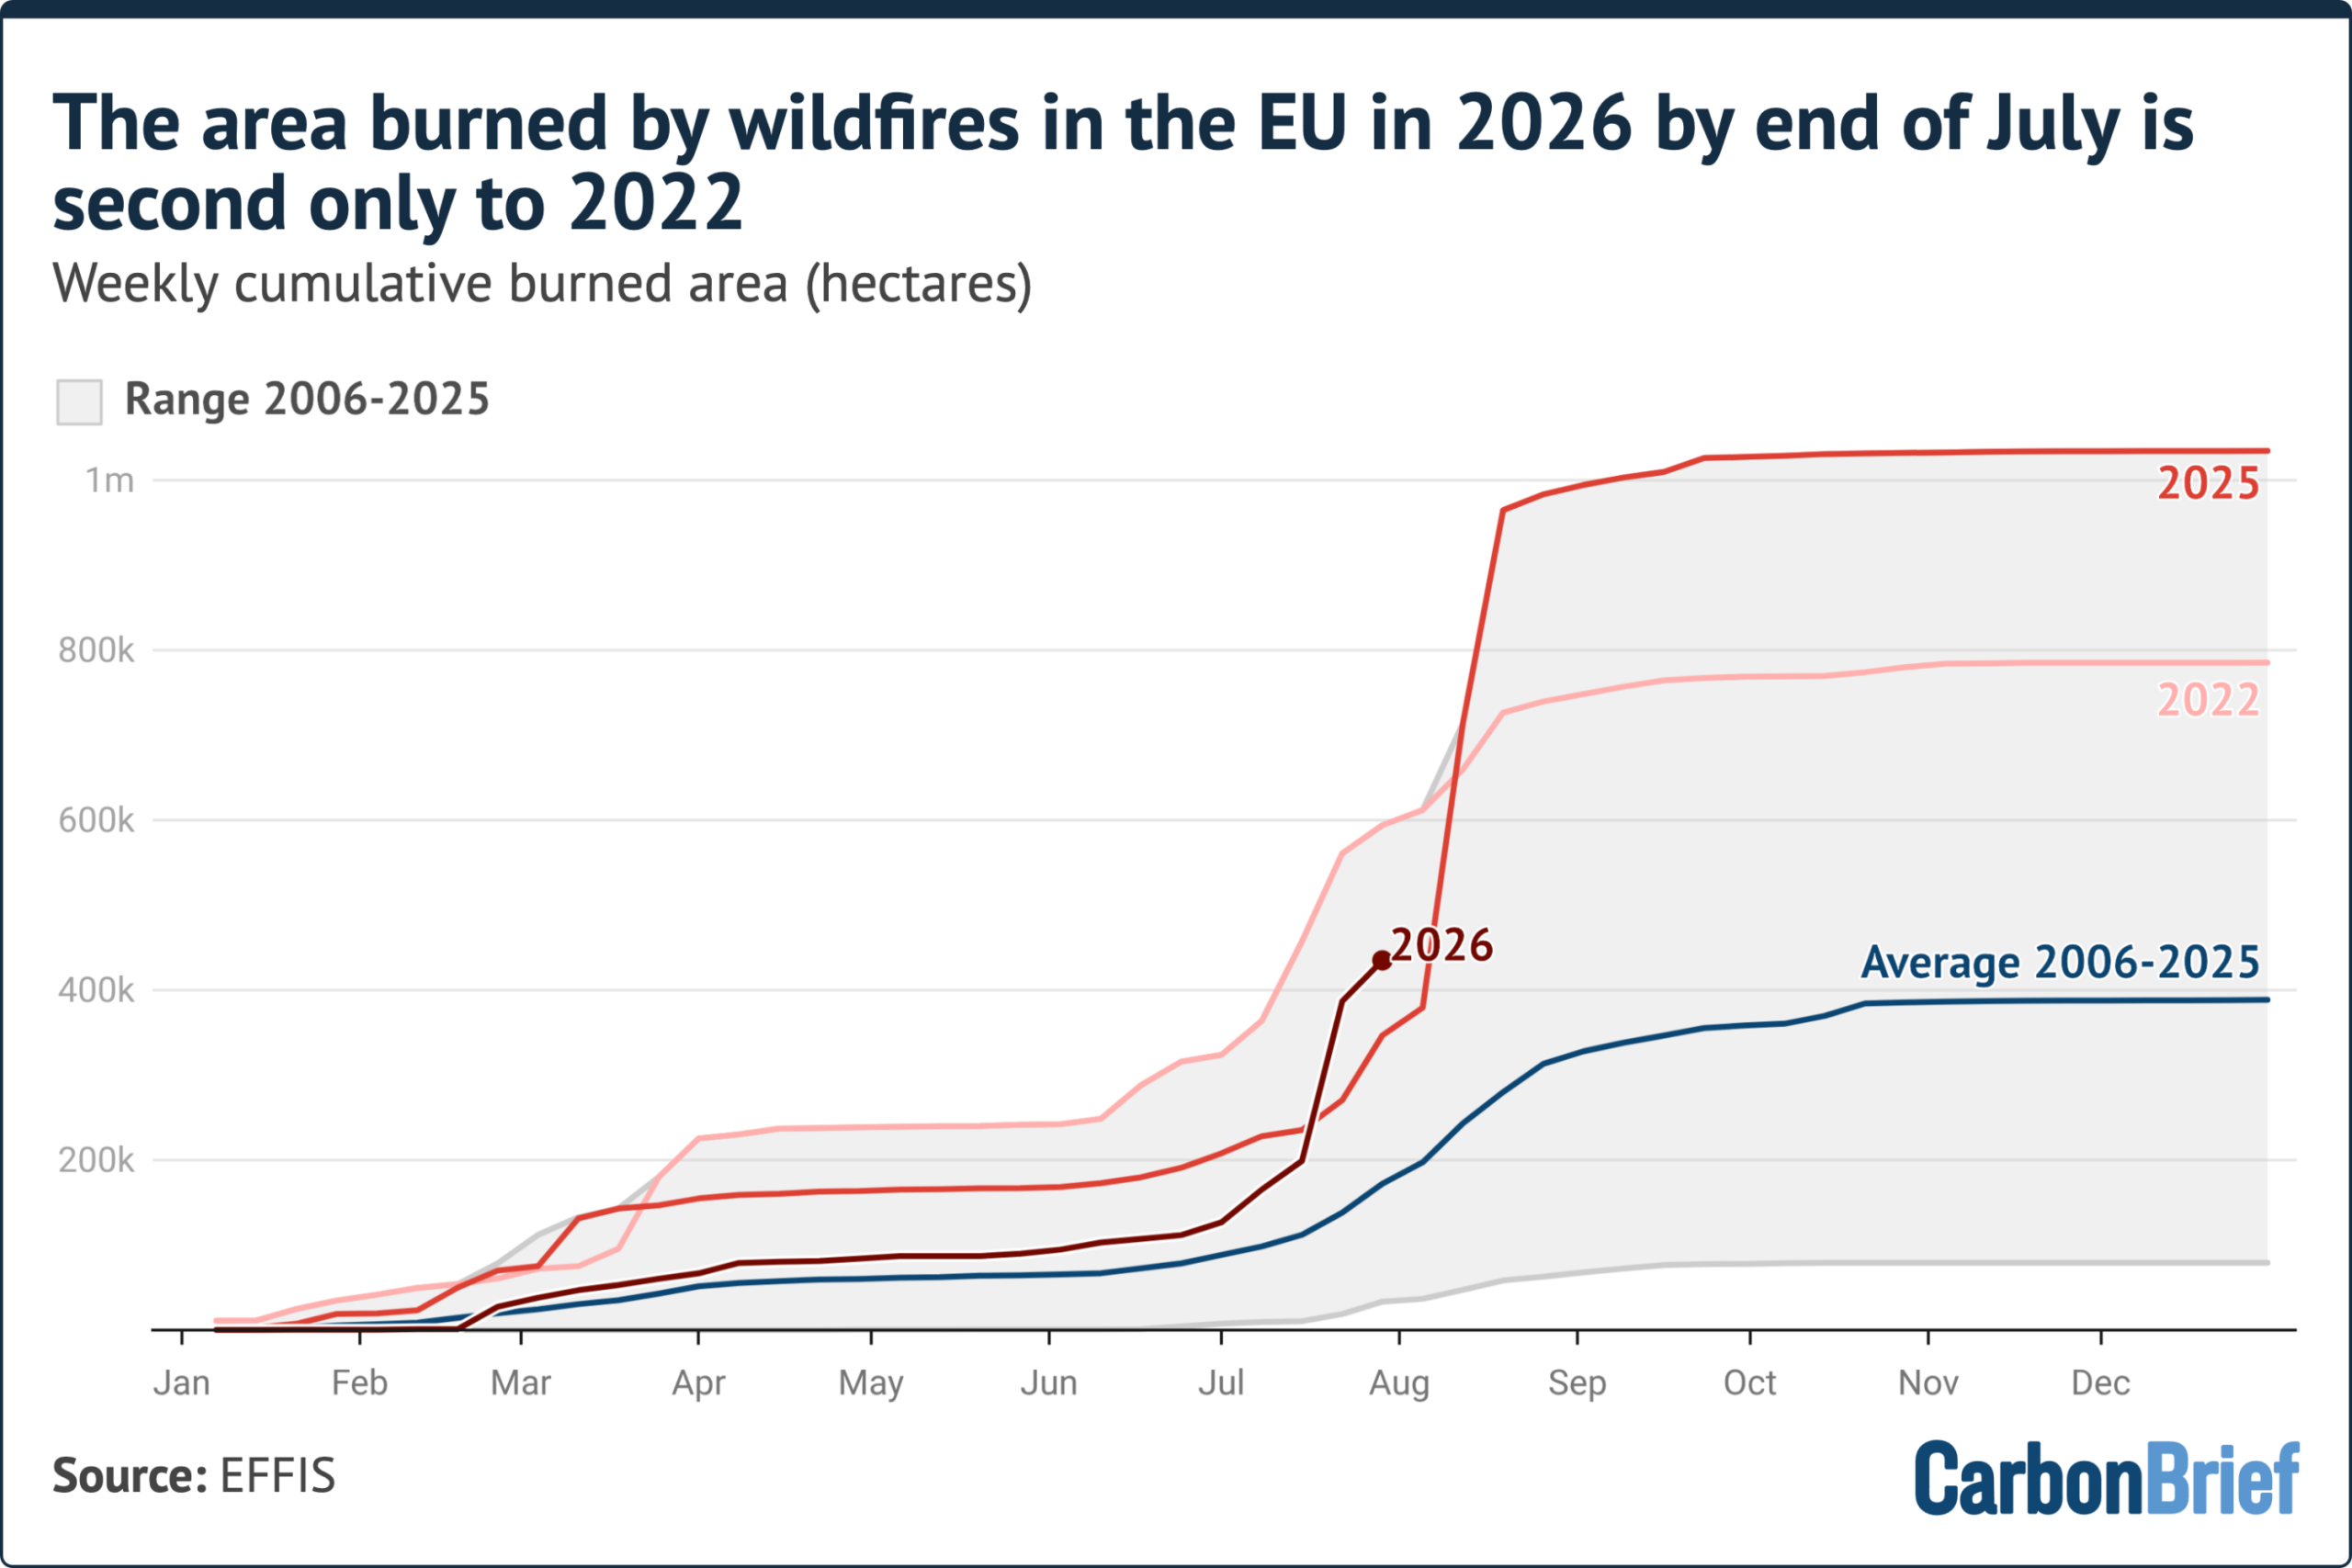
In this factcheck, Carbon Brief shows that the area burned by wildfires across the European Union in 2026 is second only to 2022 for this time of year.
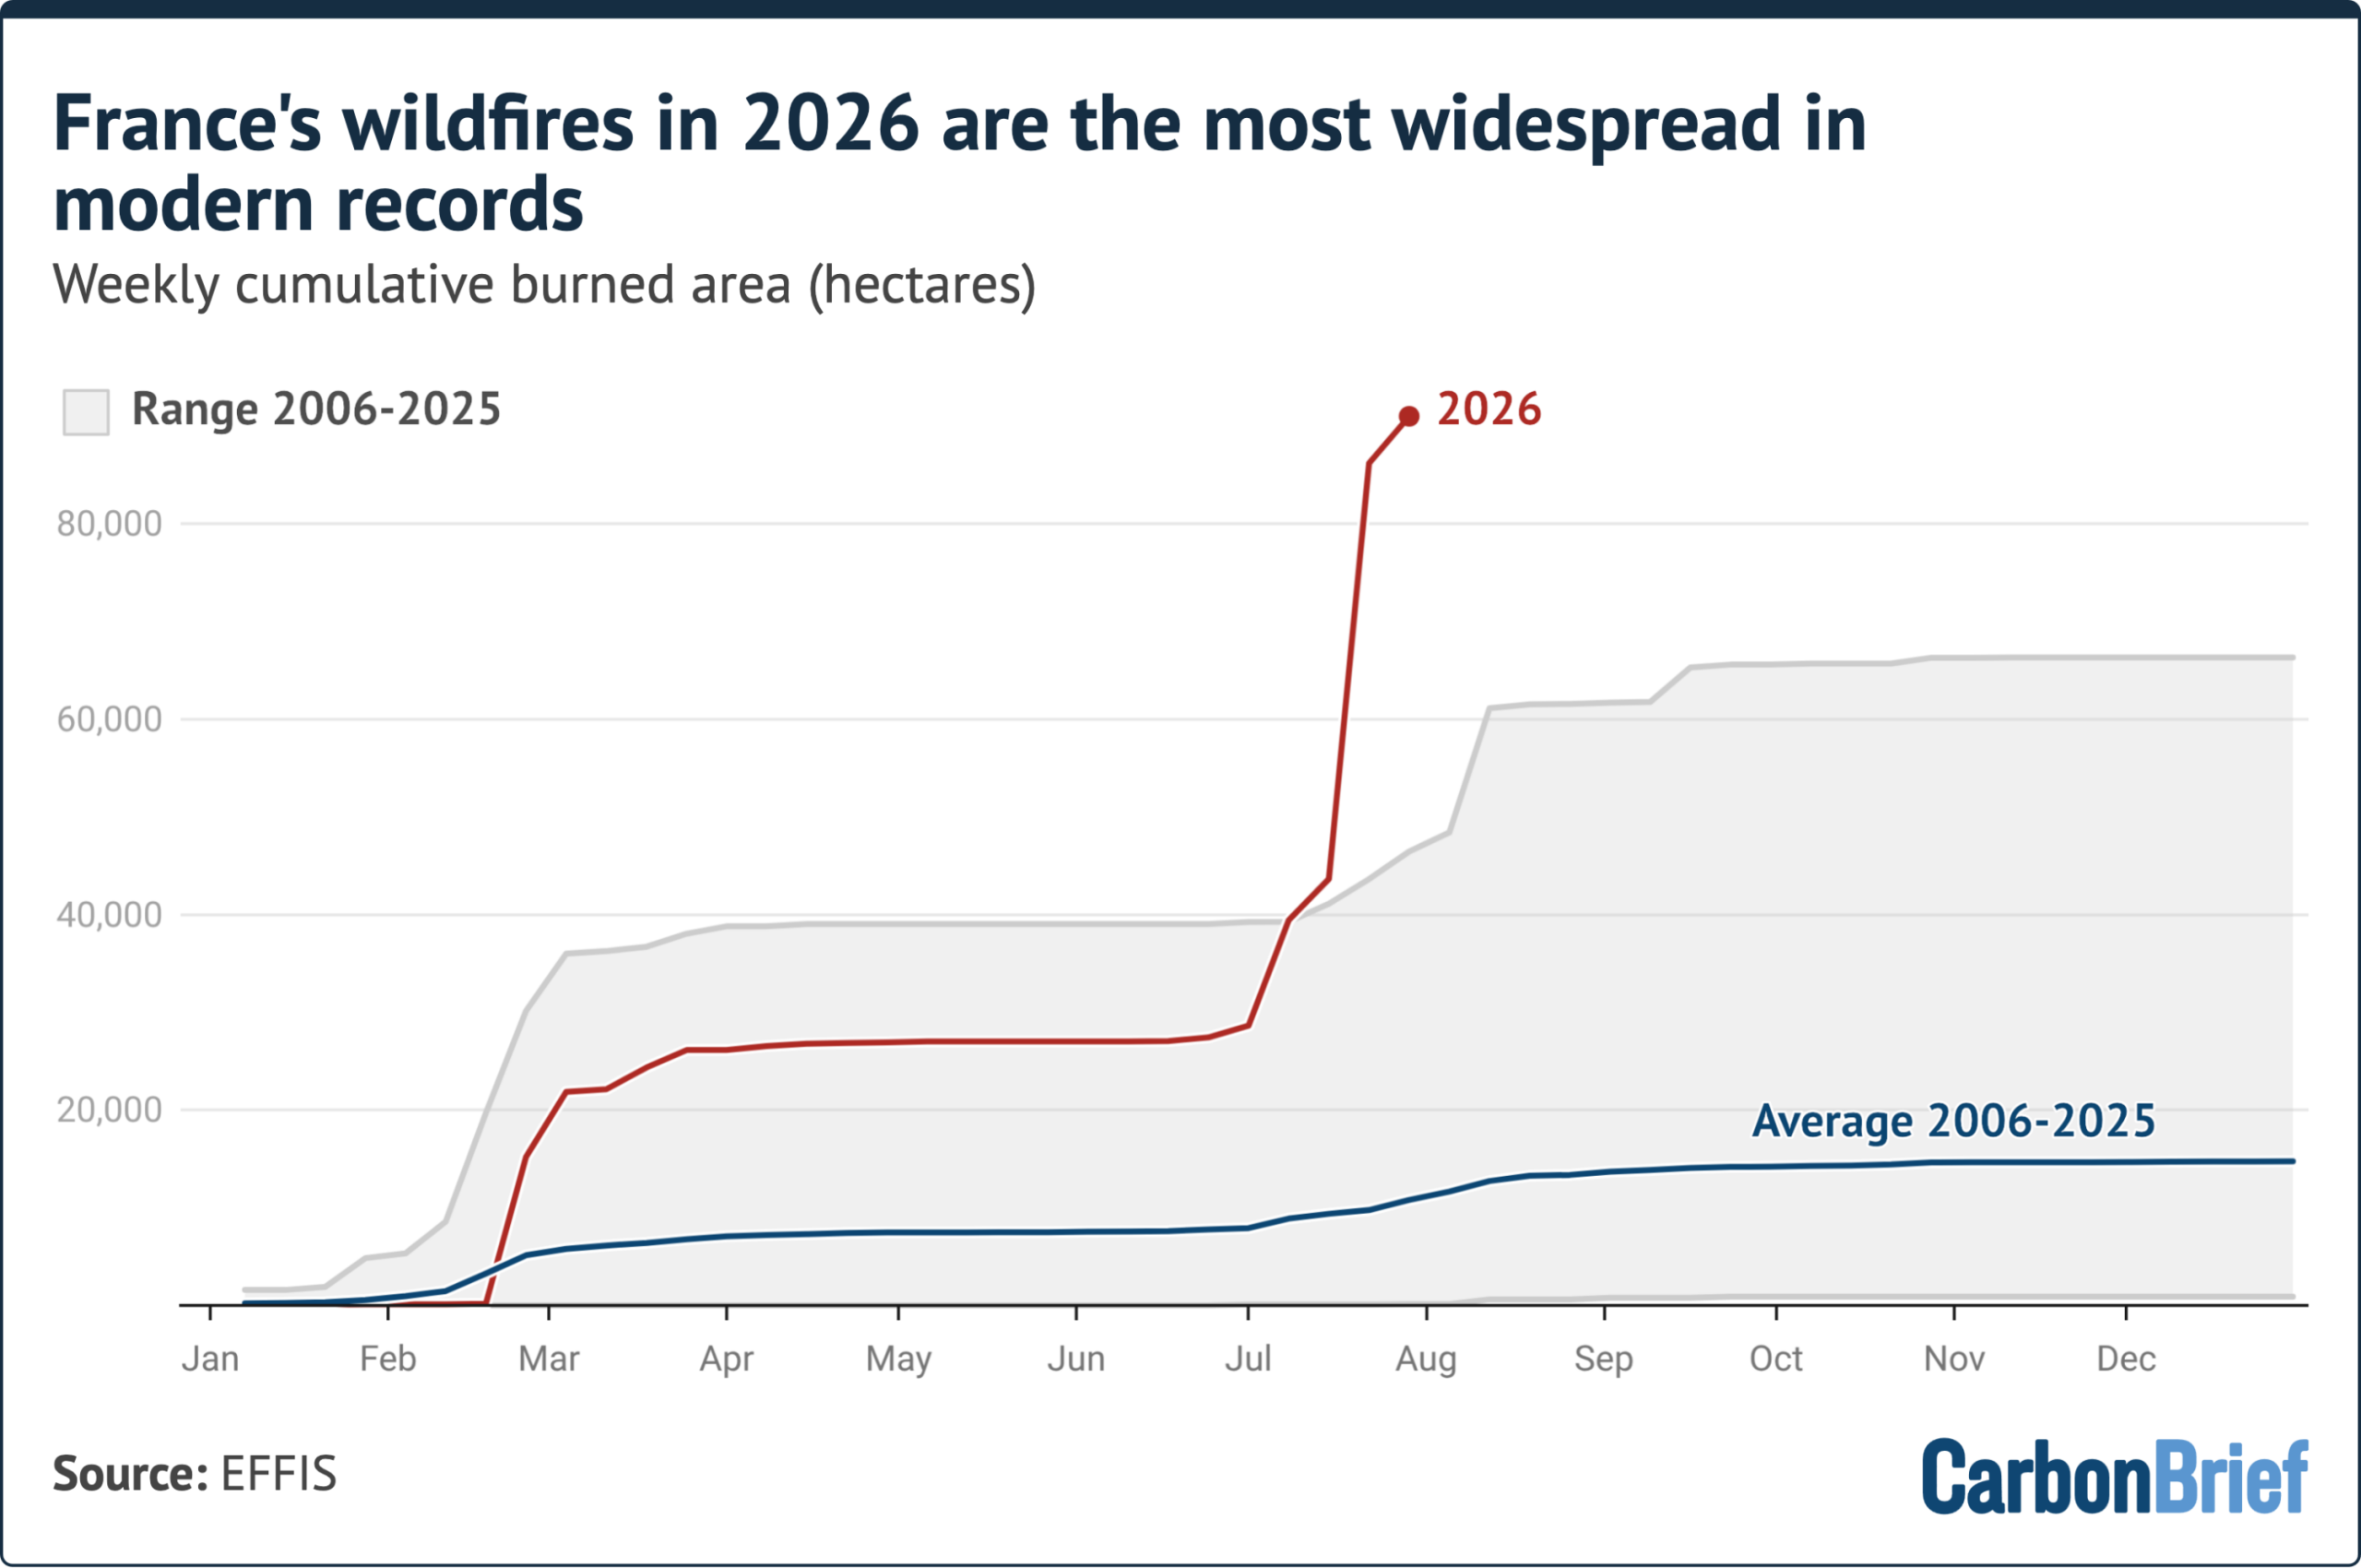
The latest data from the European Forest Fire Information System (EFFIS) also shows that France has set a new modern record for area burned and Spain’s wildfire season is among the worst on record.
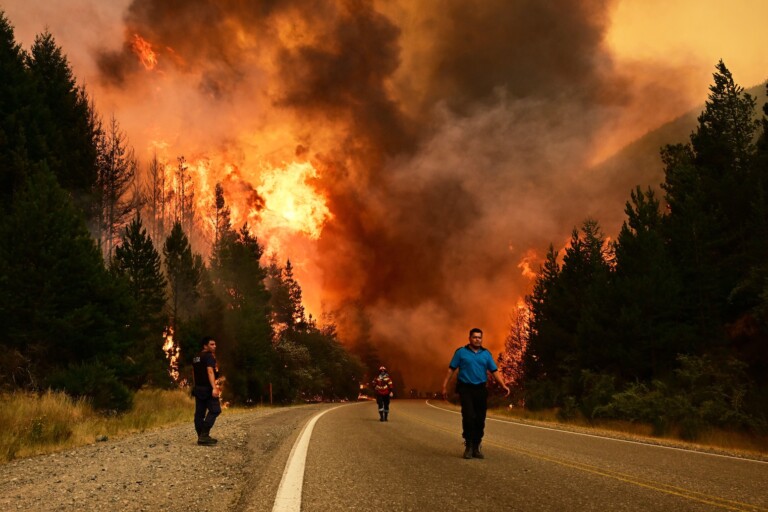
The fires have displaced more than a third of a million people across south-western Europe, while an impending heatwave has also raised fears of the fires worsening in the coming days.
‘Quietest year’
On 27 July, as wildfires raged across multiple European countries, former Conservative peer and climate-sceptic commentator Matt Ridley posted on Twitter that “2026 is the quietest year for wildfires in Europe by some distance”.
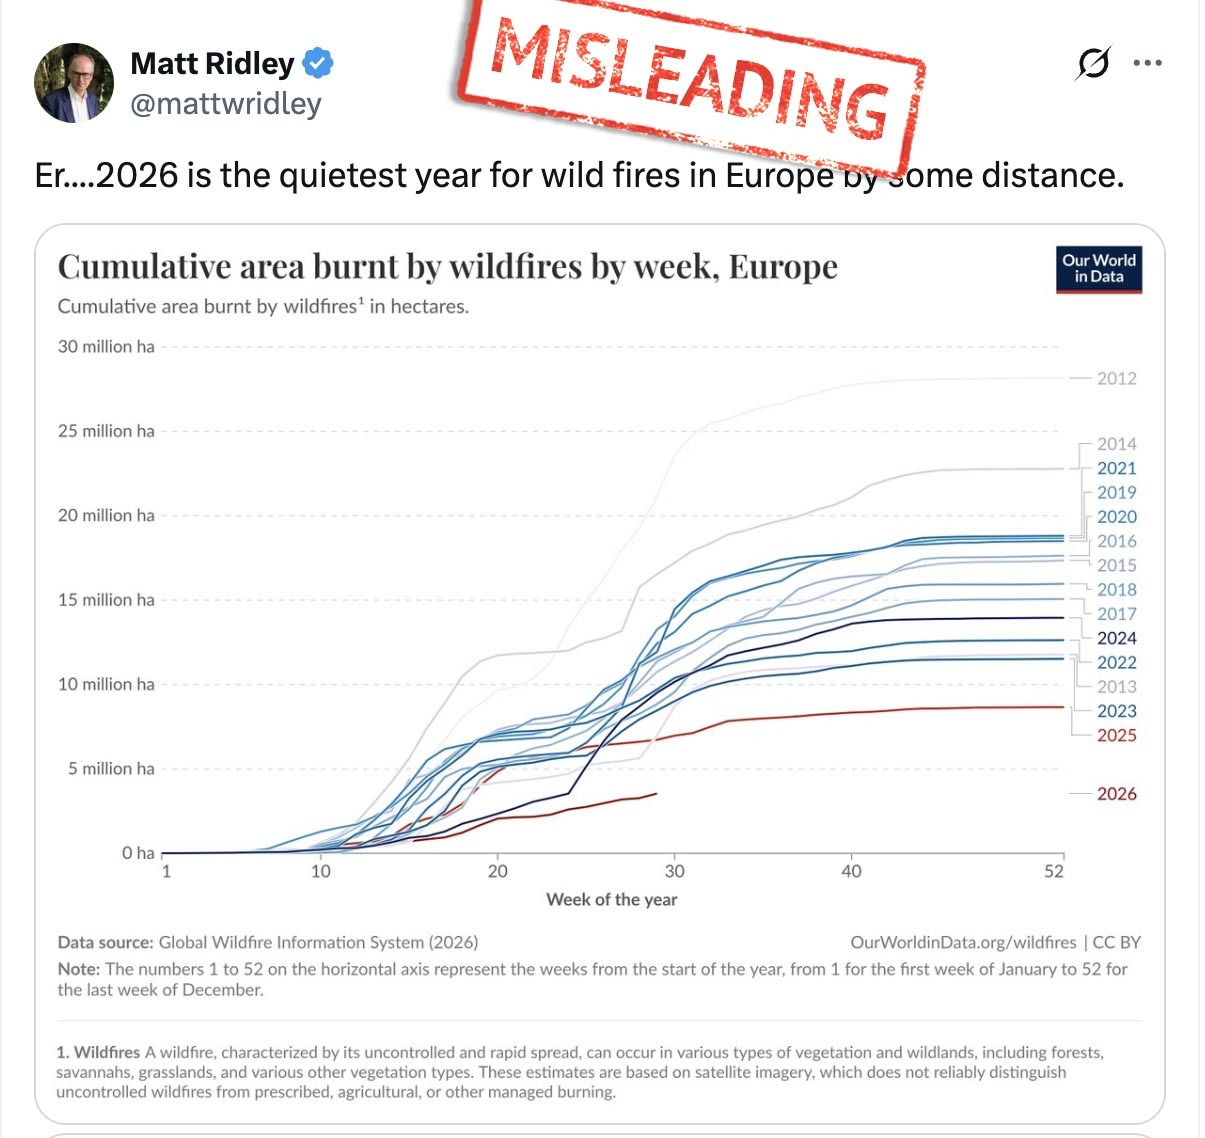
Ridley, who sits on the academic advisory council of the Global Warming Policy Foundation (GWPF), a UK-based climate-sceptic lobby group that refuses to reveal the sources of its funding, was responding to an article by Daily Telegraph columnist Tim Stanley.
Stanley’s column, headlined: “Climate change is real – and the right needs to get serious about it”, warned:
“This is no longer a matter of speculation: the wildfires of Europe, pitiless and persistent, are the way we live now.”
Ridley included a chart from Our World In Data, showing the cumulative area burned by wildfires by week for Europe. The chart puts 2026 as having the smallest area for this time of year in a dataset going back to 2012.
Ridley’s post was widely shared by prominent rightwing figures – including Richard Tice, deputy leader of the hard-right, climate-sceptic Reform UK party, former Conservative cabinet minister Jacob Rees-Mogg and multiple commentators.
Separately, Wielicki also shared a chart on Twitter to imply that wildfires in Europe are declining. Wielicki has previously claimed that the “science is not settled on climate change”.
The charts posted by Ridley and Wielicki both use data from the Global Wildfire Information System (GWIS). The GWIS category for “Europe” encompasses all the countries on the continent and includes the whole of Russia.
As a result, Russia accounts for about 74% of the area included in the GWIS definition of “Europe”.
Wildfires in Russia typically account for 80-90% of the burned area in the GWIS Europe dataset. In 2026, fires in Russia are substantially below average. Therefore, including Russia in this comparison creates the false impression that wildfire activity across Europe is unusually low.
Dr Calum Cunningham, a research fellow at the University of Tasmania’s Fire Centre, says that such claims are “highly misleading”, noting that “they rely on aggregating fire activity across an enormous and climatically diverse region”. He tells Carbon Brief:
“A relatively quiet season in Russia can easily mask an exceptionally active season in France or Spain. If the analysis is focused on the regions actually experiencing the current fires, the picture is very different.
“The reality is that western Europe has experienced an extraordinary sequence of climate conditions this year.”
In contrast, the EFFIS provides a subset of wildfire data specifically for the area covered by the 27 nations of the EU, which, therefore, excludes Russia.
Another difference between the two datasets is that GWIS monitors all fires – including those on agricultural land that are intentionally set alight. The burned area as measured by GWIS contains significant cropland area.
By contrast, EFFIS uses land-cover data and other information to filter specifically for forest fires.
Looking at the EU-only data from EFFIS reveals that Europe is far from having its “quietest” year. The bloc’s burned area, as of 29 July, is almost 435,000 hectares (ha) – second only to 2022 for this time of year.
Notably, Wielicki has actually continued to post charts based on GWIS data, even after acknowledging that “includ[ing] all of Russia, including vast areas of Siberia…isn’t a good proxy for Europe”.
French fires
Even looking at EU-wide data misses the scale of this year’s wildfires for some individual countries.
The chart below shows the surge in burned area in France since mid-July.
For much of the first half of the year, the country was having a wildfire season that was only slightly above average in terms of total burned area. However, a notable uptick began in the first week of July.
The third week of the month saw France break its previous cumulative annual record by more than 19,000ha. That gap has widened as the fires continue to burn; as of 29 July, the cumulative burned area in France during 2026 was nearly 24,700ha above the previous record.
The fires in France follow a record-breaking June heatwave that “dried out vegetation across the region, allowing fires to spread quickly”, wrote the New York Times.
On 27 July, French president Emmanuel Macron called a “crisis cabinet meeting” in order to address the fires “ravaging several areas of south-west France”, said France 24.
More than 220,000 people have been evacuated due to the Gironde fire, west of Bordeaux, in “what may be France’s largest peacetime evacuation”, reported the Associated Press.
In the Conversation, Cunningham and two other University of Tasmania researchers write that evacuation orders “protec[t] human lives, but makes it more likely houses and other structures will burn if there’s no one to defend them”. They add:
“There is little doubt climate change has made France and Spain’s wildfires worse. They represent yet another reason to redouble our efforts to tackle climate change and stabilise our climate.”
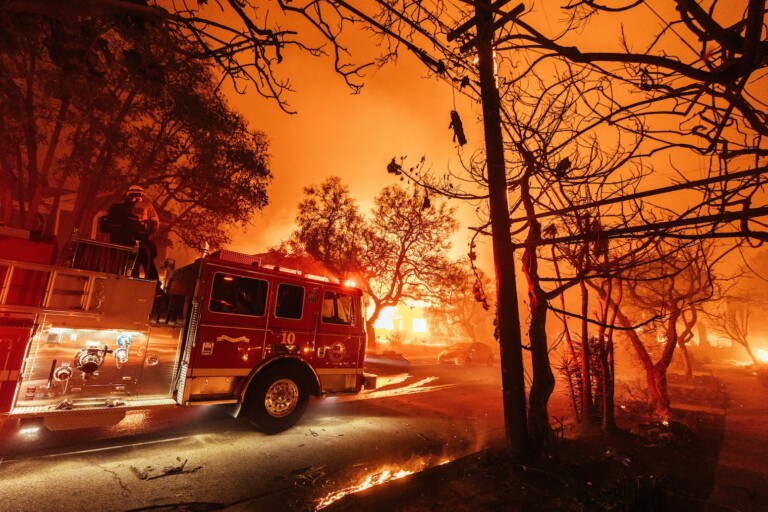
Central Spain scorched
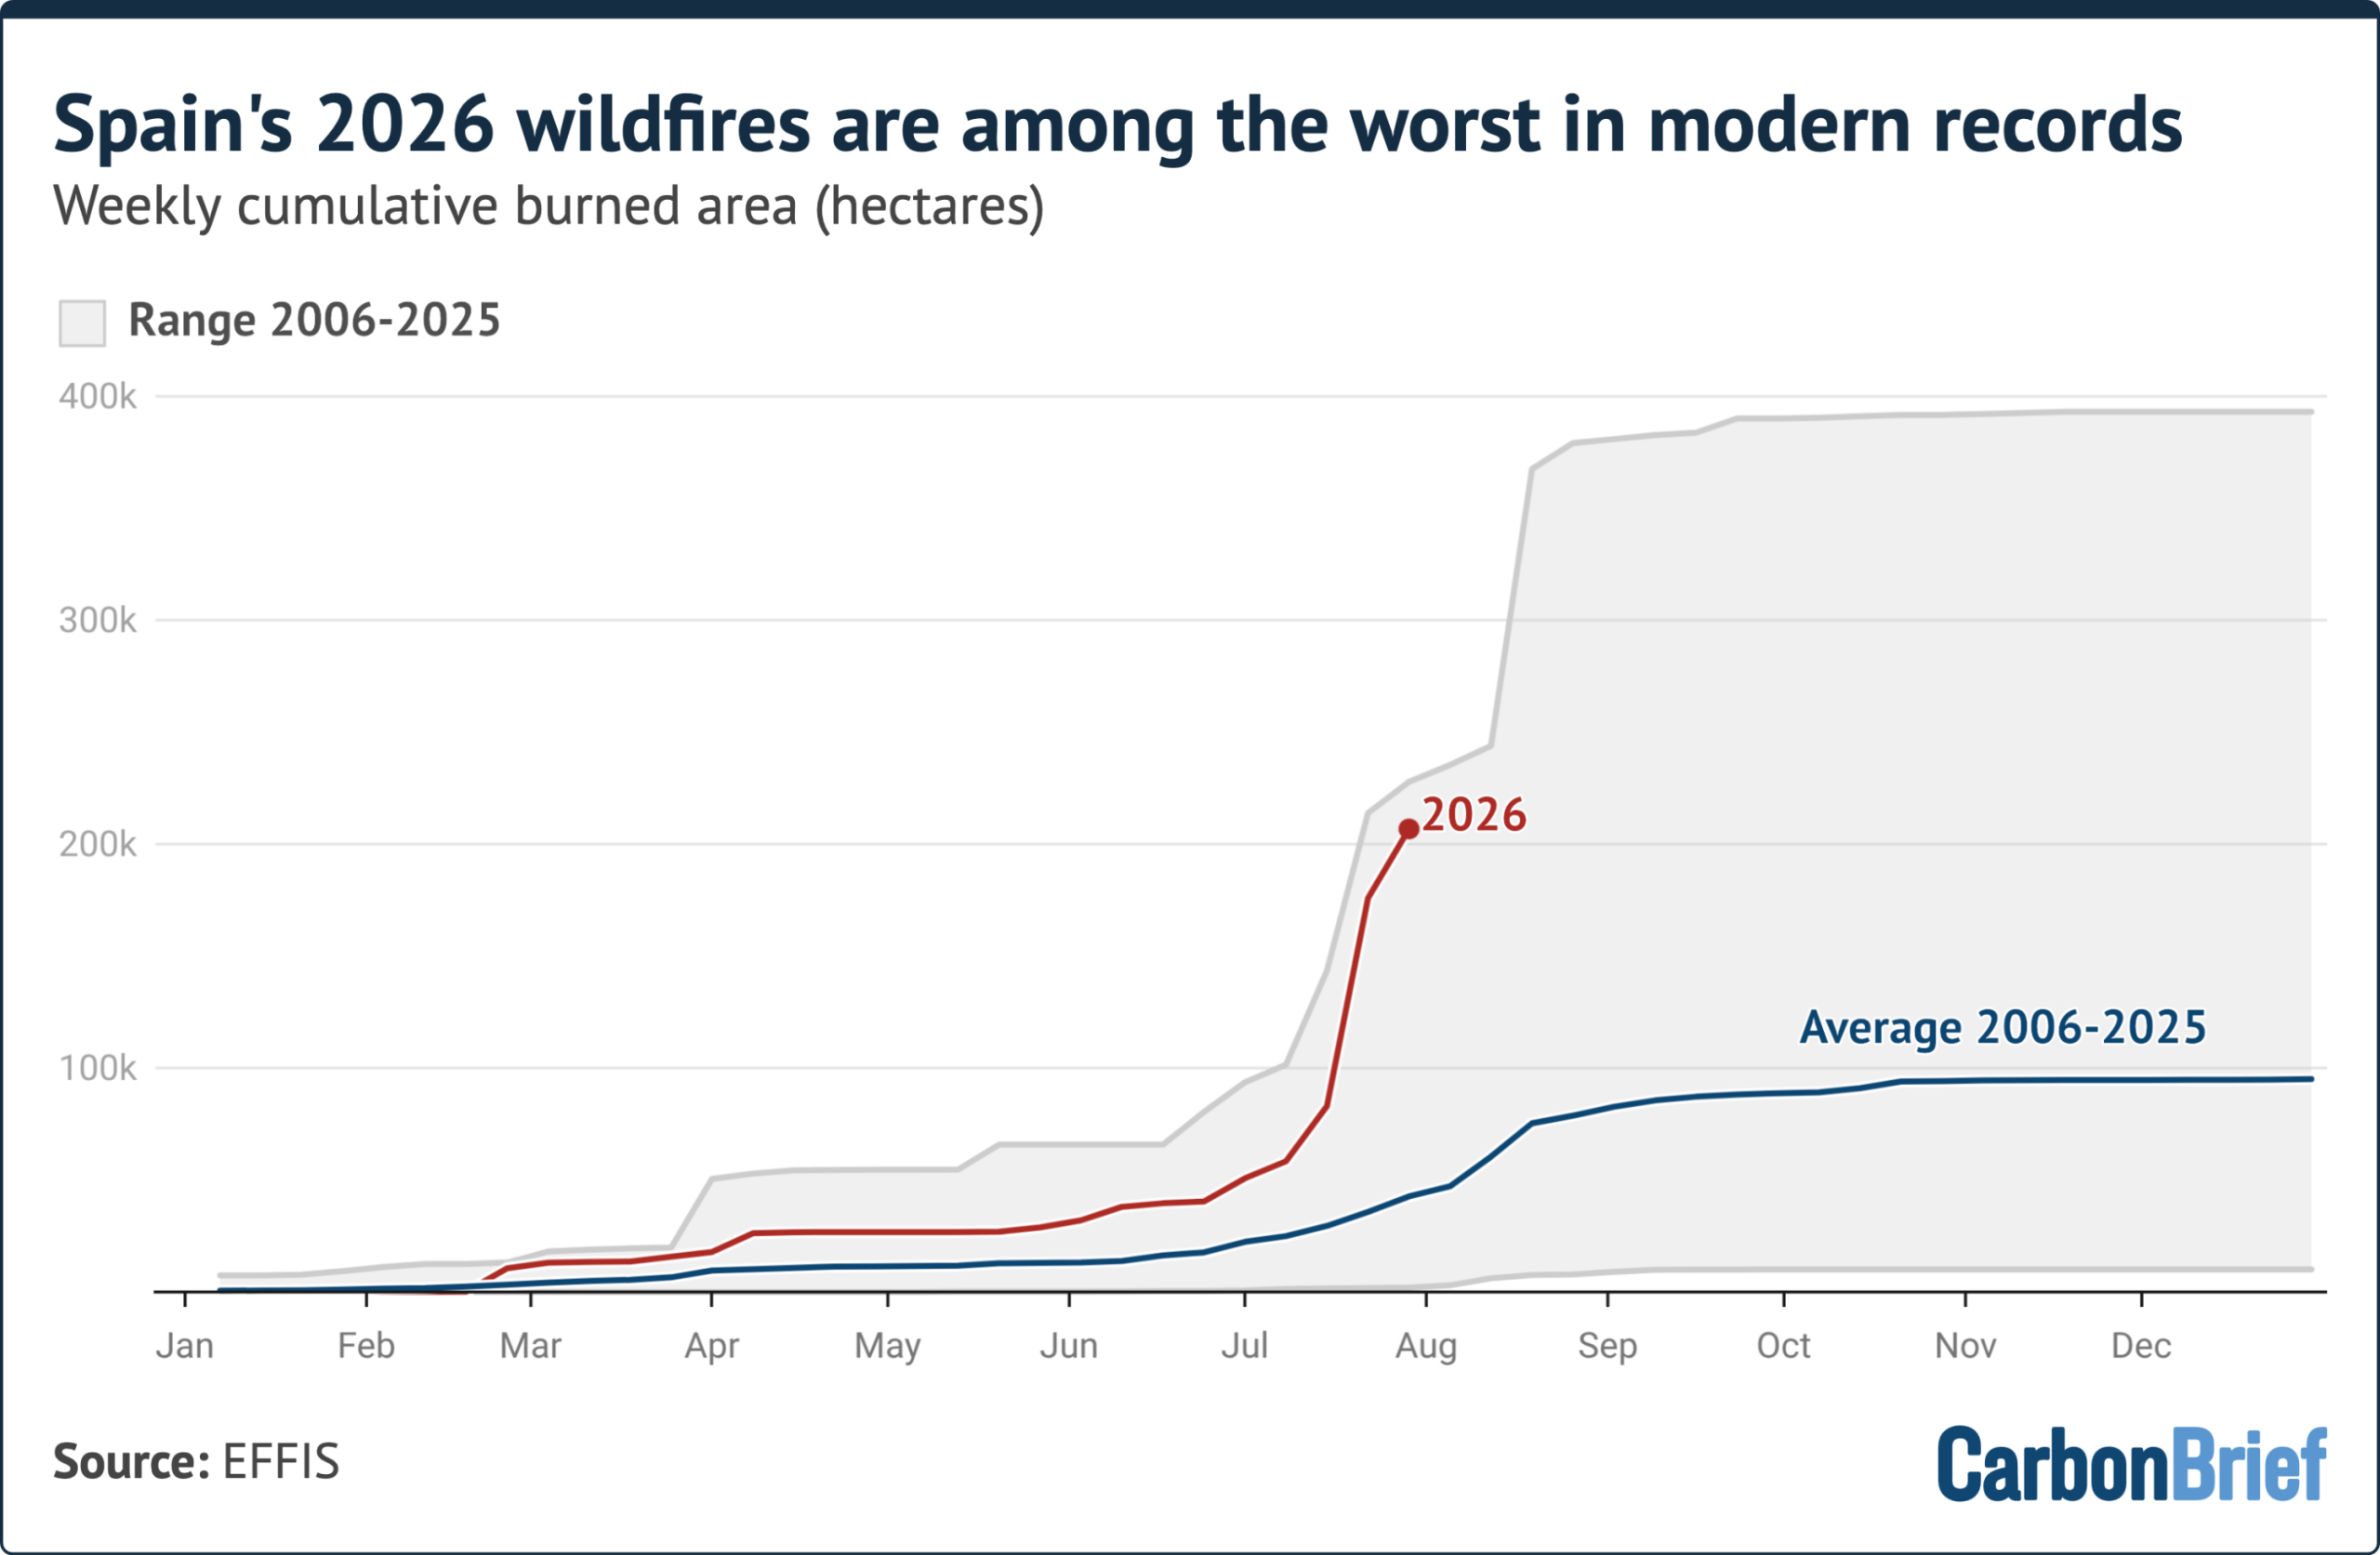
While Spain’s fire season has not broken records in the same way that France’s has, it is on track to be among the worst since EFFIS began reporting data in 2006.
The chart below shows the rapid increase in burned area in Spain since 8 July. The latest data from EFFIS reveal that, as of 29 July, Spain has almost matched its previous record at this point in the year. It is also nearly five times the average area burned for this time of year.
In Spain, the wildfires have been concentrated in the central part of the country, near Madrid.
BBC News reported that the fires outside the capital have burned “an area more than twice as large as the city itself”.
Nearly 90,000 people were forced from their homes in central Spain by the fires, said the Associated Press.
Pedro Sánchez, Spain’s prime minister, called the fires a “painful expression” of climate change.
Meanwhile, the UK, French and Spanish governments have issued joint statements this week in response to the fires. The UK/Spain statement begins:
“This summer’s wildfires demonstrated that climate change was now a national security emergency facing Europe and threatening our way of life.”
Related
The post Factcheck: No, Europe is not having its ‘quietest’ year for wildfires appeared first on Carbon Brief.
Factcheck: No, Europe is not having its ‘quietest’ year for wildfires
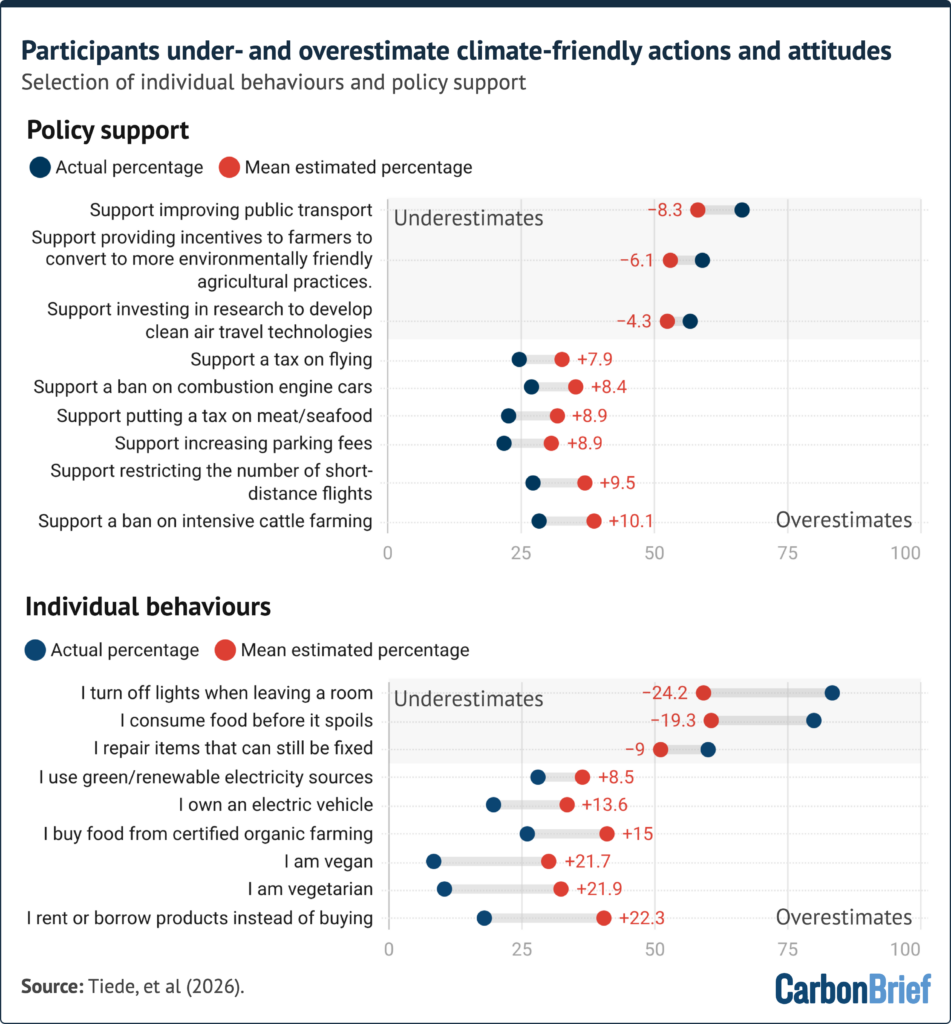
The general public often underestimate support for climate action, while overestimating the real-world actions taken by other people to address the problem, according to new research.
The study, published in Nature Climate Change, explores the differences between people’s support for climate change, their behaviour and their assumptions about other people’s behaviour.
It is based on multiple surveys of more than 5,000 people across Germany and the US.
The study expands on previous research on how the general public systematically underestimate the climate commitment of their peers.
The difference between actual and perceived support for climate action among the public is sometimes known as a “perception gap”.
The surveys tested how people’s perceptions of climate attitudes and behaviours relate to their own willingness to contribute and undertake “climate-friendly” actions.
One of the authors tells Carbon Brief that this perception gap is not due to “ignorance or bias”, but because “people are just not good at making good estimations”.
The research also reveals that people’s opinions and behaviours are more “nuanced than previously assumed” and suggests that simply “correcting misperceptions” does not automatically lead to greater climate action.
Measuring climate actions
The study notes that correcting the perception gap is often seen as a “cost-effective” way to promote public engagement and drive action to reduce the intensification and impacts of climate change.
Most studies that explore the perception gap have primarily focused on surveys that have asked people to report their willingness to support climate change.
In other words, researchers have relied upon people saying they would support efforts to tackle climate change, rather than measuring people’s real-world actions, such as financial donations, attending protests or changing their behaviour.
To fill this gap, the researchers behind the new study surveyed a total of more than 5,000 people in Germany and the US over 2024-25. Surveys were split across five different experiments, each focused on public perceptions of climate attitudes and how they relate to individuals’ actual behaviour:
| Experiment | What they did |
| Survey one | Participants were asked if they were willing to donate 1% of their household income to WWF – and then were given the chance to do so. Follow-up questions asked participants to predict how many of their peers said “yes” and how many actually donated to the charity. |
| Survey two | Participants read a constitutional complaint against the German government, led by Greenpeace, which demands for stricter climate policies. They were asked if they were willing to participate as a claimant and/or donate to the cause – and then were given the chance to do so. Follow-up questions asked participants to predict how many of their peers said “yes” and how many went on to support the complaint. |
| Survey three | Participants were requested to complete an online “work for environmental protection task” where the more “pages” they completed resulted in more donations to WWF. They then predicted how many pages their peers completed. Participants also rated their individual behaviours and support for eight climate policies and then estimated the same for other people. |
| Surveys four and five | Participants were split into three groups that were either informed that 4% of participants had donated 1% of their household income to WWF, that “68% were willing to contribute” or given no information. They then had to state whether they were willing to support WWF and then were given the opportunity to do so. |
The authors note that Germany and the US are two of the “top 10 CO2 emitters” and are places where climate action is “especially necessary”. However, they add that the two countries are not reflective of “diverse cultural contexts” and further research is needed across the world.
The perception gap
The researchers find that most of their participants supported climate action, but much fewer actually performed verifiable behaviours.
For example, survey one finds that 37% of participants said they were willing to donate to WWF, yet just 4% did when given the opportunity.
Participants generally overestimated the climate actions of their peers, predicting that 23% of other people donated. Willingness, on the other hand, was slightly underestimated with respondents averaging around 34%.
The results from survey three suggest that this perception gap is likely due to general cognitive processes within the human brain that make accurate estimations about large groups difficult, say the authors.
The chart below shows the actual percentage of people who supported different environmental policies and performed climate-friendly behaviours (blue dots) compared to average predictions from the surveys (red dots).
They reveal a “consistent pattern” where “small proportions were overestimated and large ones were underestimated”, the authors say, driving predictions towards the middle. This phenomenon is known as “regression to the mean”.
In other words, where public support for a policy was high, participants in the survey estimated it was lower than it was. When the support was lower, estimates would be higher.
The study finds that individual and environmental factors played a role in shaping people’s perceptions of their peers’ climate actions, which were distinct from general misestimations.
For example, people who were already involved in climate action, had more frequent climate discussions and consumed more climate-focused news and media predicted a higher proportion of climate support “across the board”.
The results from the fourth and fifth surveys show that knowing the context of other people’s beliefs and behaviour in surveys can impact the attitudes of participants.
Participants that were told that 68% of people were willing to donate 1% of their household income to the WWF were more willing to donate.
In contrast, participants that were told that 4% of people actually donated did not report more willingness to “discuss climate change, sign petitions or donate” than the control group.
However, there was no obvious impact on actual donations for any of the three groups, the study notes.
Lead study author Dr Kevin Tiede, scientific managing director of the Institute for Planetary Health Behaviour at the University of Erfurt, tells Carbon Brief that the findings suggest that “just telling people how many people support climate action is likely not enough to really change something”.
However, Tiede adds that “direct comparability” between people saying they would donate and actually donating is “limited” and that giving people more time to answer and autonomy over where to donate might result in more people taking action.
‘Pluralistic ignorance’
Tiede explains that the study findings demonstrate the existence of “pluralistic ignorance”, where a person believes their own views differ from the majority.
For climate change, this means that the “vast majority of people around the world support climate action, but people considerably underestimate the extent of this support”, the study says.
However, the surveys reveal that pluralistic ignorance “in the climate domain” is more nuanced than previously thought, say the authors.
Prof Madalina Vascleanu, an assistant professor at Stanford University’s Doerr School of Sustainability, who was not involved in the study, tells Carbon Brief that encouraging climate action is complex.
It may take multiple and repeated “attempts” at effective communication, or for people to directly “experience” the “norm” that climate change is widely supported, she says, rather than simply being told.
“Observable” behaviours, such as “identity signalling” – which could involve anything from protesting to vegetarianism – might have more of an impact on encouraging climate action among peers than “private behaviours like donations”, she adds.
The study is a “great addition to the literature”, Vascleanu says, because “correcting” the perception gap did not have an effect on climate-friendly behaviour, as “scholars had previously assumed”. She adds that it has “sparked several new hypotheses” that her “lab is now working on”.
Prof Mauro Bertolotti, associate professor of social psychology at the Università Cattolica del Sacro Cuore, explains that the “attitude-behaviour gap” revealed by the research is a “rather common finding”.
However, he is “sceptical” of the “simplified and abstract” measures, warning that experiment environments often come with “assumptions and expectations” that are different from real life.
As a result, they might not “replicate” the process people go through when choosing to “make a donation to an environmental cause”, he says.
‘Targeted’ communication strategies
The researchers argue that it is more effective to focus on “targeted” communication strategies – encouraging climate-friendly behaviours that aim to reach the majority who already support climate action, rather than trying to convert climate sceptics.
They call for attention to be paid to the attitude-behaviour gap between people saying they support efforts to tackle climate change and following up with real-world climate actions.
The study suggests strategies for decision-makers to reduce the attitude-behaviour gap, such as “facilitating climate-friendly behaviour” with “convenience and subsidies”. They also recommend ensuring environmental policy prioritises fairness to gain visible and widespread public support.
They add that the public would benefit from understanding the “effectiveness and co-benefits” of climate action.
Tiede, K.E. et al. (2026) People systematically under- and overestimate public engagement in climate action, Nature Climate Change, https://doi.org/10.1038/s41558-026-02668-z
Related
Scientists are ‘most trusted’ source of climate information in global-south survey

Survey: ‘Very few’ Africans place responsibility for climate action on ‘rich nations’
Guest post: How public attitudes towards ‘CO2 removal’ differ in the UK and US
Guest post: How ‘discourses of delay’ are used to slow climate action
The post Correcting climate ‘misperceptions’ may not boost climate action appeared first on Carbon Brief.
Correcting climate ‘misperceptions’ may not boost climate action

‘Ride the wave of momentum’: Australia announces once-in-a-decade Marine Parks Network review

Factcheck: No, Europe is not having its ‘quietest’ year for wildfires
Correcting climate ‘misperceptions’ may not boost climate action
-
Greenhouse Gases12 months ago
Guest post: Why China is still building new coal – and when it might stop
-
Climate Change12 months ago
Guest post: Why China is still building new coal – and when it might stop
-

 Greenhouse Gases2 years ago
嘉宾来稿:满足中国增长的用电需求 光伏加储能“比新建煤电更实惠”
-

 Climate Change2 years ago
嘉宾来稿:满足中国增长的用电需求 光伏加储能“比新建煤电更实惠”
-
Climate Change2 years ago
Bill Discounting Climate Change in Florida’s Energy Policy Awaits DeSantis’ Approval
-

 Renewable Energy9 months ago
Sending Progressive Philanthropist George Soros to Prison?
-

 Carbon Footprint2 years ago
US SEC’s Climate Disclosure Rules Spur Renewed Interest in Carbon Credits
-
Greenhouse Gases1 year ago
嘉宾来稿:探究火山喷发如何影响气候预测