The global carbon credit market in 2024 remained stagnant, valued at around US$1.4 billion, per MSCI report. Demand for carbon credits—measured by the number of credits “retired” or permanently used—did not grow significantly. Carbon prices, meanwhile, continued to fall.
However, the market is showing signs of potential growth. With more companies committing to ambitious climate goals and new policies emerging, experts believe the market could expand significantly.
- By 2030, the market is projected to reach between $7 billion and $35 billion, and by 2050, it could climb to $250 billion.
Carbon Credits in 2024: Key Numbers
Carbon credits allow businesses and governments to offset their greenhouse gas emissions. Each credit represents one ton of carbon dioxide either reduced or removed from the atmosphere. These credits come from a variety of projects, including:
- Nature-Based Solutions: Reforestation, forest conservation, and soil carbon storage.
- Renewable Energy: Projects like wind and solar farms that replace fossil fuel-based energy.
- Carbon Capture Technologies: Direct air capture or storing carbon in the soil through biochar.
When companies buy and retire these credits, they use them to meet their climate targets, like achieving net-zero emissions.
By the end of 2024, the carbon credit market had grown in some areas, even if overall demand remained flat. The MSCI report shows the following achievements last year:
- Projects: Over 6,200 carbon credit projects were registered worldwide.
- Issuance: These projects issued 305 million tons of credits (MtCO2e) in 2024 alone, bringing the total to over 2.1 billion credits since the 2016 Paris Agreement.
- Retirements: Only 180 million credits were retired in 2024, roughly the same as in 2023.
Of the credits retired in 2024:
- 91% came from projects that reduce emissions (e.g., renewable energy or forest protection).
- 9% came from projects that remove carbon from the atmosphere, such as reforestation.

Falling Prices
Despite the growing number of carbon credits issued, their prices have dropped. In 2024, the average price of a carbon credit fell to just $4.8 per ton, a 20% decline compared to 2023.
Prices vary depending on the type of credit:
- Nature-Based Projects: These often fetch higher prices because they are seen as more reliable and long-lasting.
- Technology-Based Projects: Carbon capture and other engineered solutions command even higher premiums due to their permanence and innovation.
Why the Market Is Stuck But Shows Signs of Growth
Even with more companies announcing climate goals, the carbon credit market has struggled. Several factors have contributed to this stagnation.
One is the concern about quality. Questions about the reliability and impact of some projects have undermined trust. Another is the lack of urgency as many companies have climate targets set far into the future, reducing the immediate need to buy credits.
Lastly, negative publicity also impacted carbon credit markets heavily. Reports of fraud and overestimated project impacts have hurt the market’s credibility. As a result, demand (retired credits in the chart) has remained steady but unimpressive, and prices continue to drop.
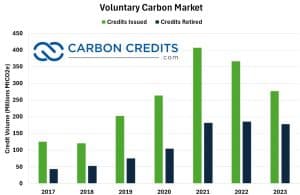
Despite these challenges, there are promising signs that the carbon credit market could soon expand.
In 2024, more climate commitments were reported. Over 2,700 companies set science-based climate targets, a 65% increase from 2023. As deadlines approach, many companies will need to rely on carbon credits to meet their goals.
Additionally, policy improvements and new standards like the Core Carbon Principles (CCPs) aim to improve the quality and integrity of carbon projects. These alleviated trust in the market.
These factors could boost demand for high-quality credits and push the market out of its current stagnation. So, what does this year look like for carbon credits?
2025: A Year of Transition
The year 2025 and beyond hold immense potential for growth and impact. It marks a pivotal moment for the carbon market as it transitions toward greater maturity and alignment with global climate goals.
Demand for carbon credits could rise steadily, driven by companies ramping up efforts to meet their 2030 emissions reduction targets. As more organizations integrate carbon offsets into their climate strategies, the emphasis will shift toward high-quality carbon removal credits (CDR), which are increasingly considered essential for achieving net-zero emissions.
According to the Deloitte report, robust CDR credit sales and high prices highlight market confidence in carbon dioxide removal methods for achieving tangible removals. Elevated pricing offers a potential revenue stream. This enables emerging renewable energy providers to collaborate with CDR projects and secure a share of the generated credits.
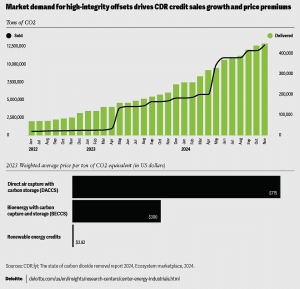
This growing demand is likely to push prices higher, especially for credits that meet stringent integrity and additionality standards.
The aviation sector is anticipated to emerge as a significant player in the carbon market. The Carbon Offsetting and Reduction Scheme for International Aviation (CORSIA) will enter its first mandatory phase in 2027, but airlines could begin preparing earlier by purchasing credits to offset their emissions. This development will further bolster demand and drive innovation within the voluntary carbon market.
Policy advancements will also play a crucial role in shaping the market in 2025. The continued implementation of Article 6 of the Paris Agreement, alongside national regulations like the EU’s Green Claims Directive and the U.S. transparency laws, will provide clearer guidelines for credit use and enhance market credibility.
However, challenges persist, including addressing fragmented market standards and ensuring robust monitoring and verification systems.
As the carbon market evolves, 2025 will serve as a year of progress and adjustment. This year will lay the groundwork for a more transparent, efficient, and impactful mechanism to combat climate change.
Beyond 2025: Projections for 2030 and 2050
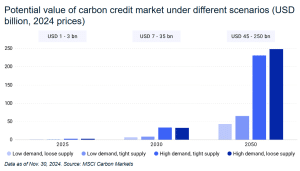
By 2030, the carbon credit market could grow significantly, reaching between $7 billion and $35 billion, according to the MSCI analysis shown above. Several trends are driving this potential growth:
- Rising Demand for Carbon Removal Credits: These tend to be more expensive but are considered more credible.
- Corporate Climate Goals: Companies with ambitious targets for 2030 will likely rely more on carbon credits to bridge the gap between their emissions and goals.
- Higher-Quality Credits: Buyers are increasingly choosing credits from projects with higher standards and transparency, which boosts trust in the market.
MSCI’s long-term outlook for carbon credits is even more optimistic. By 2050, the market could be worth between $45 billion and $250 billion, driven by:
- Urgent Corporate Demand: Many companies will be nearing their net-zero deadlines by 2050, increasing the need for offsets.
- Shift to Removal Credits: Around two-thirds of the market value by 2050 could come from credits that actively remove carbon.
- Engineered Solutions: Technologies like direct air capture could become key players, with their market value potentially reaching $42 billion.
A Market Worth Watching
The carbon credit market may be stuck for now, but the outlook is promising. With stricter standards, growing corporate commitments, and innovative solutions, the market is poised for growth. As 2030 approaches, the demand for high-quality credits is likely to rise, thawing the frozen market and creating new opportunities for businesses and investors alike.
- READ MORE: Is the Voluntary Carbon Market Dead?
The post Carbon Credits in 2024: What to Expect in 2025 and Beyond ($250B by 2050) appeared first on Carbon Credits.
Carbon Footprint
The real cost of 1 tonne of CO2: Translating carbon into hectares
Every business carbon footprint report ends with a number, the amount of carbon emissions produced by the business, less the amount of carbon reduced and offset, given in tonnes of CO₂. Many of the people who sign off on that number, including those who paid for it, cannot picture what it represents on the ground. A tonne is a unit of mass. CO₂ is invisible. The link between the amount offset in the report and a real piece of restored forest somewhere in the world is almost never indicated.
![]()
Carbon Footprint
Finding Nature Based Solutions in Your Supply Chain
Carbon Footprint
How Climate Change Is Raising the Cost of Living
Americans are paying more for insurance, electricity, taxes, and home repairs every year. What many people may not realize is that climate change is already one of the drivers behind those rising costs.
For many households, climate change is no longer just an environmental issue. It is becoming a cost-of-living issue. While climate impacts like melting glaciers and shrinking polar ice can feel distant from everyday life, the financial effects are already showing up in monthly budgets across the country.
Today, a larger share of household income is consumed by fixed costs such as housing, insurance, utilities, and healthcare. (3) Climate change and climate inaction are adding pressure to many of those expenses through higher disaster recovery costs, rising energy demand, infrastructure repairs, and increased insurance risk.
The goal of this article is to help connect climate change to the everyday financial realities people already experience. Regardless of where someone stands on climate policy, it is important to recognize that climate change is already increasing costs for households, businesses, and taxpayers across the United States.
More conservative estimates indicate that the average household has experienced an increase of about $400 per year from observed climate change, while less conservative estimates suggest an increase of $900.(1) Those in more disaster-prone regions of the country face disproportionate costs, with some households experiencing climate-related costs averaging $1,300 per year.(1) Another study found that climate adaptation costs driven by climate change have already consumed over 3% of personal income in the U.S. since 2015.(9) By the end of the century, housing units could spend an additional $5,600 on adaptation costs.(1)
Whether we realize it or not, Americans are already paying for climate change through higher insurance premiums, energy costs, taxes, and infrastructure repairs. These growing expenses are often referred to as climate adaptation costs.
Without meaningful climate action, these costs are expected to continue rising. Choosing not to invest in climate action is also choosing to spend more on climate adaptation.
Here are a few ways climate change is already increasing the cost of living:
- Higher insurance costs from more frequent and severe storms
- Higher energy use during longer and hotter summers
- Higher electricity rates tied to storm recovery and grid upgrades
- Higher government spending and taxpayer-funded disaster recovery costs
The real debate is not whether climate change costs money. Americans are already paying for it. The question is where we want those costs to go. Should we invest more in climate action to help reduce future climate adaptation costs, or continue paying growing recovery and adaptation expenses in everyday life?
How Climate Change Is Increasing Insurance Costs
There is one industry that closely tracks the financial impact of natural disasters: insurance. Insurance companies are focused on assessing risk, estimating damages, and collecting enough revenue to cover losses and remain financially stable.
Comparing the 20-year periods 1980–1999 and 2000–2019, climate-related disasters increased 83% globally from 3,656 events to 6,681 events. The average time between billion-dollar disasters dropped from 82 days during the 1980s to 16 days during the last 10 years, and in 2025 the average time between disasters fell to just 10 days. (6)
According to the reinsurance firm Munich Re, total economic losses from natural disasters in 2024 exceeded $320 billion globally, nearly 40% higher than the decade-long annual average. Average annual inflation-adjusted costs more than quadrupled from $22.6 billion per year in the 1980s to $102 billion per year in the 2010s. Costs increased further to an average of $153.2 billion annually during 2020–2024, representing another 50% increase over the 2010s. (6)
In the United States, billion-dollar weather and climate disasters have also increased significantly. The average number of billion-dollar disasters per year has grown from roughly three annually during the 1980s to 19 annually over the last decade. In 2023 and 2024, the U.S. recorded 28 and 27 billion-dollar disasters respectively, both setting new records. (6)
The growing impact of climate change is one reason insurance costs continue to rise. “There are two things that drive insurance loss costs, which is the frequency of events and how much they cost,” said Robert Passmore, assistant vice president of personal lines at the Property Casualty Insurers Association of America. “So, as these events become more frequent, that’s definitely going to have an impact.” (8)
After adjusting for inflation, insurance costs have steadily increased over time. From 2000 to 2020, insurance costs consistently grew faster than the Consumer Price Index due to rising rebuilding costs and weather-related losses.(3) Between 2020 and 2023 alone, the average home insurance premium increased from $75 to $360 due to climate change impacts, with disaster-prone regions experiencing especially steep increases.(1) Since 2015, homeowners in some regions affected by more extreme weather have seen home insurance costs increased by nearly 57%.(1) Some insurers have also limited or stopped offering coverage in high-risk areas.(7)
For many families, rising insurance costs are no longer occasional financial burdens. They are becoming recurring monthly expenses tied directly to growing climate risk.
How Rising Temperatures Increase Household Energy Costs

The financial impacts of climate change extend beyond insurance. Rising temperatures are also changing how much energy Americans use and how utilities plan for future electricity demand.
Between 1950 and 2010, per capita electricity use increased 10-fold, though usage has flattened or slightly declined since 2012 due to more efficient appliances and LED lighting. (3) A significant share of increased energy demand comes from cooling needs associated with higher temperatures.
Over the last 20 years, the United States has experienced increasing Cooling Degree Days (CDD) and decreasing Heating Degree Days (HDD). Nearly all counties have become warmer over the past three decades, with some areas experiencing several hundred additional cooling degree days, equivalent to roughly one additional degree of warmth on most days. (1) This trend reflects a warming climate where air conditioning demand is increasing while heating demand generally declines. (4)
As temperatures continue rising, households are expected to spend more on cooling than they save on heating. The U.S. Energy Information Administration (EIA) projects that by 2050, national Heating Degree Days will be 11% lower while Cooling Degree Days will be 28% higher than 2021 levels. Cooling demand is projected to rise 2.5 times faster than heating demand declines. (5)
These projections come from energy and infrastructure experts planning for future electricity demand and grid capacity needs. Utilities and grid operators are already preparing for higher peak summer electricity loads caused by rising temperatures. (5)
Longer and hotter summers also affect how homes and buildings are designed. Buildings constructed for past climate conditions may require upgrades such as larger air conditioning systems, stronger insulation, and improved ventilation to remain comfortable and energy efficient in the future. (10)
For many households, this means higher monthly utility bills and potentially higher long-term home improvement costs as temperatures continue to rise.
How Climate Change Affects Electricity Rates
On an inflation-adjusted basis, average U.S. residential electricity rates are slightly lower today than they were 50 years ago. (2) However, climate-related damage to utility infrastructure is creating new upward pressure on electricity costs.
Electric utilities rely heavily on above-ground poles, wires, transformers, and substations that can be damaged by hurricanes, storms, floods, and wildfires. Repairing and upgrading this infrastructure often requires substantial investment.
As a result, utilities are increasing electricity rates in response to wildfire and hurricane events to fund infrastructure repairs and future mitigation efforts. (1) The average cumulative increase in per-household electricity expenditures due to climate-related price changes is approximately $30. (1)
While this increase may appear modest today, utility costs are expected to rise further as climate-related infrastructure damage becomes more frequent and severe.
How Climate Disasters Increase Government Spending and Taxes
Extreme weather events also damage public infrastructure, including roads, schools, bridges, airports, water systems, and emergency services infrastructure. Recovery and rebuilding costs are often funded through taxpayer dollars at the federal, state, and local levels.
The average annual government cost tied to climate-related disaster recovery is estimated at nearly $142 per household. (1) States that frequently experience hurricanes, wildfires, tornadoes, or flooding can face even higher public recovery costs.
These expenses affect taxpayers whether they personally experience a disaster or not. Climate-related recovery spending can increase pressure on public budgets, emergency management systems, and infrastructure funding nationwide.
Reducing Climate Costs Through Climate Action
While this article focuses on the growing financial costs associated with climate change, the issue is not only about money for many people. It is also about recognizing our environmental impact and taking responsibility for reducing it in order to help preserve a healthy planet for future generations.
While individuals alone cannot solve climate change, collective action can help reduce future climate adaptation costs over time.
For those interested in taking action, there are three important steps:
- Estimate your carbon footprint to better understand the emissions connected to your lifestyle and activities.
- Create a plan to gradually reduce emissions through energy efficiency, cleaner technologies, and more sustainable choices.
- Address remaining emissions by supporting verified carbon reduction projects through carbon credits.
Carbon credits are one of the most cost-effective tools available for climate action because they help fund projects that generate verified emission reductions at scale. Supporting global emission reduction efforts can help reduce the long-term impacts and costs associated with climate change.
Visit Terrapass to learn more about carbon footprints, carbon credits, and climate action solutions.
The post How Climate Change Is Raising the Cost of Living appeared first on Terrapass.
-
Climate Change10 months ago
Guest post: Why China is still building new coal – and when it might stop
-
Greenhouse Gases10 months ago
Guest post: Why China is still building new coal – and when it might stop
-
Greenhouse Gases2 years ago嘉宾来稿:满足中国增长的用电需求 光伏加储能“比新建煤电更实惠”
-

Climate Change2 years ago嘉宾来稿:满足中国增长的用电需求 光伏加储能“比新建煤电更实惠”
-
Climate Change2 years ago
Bill Discounting Climate Change in Florida’s Energy Policy Awaits DeSantis’ Approval
-
Renewable Energy7 months agoSending Progressive Philanthropist George Soros to Prison?
-
Carbon Footprint2 years agoUS SEC’s Climate Disclosure Rules Spur Renewed Interest in Carbon Credits
-
Greenhouse Gases11 months ago
嘉宾来稿:探究火山喷发如何影响气候预测

