
Regulators insist they’re committed to protecting health and the environment, yet continue to allow growers to use a deadly chemical banned in 40 countries.
California regulators passed a rule in January 2024 that they said would protect communities from one of the state’s most popular, and dangerous, pesticides.
The annual June climate talks in Bonn are taking place this year against the backdrop of an oil and gas supply crisis tied to the Iran war and deadly heatwaves in Europe, India and the Middle East. Can they produce anything substantial to ease the squeeze on economies and communities around the world?
Watchers of the negotiations say the UN climate process is under pressure to prove its worth at a time when climate action and clean energy offer an increasingly attractive alternative to the global economic and political instability brought by fossil fuel dependency.
Kaysie Brown, associate director of climate diplomacy and geopolitics at think-tank E3G, said the June 8-18 meetings “must show that the multilateral system can make a durable and politically resilient shift to support delivery [of climate action] at scale”. She added that it “will act as a key health check for the climate regime at a time of a rapidly shifting global order”.
-
Investor climate group closes down, blaming “limits” of shareholder activism
Canadian campaign group Investors for Paris Compliance shut in May, saying efforts to push companies to tackle climate change have become less effective -
Santa Marta process can confront trade protection for fossil fuels, experts say
Academics at the first fossil fuel phase-out summit urged governments to recognise investor protection treaties as a barrier to the energy transition


There are hopes for significant progress on issues ranging from a new mechanism to support a just transition away from fossil fuels, to funding and measuring adaptation to worsening climate impacts.
Bonn will also see the launch of dialogues on trade and climate change, on how to implement what was promised in the first stocktake of national climate plans in 2023, and on ways to shift global finance flows to support a low-carbon and climate-resilient world.
Climate Home News doesn’t have a crystal ball, but we have done our homework. Here’s what experts expect to top the agenda at the World Conference Center by the River Rhine:
COP31 priorities
Bonn is where we will get a sense of what the joint COP31 hosts – Türkiye and Australia – want from their presidency. Signs are that they will push for a global goal on the share of final energy consumption that will come from electricity, which may be based on a target proposed by the International Renewable Energy Agency of 35% by 2035.
Watch back: Webinar – From Santa Marta to Bon, where next for the fossil fuel transition?
Other priorities already identified include energy storage, energy security and clean cooking. Türkiye has stressed reducing emissions from landfills as a priority for the “Action Agenda” strand of COP31, which encompasses government and business initiatives outside the formal discussions. Türkiye will lead on the Action Agenda, while Australia handles the negotiations.
Just transition mechanism
The Bonn negotiations are tasked with producing a draft decision on how to set up a new just transition mechanism that can facilitate a fair and orderly shift from a high-carbon world to a greener future. This decision will be forwarded for approval by countries at COP31.
Governments agreed at COP30 in Brazil to set up what civil society has dubbed the “Belém-Antalya Mechanism” (BAM) but the details have yet to be worked out. Climate Action Network International, which has advocated strongly for the global mechanism, said it should be designed to provide decent jobs, social protection, public investment, energy access and support for affected workers and communities.
“If governments move decisively, the [BAM] could become one of the most significant developments in the climate regime since the Paris Agreement – helping connect climate action with economic transformation and tangible improvements in people’s daily lives,” the coalition of hundreds of green groups said in a statement ahead of Bonn.
Let’s talk trade
At COP30, after two years of trying, emerging economies finally got the overlap between trade and climate policy onto the UN climate talks agenda. Governments agreed to hold dialogues on trade at the June Bonn talks in 2026, 2027 and 2028 before a summary of these dialogues is presented at a “high-level event” in 2028.
What aspects of trade are to be discussed at the first such dialogue on Saturday June 13 is undecided. Developing-country heavyweights like China and India will likely be keen to criticise the European Union’s new carbon border adjustment mechanism, which they regard as protectionist and burdensome for their exporters. Representatives of the World Trade Organization and other trade bodies will make presentations, which governments and civil society will be allowed to comment upon.
On Sunday June 14, a separate meeting of the fledgling Integrated Forum on Climate Change and Trade – an initiative launched by the Brazilian COP30 Presidency – will take place in a grand hilltop hotel overlooking Bonn and the Rhine. The meeting is not part of the official UN climate process or the official Bonn talks and will be more informal than the previous day’s dialogue.
Topics that will be discussed are trade and climate adaptation, how to create a level playing field for low-carbon products, how to trade particularly polluting products and how to bridge climate and trade tools. An expert panel chaired by South Africa’s Faizel Ismail and New Zealand’s Jo Tyndall has been appointed to advise the forum.
Aligning on adaptation
At COP30, talks on finalising a list of indicators to measure progress on adapting to climate change ended in recriminations, with several Latin American governments complaining that the decision was adopted by the Brazilian presidency without their consent.
The indicators, which were developed by experts in a two-year process, were stripped down by the Brazilians on the last night of COP30 and presented to governments at the last minute as a done deal.
New data shows rich nations likely missed 2025 goal to double adaptation finance
Several governments and some of the technical experts have argued that many of the adopted indicators are unworkable, as they lack definitions or explanations of how they will be measured. Many indicators for important areas – like poverty reduction, ecosystems, infrastructure and food production – are missing or inadequate, they say.
Government negotiators and experts now have two years to fix the mess, through a “policy alignment process” due to end at COP32 in Ethiopia. At the Bonn talks, governments will try to agree on who will make up a new taskforce of experts to help countries put the indicators into practice and how it will operate.
Mission to 1.5 and Global Implementation Accelerator
After pressure from small island nations, governments at COP30 agreed to set up the Belém Mission to 1.5 and the Global Implementation Accelerator (GIA) to speed up the implementation of countries’ emissions-cutting and adaptation plans.
For the Mission to 1.5, several past and current COP presidencies are drawing up a report – scheduled to be published before COP31 – which will identify several especially impactful solutions to climate change. On June 12 in Bonn, governments and civil society will weigh in on what they want included.
Also in Bonn, governments will input into the GIA. The Brazilian COP30 Presidency’s vision is that it should drive forward the strongest climate solutions. According to COP30 CEO Ana Toni, an independent panel of experts will pre-select 10-15 solutions and a council will narrow this down to three to five each year which the GIA would then aim to speed up.
The GIA’s “added value is that it will focus exclusively on solutions with the potential to scale and generate cascading effects through high-impact exponential technologies”, she said last month.

Whether Mission to 1.5 and the GIA will identify the same shortlist of solutions – and how they work together – is unclear. But the GIA could become a permanent body working on the real-world “Action Agenda” of COPs.
Ruenna Haynes is the deputy lead negotiator for the small islands group (AOSIS) which pushed for these two initiatives, but she is now worried about what the COP presidencies might make of them.
She told a recent briefing, “the last thing we want to do is to set up a process that is nothing more than a talking shop that doesn’t deliver and doesn’t go anywhere”. To avoid that, the reports of the GIA and Mission 1.5 must be linked to the wider UN climate talks process and at least discussed by governments, she emphasised.
Finance roadmap and dialogue
COP30 left a bitter taste regarding what was expected to be one of its main outcomes: progress on how to increase climate finance through the “Baku to Belém Roadmap to $1.3 trillion”. The initiative, included in the new finance goal agreed in Baku – the NCQG – was an effort to top up the 2035 target of $300 billion a year in public finance which fell short of what developing countries wanted and an independent panel of experts estimated would be needed.
The high expectations surrounding this roadmap began to fade during 2025 as the process lacked transparency, clarity, participation and ambition. The result was a report abundant in general recommendations of actions to be taken but lacking clear commitments. Most of the suggestions mentioned are targeted at institutions outside the UN climate process, such as multilateral development banks.
The COP30 decision merely “took note of” that report. So was it the end of the road for this particular roadmap? Not yet.
From Baku to Belém and beyond: How we turn a climate finance roadmap into reality
In Bonn, an “implementation” meeting will be held to “listen to the Parties and observers on the updated work being carried out,” as a member of the COP30 Presidency team told Climate Home News. The challenge is how to ensure the roadmap doesn’t remain fine words in a document and is put into practice. It will also serve either as a good or bad example for the other two voluntary roadmaps (on deforestation and fossil fuels) that the Brazilian presidency is putting together ahead of COP31.
Also in Bonn, the Veredas Dialogue will address the opportunities and obstacles to implementing Article 2.1.c of the Paris Agreement – on making finance flows consistent with low-carbon development – and its complementarity with Article 9 on the responsibility of developed countries to provide financial resources. The limitations of the Baku to Belém Roadmap could shift the divisions between developed and developing nations to this dialogue, especially considering that 2026 is the first year for mobilising finance under the NCQG.
More roadmaps on fossil fuels and forests
At COP30, a group of 80 countries led a failed push to kickstart a process for a global roadmap to guide the transition away from fossil fuels (TAFF). As an alternative, the Brazilian presidency proposed to draft two voluntary roadmaps: one on phasing out fossil fuels and another to end deforestation by 2030, both commitments endorsed by all countries in the COP28 deal.
In the lead-up to Bonn and after months of consultations with countries, Brazil presented an outline for the forest roadmap – which will invite countries to submit their own voluntary national roadmaps to halt forest loss.
It will also include a menu of options to bridge the $216-billion forest funding gap. One of the key initiatives to achieve this is the new rainforest fund, the Tropical Forest Forever Facility (TFFF), which is still rallying investors for seed funding. Brazil convened an investor meeting in Rotterdam last week, with participation from over 50 financial institutions – including BlackRock, Bank of America and Barclays – and 30 government representatives.
COP30 rainforest fund unlikely to make first payments until 2028
While not on the formal negotiating agenda In Bonn, Brazil will continue consultations on the forest roadmap at an event with governments on June 8. The final document is expected to be published later in September.
As for the TAFF roadmap, Brazil will hold an open event on June 12 after receiving suggestions from 120 countries. It is expected to be informed by the first global fossil fuel phase-out summit held in Santa Marta in April.
COP30 advisor Flávia Bellaguarda told an online briefing that the informal sessions in Bonn are meant to open a “space for dialogue” on both roadmaps, and that the more countries engage, the more international relevance the process gains.
“We managed to get the elephant into the room. Now, it needs to stay there. For that, we need to give him plenty of food so he can’t fit through the door and leave. We achieve that with dialogue and creating space for genuine exchange,” the Brazilian advisor said.
The post What to expect from the Bonn climate talks appeared first on Climate Home News.
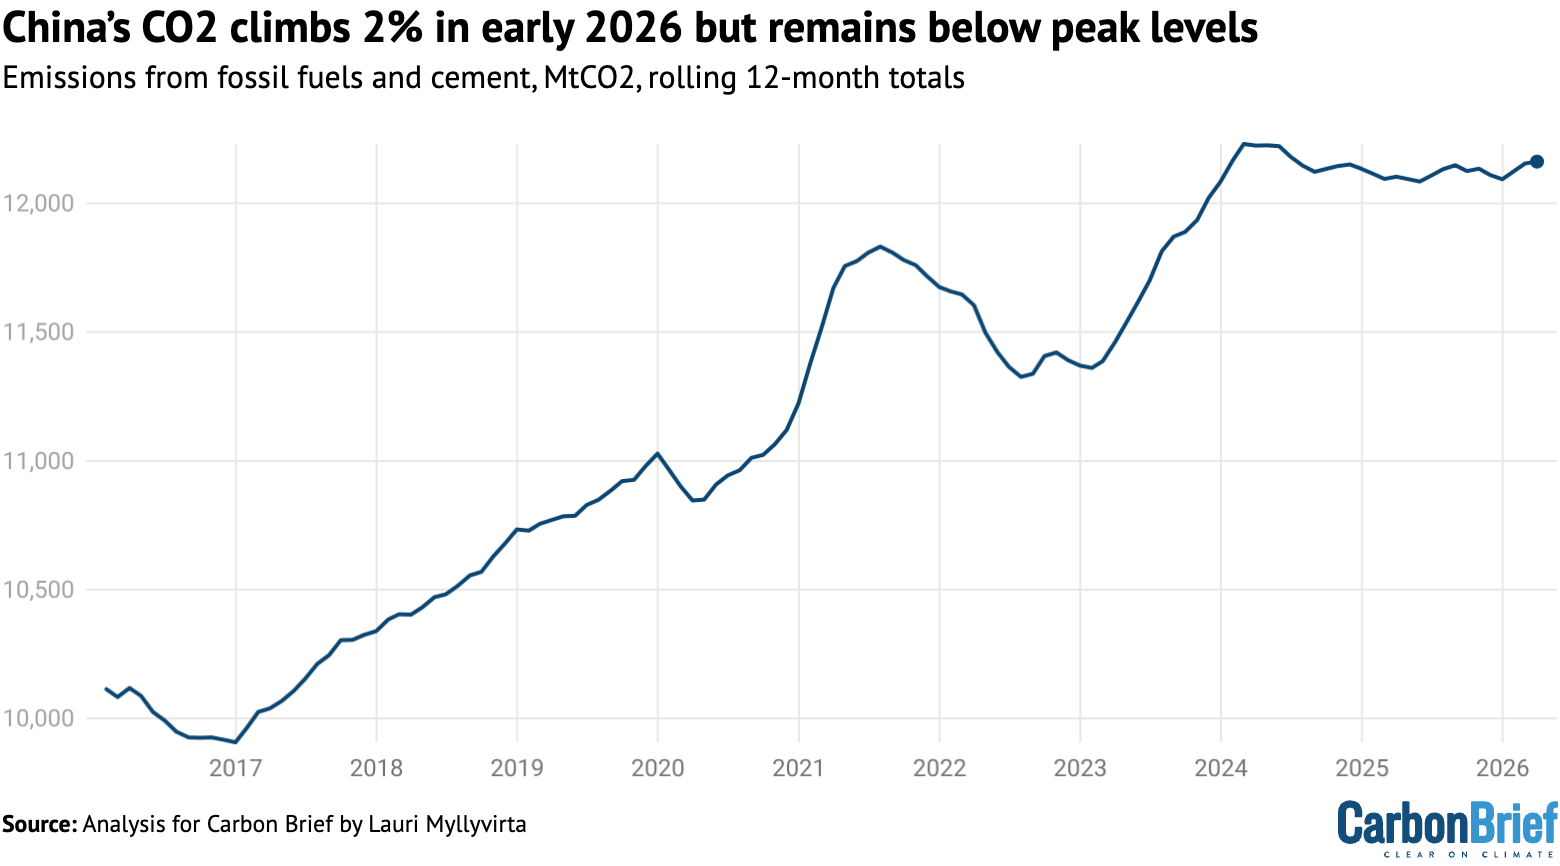
China’s carbon dioxide (CO2) emissions grew by 2% in the first quarter of 2026, after a rise in the amount of “wasted” wind and solar power.
The country used more coal and gas to generate electricity than in the same quarter a year earlier, despite a record amount of new wind and solar capacity being built.
While the strait of Hormuz crisis has boosted China’s focus on energy security – including through clean energy and electrification – its electricity system is failing to keep up.
The new analysis for Carbon Brief shows that, while China’s CO2 emissions from fossil fuels and industry increased in the first part of 2026, they remain below the peak in early 2024.
Other key findings for the first quarter of 2026 include:
- There was a 23% year-on-year rise in wind-power capacity and 33% for solar.
- There was also a sharp rise in the amount of wind and solar output being “wasted”, as it was not accommodated by the current electricity system.
- As a result, emissions in the power sector increased by 4% year-on-year.
- Power-sector CO2 would have been flat without the rise in “wasted” wind and solar.
- Emissions in other sectors of the economy grew by 1%.
The key reason for “wasted” wind and solar generation was the inflexible management of coal power plants and power grids, not a lack of grid infrastructure.
In the first quarter of 2026, China’s energy system also began to adjust to the surge in oil and gas prices due to the blockade of the strait of Hormuz.
This continued through April and May, with sharp reductions in oil imports and oil-based chemicals production, as well as the share of gas in electricity generation.
However, the inability to make full use of new wind and solar power plants left China more exposed to the closure of the strait of Hormuz, by increasing the need for other fuels.
This exposure could become more acute if the “super El Niño” that is forecast for later this year limits the electricity output of hydropower, while fossil-fuel supplies remain tight.
Nevertheless, the Hormuz crisis could result in China following a lower-CO2 trajectory than previously expected, if key policies in its 15th five-year plan are fully implemented.
Emissions plateau continues
Recent analysis for Carbon Brief showed that China’s CO2 emissions from fossil fuels and industry had been “flat or falling” for nearly two years.
The latest analysis points to a rise of 2% year-on-year in the first quarter of 2026, as shown in the figure below. For now, however, emissions remain below the peak in March 2024.
In previous quarters, emissions had fallen in almost every sector of the economy, with the exception of the coal-based chemicals industry.
The latest quarter saw more widespread increases, with the power sector by far the largest source of emissions growth, as shown in the figure below.
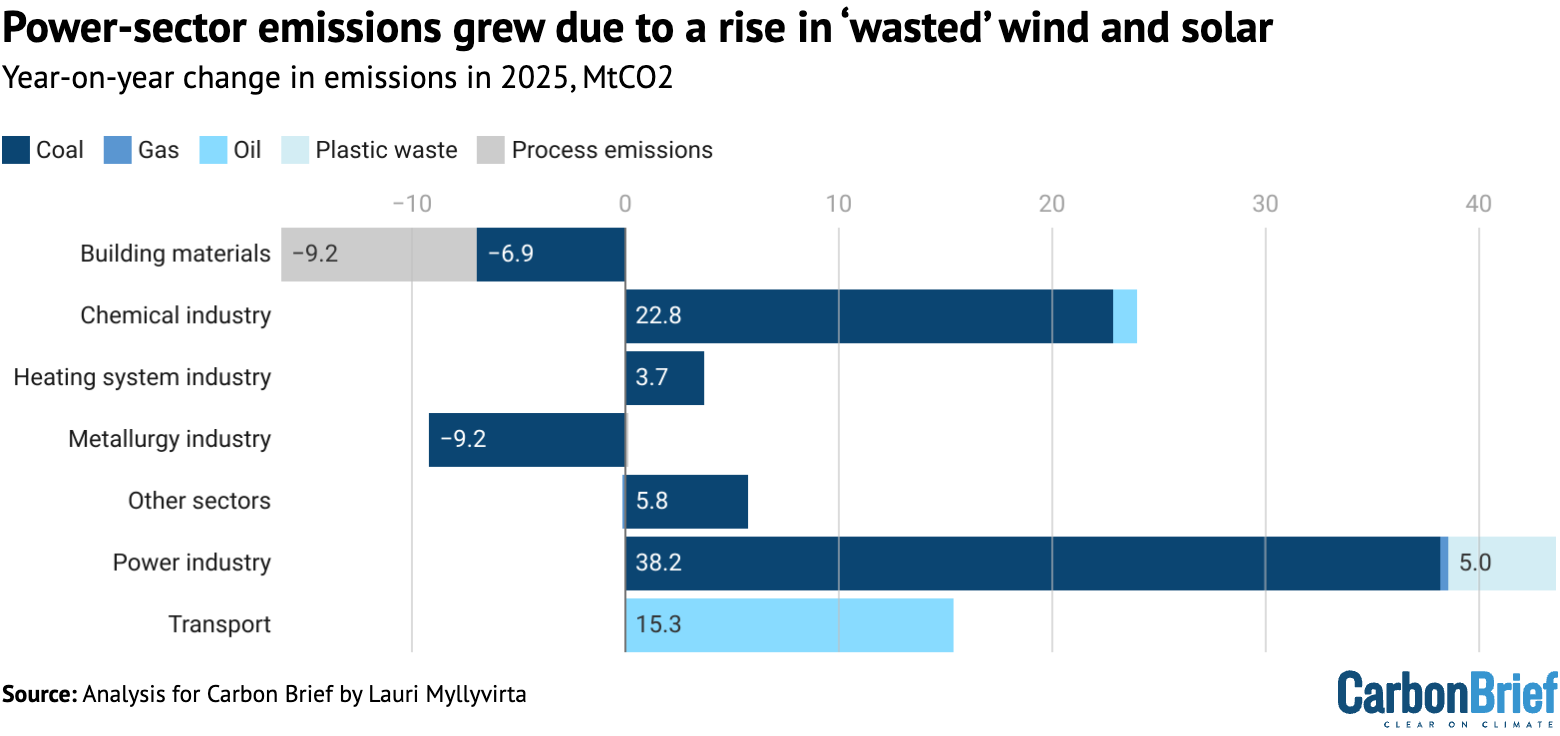
Emissions from other sectors were relatively stable in aggregate, with some rising and others continuing to decline.
Coal consumption in the chemical industry continued strong growth, increasing by 20%, but showed no change in trend after the closure of the strait of Hormuz and surge in oil prices.
(This is contrary to some commentary arguing that the closure of the strait of Hormuz has resulted in a marked increase in the output of China’s coal-chemicals industry.)
The apparent consumption of oil products rebounded in January-February, driven by transportation, but declined slightly in March as oil prices surged.
Emissions from the cement and steel industries continued to fall, as real estate investment contracted another 11% in the first quarter of 2026, following a 17% reduction in 2025. Cement production fell 7% and crude steel output by 5%.
‘Wasted’ wind and solar power
After falling in 2025, power generation from coal and gas increased by 4% in the first quarter of the year.
Power demand grew at 5.2% and hydropower generation increased 9%. Under these circumstances, the record growth in solar and wind power capacity in 2025 should have covered demand growth and pushed fossil-power generation down.
The trend was accentuated in March, as power demand grew just 3.5%, hydropower output increased 9% and yet fossil-power generation increased 4.2%.
The reason for fossil-power generation growth was a sharp drop in the electricity output per unit of installed capacity for both solar and wind power, known as the “capacity factor”.
If capacity factors were stable, the increased solar and wind capacity would have been expected to result in 160 terawatt hours (TWh) of additional clean-power generation during the first quarter, compared with the same time last year, with nuclear and hydro bringing the total to 170TWh. This would have comfortably exceeded the 120TWh increase in power demand.
However, the actual increase in clean-power generation was just 60TWh, with wind showing almost no growth.
While wind power capacity grew by 23% from the first quarter of 2025 to the same period in 2026, an increase of 120GW, the average capacity factor fell from 27% to 22%, a reduction of 18%. This implies that power generation from wind only grew 1% year-on-year. In the case of solar, capacity grew by 33%, but the average capacity factor fell by 11%, resulting in 18% growth in solar-power generation.
It is normal for solar and especially wind capacity factors to vary year-to-year due to weather conditions, but the fall this year was an extension of a longer trend. The average capacity factors of solar and wind have fallen by 19% and 10%, respectively, from 2022 to 2025.
A quarter of the fall in capacity factors over the three-year period is explained by the increase in reported curtailment. This refers to the amount of electricity that is effectively “wasted”, or curtailed, because it cannot be accommodated by the power network.
Nor can the remainder of the fall in capacity factors be explained by the change in weather conditions, as both wind and solar conditions improved on a national-average basis from 2022 to 2025.
In the first quarter of 2026, approximately half of the drop in wind capacity factor and a quarter of the drop in solar capacity factor was explained by weather conditions, implying that the rest is due to increased curtailment resulting from inadequate grid management and integration.
One clear symptom of increased curtailment is that in January-February, both solar and wind conditions were actually better than last year, but capacity factors still fell.
The fact that capacity factors have fallen significantly more than would be expected based on reported curtailment and weather conditions indicates that a lot of curtailment goes unreported, either because it is excluded from the statistical definition, or because there are gaps in reporting.
Market participants have long noted that actual curtailment is much higher than reported in official statistics.
Official data on curtailment only includes “system reasons”, while excluding some lost generation linked to market trading, grid-connection conditions and other “special” causes.
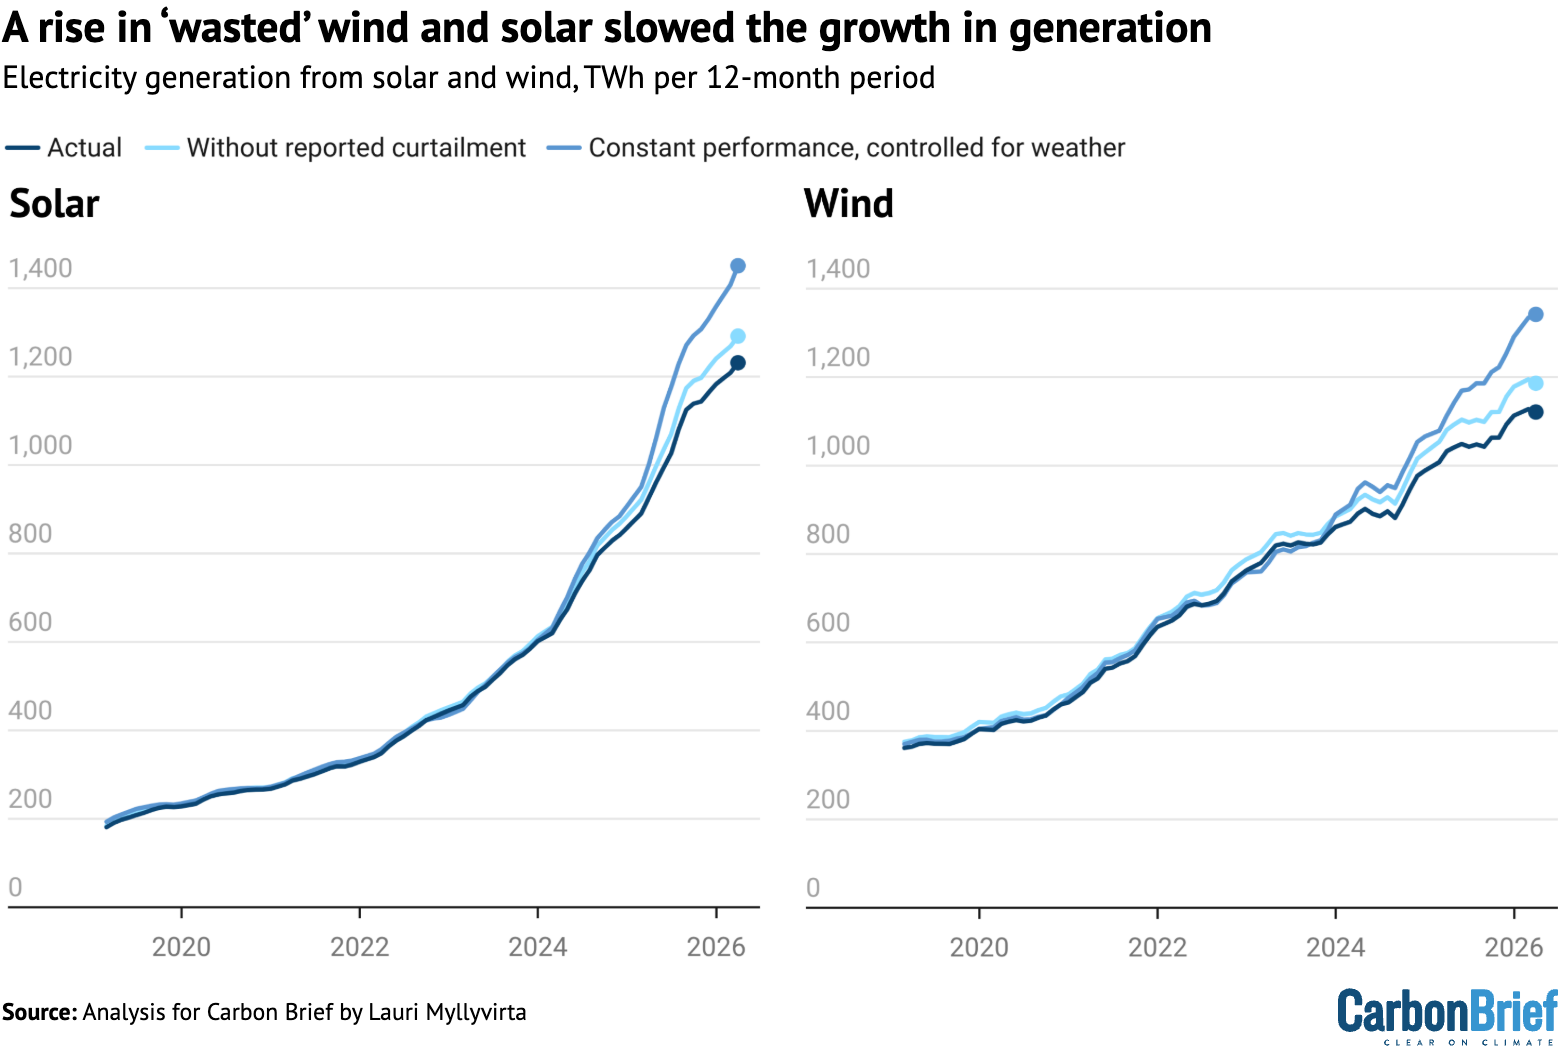
The figure below shows actual electricity generation from wind and solar plants (dark blue), the amount that would have been generated if reported curtailment had not taken place (light blue) and the level expected if the rate of curtailment had stayed the same (mid-blue).
In total, wind and solar could have generated an extra 170TWh of electricity in the first quarter of 2026, if the rate of curtailment had not gone up in the preceding years. This is more than the total power generation of France over the same period.
The largest reductions in capacity factors, after controlling for variations in weather conditions, came from Inner Mongolia, Xinjiang and Liaoning. In these northern provinces, the heating season is a challenging time for grid managers due to inflexible operation of plants that provide both heat and power.
More broadly, the key reason for curtailment is inflexible grid management. Flexible operation of coal and gas-fired power plants could very substantially increase the amount of solar and wind power the grid can accommodate.
Yet currently, coal-fired power generation is largely operated via medium- and long-term contracts to supply fixed amounts of electricity at fixed prices, meaning there is no incentive for adjustments in output to make space for solar and wind.
Similarly, electricity trading between provinces is predominantly contracted annually, preventing the variable output of solar and wind from being transmitted between jurisdictions in real time.
These issues have a clear impact on the amount of wind and solar that is curtailed. For example, power-system modeling carried out for the year 2023 indicates that flexible power-grid operation would have essentially eliminated the need for curtailment.
The government has also recognised solar and wind curtailment as one of the central challenges of the energy transition.
Recent policies have called for increased inter-province trading and improved flexibility of coal-power plants as the solutions, implicitly recognising these as key issues to address.
Recent large increases in storage capacity, including pumped hydro and batteries, should have improved the integration of wind and solar into the grid. But there is a lack of incentives for storage operators that limits the benefits the system can derive from the technology.
The government has implicitly recognised this and called for establishing electricity pricing that enables energy storage to “participate fairly”.
Meanwhile, China’s new renewable-pricing rules, which shifted existing solar and wind plants to selling electricity on the market, rather than being compensated directly by the grid operator, does not seem to have reduced curtailment so far.
Most provinces only finalised their plans for implementing the policy in late 2025, which left little time for the market and operators to adapt.
China is aiming to build a “new type power system”, capable of integrating large amounts of wind and solar into the grid by 2027. In the meantime, the government has also called for “reasonably pacing” utility-scale “new energy” capacity additions to match the pace at which provinces think they are able to improve the “regulation capacity” of their grids.
How the Hormuz crisis is affecting China’s energy sector
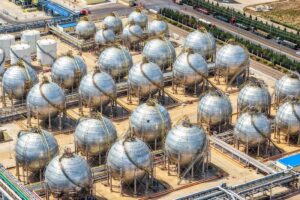
China’s energy system has started, since March, to adjust to the surge in oil and gas prices triggered by the closure of the strait of Hormuz. There have been sharp reductions in oil imports, the share of gas in thermal power generation and in oil-based chemical production.
The consumption of gas fell overall in March, even as consumption in the power sector increased. The power sector fuel mix shifted from gas to coal, but the increase in overall thermal power generation still pushed gas use up in the sector.
High gas prices had already been straining household finances before the current crisis. Millions of households were shifted from coal stoves to gas-based heating as a part of efforts to tackle air pollution during the past decade. However, the gas-price subsidies created to enable this shift have expired in recent years, leading to a rise in heating bills.
China’s oil imports started falling sharply immediately after oil prices surged, with net imports falling even further as exports were restricted. The fall has continued into May, with shipments falling by over 40% year-on-year in the first three weeks of the month.
In the first quarter of the year, state-owned oil major Sinopec reported oil product sales up 4.8%. Apparent consumption of oil products had increased 5.5% in January-February, but fell -0.3% in March, indicating an early impact of the price surge, although the late timing of the Chinese New Year also had an effect.
Electric vehicles have continued to gain market share in 2026, reaching 53% of vehicle sales in April, up from 47% a year ago.
Electricity demand for EV charging grew over 50% year-on-year in March. The large number of plug-in hybrid vehicles on the road means that drivers can switch from petrol to power quickly when there is more of an incentive to do so.
Moreover, 24% of highway trips during the 1 May holiday were made by EVs, even though they only make up 15% of all registered cars. This shows that EVs tend to be driven more than average, making a bigger dent in oil use than their share in the fleet would suggest.
Crude oil processing volumes fell by 2% in March and 6% in April, after growth in January-February. Plastics output growth moderated in March and turned into a decline in April.
The increase in oil prices has boosted the profitability of the highly carbon-intensive coal-to-chemicals industry. There has also been speculation that the industry would have forcefully increased output in response to the Hormuz crisis, enabling China to cut back on oil use. The industry was, however, already operating at high capacity utilisation before the current crisis, reported at an average of 87% in the first half of 2025. This means there was little headroom in the sector to raise output in the short term.
Coal use in the chemical industry increased 19% in January-February and 22% in March, showing a rapidly rising trend, but no step change after the start of the crisis.
The global fossil-fuel crisis is also affecting China’s clean-energy industry through overseas demand. Exports of solar, batteries and EVs recorded 56% growth year-on-year in the first quarter, reaching $55bn. This increase was partially driven by front-loading of shipments ahead of changes to tax rebates to solar and battery exports at the end of March, but the value of exports also grew 38% in April, an indication of strong underlying demand.
Implications of the crisis for China’s transition
The oil-and-gas crisis represents an opportunity for both clean energy and coal. The economics of electrification and clean-energy production, as well as of domestic coal production, have improved dramatically as imported fossil fuels have become more expensive.
At least as importantly, the closure of the strait of Hormuz and the resulting global fossil-fuel crisis closely mirror Chinese policymakers’ long-standing concern about reliance on seaborne fossil fuels. This is likely to reinforce their focus on energy security.
The previous fossil-fuel crisis, in 2021-2022, led to a new wave of coal-power plants, coal mines and coal-to-chemicals plants being built in China.
This time around, any expansion in coal mining is expected to be limited, both by the government’s “anti-involution” drive, which aims to stem harmful price competition, as well as by the carbon constraints in China’s climate goals.
Domestic coal production fell in the first four months of the year, despite a rise in oil and gas as well as coal prices. Rising coal prices will reduce the profitability of coal-fired power generation, at least for the next few months.
The perceived need for further new coal-power projects is also limited by the fact that, after record additions in 2025, there was still another 206GW of coal-fired capacity under construction in January, due to large volumes of permitting during the previous five years.
The energy regulator recently called on provinces to “strictly limit” the addition of new coal-power plants and other “regulating” power capacity in areas with sufficient firm capacity.
There is also a ceiling on the upside for coal in the current crisis, because gas plays a limited role in China’s energy system. This leaves little space for replacing gas with coal.
The exception is the coal-to-chemicals industry, which can replace oil and gas, albeit at the cost of very high carbon emissions. As a result, investment in the industry will likely get a further boost, even though the economic incentive is lower than it may seem.
While crude oil prices for delivery this summer have increased by more than $40 per barrel since the start of the year, 2030 prices are only up $5. This is a more relevant benchmark, given that a new coal-to-chemicals plant will take several years to build and commission.
The coal-to-chemicals expansion will also be limited by the new system to control carbon emissions. In particular, the requirement for local governments to compensate for carbon emissions from new industrial projects by closing down existing capacity, if these controls are implemented effectively.
Since the previous fossil-fuel crisis, the concept of energy security has become broader, encompassing clean energy and electrification, rather than being limited to coal and fossil fuels. This shift is also clear from how state media has been covering energy security in the wake of the war on Iran.
As such, the oil-and-gas crunch is likely to speed up the electrification of transportation and buildings. It also strengthens the case for “green fuels”, referring to green hydrogen and synthetic gaseous and liquid fuels produced from it, which are an important priority in the new five-year plan.
Solar and wind also become more attractive, economically and politically, as a result of the crisis. The upside may be limited by the dominant narrative that they have grown faster than the grid can manage, rather than being limited by institutional constraints. Nevertheless, they will benefit from fossil fuels – including coal – becoming more expensive and volatile.
Still, curtailment has become a key issue affecting the pace of China’s energy transition. It both reduces the immediate benefits of clean energy and undermines further investment in clean capacity, by increasing investment risks and cutting into returns.
The flipside of the current rise in curtailment is that when the installed wind, solar and energy storage capacity is put to full use, the supply of clean energy will increase substantially.
As noted, a key priority for the government in the next few years is to build a “new type of power system”, capable of integrating large amounts of variable renewable capacity.
The balance between how much the current crisis benefits coal or clean energy will depend on implementation of key climate and energy provisions in the 15th five-year plan.
If power-system reforms that benefit solar, wind and storage are implemented, while carbon-emission controls limit the expansion of coal-to-chemicals, then China is likely to follow a lower-CO2 emission trajectory than expected before the crisis.
About the data
Data for the analysis was compiled from the National Bureau of Statistics of China, National Energy Administration of China, China Electricity Council and China Customs official data releases, as well as from industry data provider WIND Information and from Sinopec, China’s largest oil refiner.
Electricity generation from wind and solar, along with thermal power breakdown by fuel, was calculated by multiplying power generating capacity at the end of each month by monthly utilisation, using data reported by China Electricity Council through Wind Financial Terminal.
Total generation from thermal power and generation from hydropower and nuclear power were taken from National Bureau of Statistics monthly releases.
Monthly utilisation data was not available for biomass, so the annual average of 52% for 2023 was applied. Power-sector coal consumption was estimated based on power generation from coal and the average heat rate of coal-fired power plants during each month, to avoid the issue with official coal consumption numbers affecting recent data.
CO2 emissions estimates are based on National Bureau of Statistics default calorific values of fuels and emissions factors from China’s latest national greenhouse gas emissions inventory, for the year 2021. The CO2 emissions factor for cement is based on annual estimates up to 2024.
For oil, apparent consumption of transport fuels – diesel, petrol and jet fuel – is taken from Sinopec quarterly results, with monthly disaggregation based on production minus net exports. The consumption of these three fuels is labeled as oil product consumption in transportation, as it is the dominant sector for their use.
Apparent consumption of other oil products is calculated from refinery throughput, with the production of the transport fuels and the net exports of other oil products subtracted.
Estimated non-energy use of fossil fuels is subtracted from total chemical industry fossil fuel consumption, and process emissions are calculated based on fossil fuel consumption with carbon retained in products subtracted. Emissions from the incineration of plastics are based on a peer-reviewed estimate of plastics incineration in 2022, combined with growth rates in the overall power generation from waste-to-energy plants. Metals industry process emissions are calculated using industrial output data and IPCC default emission factors.
Reported curtailment, and capacity utilisation in the absence of reported curtailment, is calculated as the complement of the “offtake rates” (利用率) reported by National New Energy Consumption Monitoring and Early Warning Center monthly by province for solar and wind.
Total curtailment is estimated by comparing solar and wind capacity utilisation predicted based on weather conditions, and in the absence of curtailment, to reported utilisation. Utilisation is predicted by fitting regression models to reported monthly utilisation and weather conditions in 2020-2023.
Weather data used for predicting utilisation are hourly wind speed, temperature, solar irradiation and humidity at solar and wind power plant locations in each province from NASA Power and CFSv2. Locations are taken from Global Energy Monitor data.


The post Analysis: China’s CO2 climbs 2% in early 2026 due to ‘wasted’ wind and solar appeared first on Carbon Brief.
Analysis: China’s CO2 climbs 2% in early 2026 due to ‘wasted’ wind and solar
Former crew members report egregious environmental destruction and labor abuses onboard shadowy squid fishing fleets, due to a regulatory vacuum.
While their dazzling bright lights are visible from space, much of the global squid fleet operates in total darkness.
Dolphins, Sharks, Turtles and Workers Are All Victims of Unregulated Squid Fleets


-
Climate Change10 months ago
Guest post: Why China is still building new coal – and when it might stop
-
Greenhouse Gases10 months ago
Guest post: Why China is still building new coal – and when it might stop
-

 Greenhouse Gases2 years ago
嘉宾来稿:满足中国增长的用电需求 光伏加储能“比新建煤电更实惠”
-

 Climate Change2 years ago
嘉宾来稿:满足中国增长的用电需求 光伏加储能“比新建煤电更实惠”
-
Climate Change2 years ago
Bill Discounting Climate Change in Florida’s Energy Policy Awaits DeSantis’ Approval
-

 Renewable Energy7 months ago
Sending Progressive Philanthropist George Soros to Prison?
-

 Carbon Footprint2 years ago
US SEC’s Climate Disclosure Rules Spur Renewed Interest in Carbon Credits
-
Greenhouse Gases11 months ago
嘉宾来稿:探究火山喷发如何影响气候预测