

Chinese automaker BYD continues its fast global expansion. In September 2025, the company’s sales in the European Union (EU) soared by 272 percent. In contrast, Tesla’s sales fell by 10.5 percent. This data comes from the European Automobile Manufacturers’ Association. The sharp contrast shows how BYD’s pricing strategy is reshaping the EV market and forcing global rivals to respond.
Pricing Power Drives Market Gains
In one year, BYD’s EU market share climbed from 0.4% to 1.5%. The company sold 13,221 vehicles in September, compared with Tesla’s 25,656. BYD has outsold Tesla in global battery-electric vehicles for four quarters in a row. It leads by about 388,000 units as of Q3 2025.
In the United Kingdom, BYD’s Dolphin Surf starts at £18,650, less than half the cost of a Tesla Model 3 at around £39,000. The price gap has opened the EV market to more consumers and pushed sales up tenfold year-over-year to 11,271 units in September 2025.
Analysts say BYD’s strategy is similar to the smartphone boom in the 2010s. Back then, Chinese brands gained global market share by offering high performance at lower prices. The same pattern is emerging in autos: BYD is now the top-selling car brand in Singapore, competing directly with Toyota and Hyundai.
The Secret Sauce: Vertical Integration at Scale
BYD builds about 75 to 80% of its vehicle components internally. It produces batteries, motors, semiconductors, and even its own car platforms. This level of vertical integration gives BYD three main advantages:
- Lower costs by avoiding outside suppliers.
- Supply-chain control, reducing risks from material shortages.
- Faster innovation in battery and power systems.
At the center of this is BYD’s Blade Battery, a lithium-iron-phosphate (LFP) design known for safety and durability. Its cost advantage is about €10 per kWh compared with nickel-cobalt batteries used by many rivals.
The new second-generation Blade Battery will launch in 2025. It aims for 200 Wh/kg of energy density. With just five minutes of charging, it will add 400 kilometers of range.

BYD has also secured lithium mining rights to ensure supply. It also operates the world’s largest car-carrier ship, which can move 9,200 vehicles at a time. This control helps the company keep prices low. It also maintains profit margins above industry averages.
Trade Barriers and Global Headwinds
Behind its strong performance, BYD still faces challenges abroad. The European Union started imposing anti-dumping tariffs of up to 45.3% on Chinese electric cars in 2024. They argued that state subsidies provide unfair advantages. In the United States, 25% tariffs and strict origin rules keep Chinese automakers out of the market.
To manage these barriers, BYD is building local factories. Its Hungary plant, set to open by the end of 2025, will have an annual capacity of 800,000 units and supply European markets directly.
Even with local production, BYD needs to price vehicles at about three times their China prices. This is necessary to remain competitive in Europe, where labor and logistics costs are higher.
At home, the company also faces slower growth. In September 2025, BYD delivered 393,060 vehicles, down from 419,000 a year earlier—its first monthly drop in years.
Analysts link this to domestic market saturation and stronger competition from rivals such as NIO, Xpeng, and Geely. To offset this, BYD is accelerating global expansion: 200,000 of its 1 million Q1 2025 sales came from overseas markets.
EV Market Outlook: Demand Still Accelerating
Worldwide, electric-vehicle sales are still climbing. The International Energy Agency (IEA) projects global EV sales will reach 17 million units in 2025, up from about 14 million in 2024. EVs could make up 45% of new car sales by 2030, driven by lower battery costs and stronger climate policies.

Average battery pack prices dropped from US$151 per kWh in 2022 to about US$110 per kWh in 2025. They might fall below US$80 by 2030. This makes EVs cheaper than many gasoline cars.
BYD’s strong control over its supply chain positions it well to benefit from these trends. Its strategy of providing affordable electric and plug-in hybrid models allows it to adapt as markets shift at different speeds toward full electrification.
The Chinese carmaker outpaced Tesla in global pure electric vehicle sales in 2025. From January to September, BYD sold about 1.61 million units. This is 388,000 more than Tesla’s 1.22 million. BYD is expected to exceed 2 million sales in 2025, while Tesla needs a 50% increase in Q4 to match this milestone.

BYD’s Financial Engine Keeps Humming
In 2024, BYD reported 777 billion yuan (US$107 billion) in revenue, up about 43% year-on-year. Net profit grew to roughly 30 billion yuan (US$4 billion). Margins improved thanks to internal battery production and steady demand across Asia and Europe.
BYD’s stock has reflected this growth but remains sensitive to policy news and trade developments. Analysts note that even small tariff changes or currency shifts can move the share price quickly.
Still, the company’s global EV leadership and diversified product lineup—spanning cars, buses, and trucks—offer long-term resilience.

Technology and Future Strategy
BYD continues to invest in next-generation batteries and solid-state chemistry. It is also expanding its plug-in hybrid (DM-i) models, which now account for nearly half of its domestic sales. These hybrids use smaller batteries but deliver very high fuel efficiency, appealing to consumers who are not yet ready for full EVs.
The company is focusing on software and self-driving systems. They aim to add AI features that compete with Western automakers. Its partnerships with ride-hailing firms in Asia and Europe could open new revenue streams in electric mobility services.
What’s Next for BYD — and the Industry?
Investors will keep an eye on several factors:
- Tariff impacts in Europe and potential U.S. policy changes.
- Battery-cost trends, which influence margins.
- Domestic competition in China, especially in the mid-price EV segment.
- Exchange-rate movements that affect export pricing.
Short-term risks exist, but BYD stands out in the EV market. Its vertical integration, cost leadership, and global presence boost its strength.
BYD’s rapid rise reflects a global shift in the auto industry. The company has combined low prices, in-house technology, and global reach. This mix has made established brands rethink their strategies. Even with trade hurdles, it remains on track to expand production, open new factories, and compete head-to-head with Tesla and legacy automakers worldwide.
If current growth trends hold, BYD may deliver over 5 million vehicles each year by 2026. Exports will make up an increasing portion of that total. For investors, the company represents both opportunity and volatility—an EV leader pushing the limits of cost, scale, and innovation in the race toward a fully electric future.
The post BYD Sales Surges 272% in European Union as Tesla Slumps appeared first on Carbon Credits.

The sustainability landscape is increasingly complex. More and more carbon-capture solutions are entering the market, and innovation is a constant thread running through the carbon market. With more possibilities, buyers are faced with more considerations than simply offsetting carbon. In this sphere, two main directions are taking shape—nature-centred or tech-focused.
![]()

Nasdaq has backed one of the first carbon removal credit deals licensed under European Union rules. The project is based in Stockholm and is designed to generate high-quality carbon removal credits under a formal EU framework.
This marks a key shift. For years, carbon markets have relied on voluntary standards with mixed credibility. Now, the European Union has developed a regulated system to define what counts as a valid carbon removal. This move aims to build trust and attract large investors into a market that is still in its early stages.
The deal shows growing interest from major companies. It also reflects rising demand for reliable ways to remove carbon from the atmosphere.
Inside the Stockholm Carbon Removal Project
The removal project is run by Stockholm Exergi. It uses a process called BECCS, or bioenergy with carbon capture and storage. This method burns biomass, such as wood waste and agricultural residues, to produce heat and electricity. At the same time, it captures the carbon dioxide released and stores it underground.
The captured CO₂ will be transported and stored deep beneath the North Sea in rock formations. Over time, it will turn into solid minerals. This makes the carbon removal long-lasting and more secure than many nature-based solutions.
The facility is expected to start operating in 2028. Once active, it will generate carbon removal credits that companies can buy to balance their remaining emissions.
Beccs Stockholm is one of the world’s largest carbon removal projects. In its first ten years, the project could remove about 7.83 million tonnes of CO₂ equivalent. This makes it a key tool for helping the European Union reach climate neutrality by 2050.
The project also aims to scale carbon removal by building a full CCS value chain in Northern Europe and supporting a growing market for negative emissions credits.
This project is important because it is one of the first to follow the EU’s new carbon removal certification rules. These rules define how carbon removal should be measured, verified, and reported. They also aim to reduce risks like double-counting and weak accounting.
EU Certification: Building Trust in a Fragile Market
The European Commission has introduced a framework, also called Carbon Removals and Carbon Farming (CRCF) Regulation, to certify carbon removal activities. This includes technologies like BECCS, direct air capture with carbon storage, and biochar.
The goal is to create a trusted system that investors and companies can rely on. It also established the first EU-wide certification framework for carbon farming and carbon storage in products, not just removals.
Until now, the voluntary carbon market (VCM) has faced criticism. Concerns about transparency and “greenwashing” have made some companies cautious. Many buyers want stronger proof that credits represent real and permanent carbon removal.
The EU framework tries to solve this problem. It sets clear rules for:
- Measuring how much carbon is removed.
- Verifying results through independent checks.
- Ensuring long-term storage of CO₂.
This structure may help standardize the market. It could also make carbon removal credits easier to compare and trade across borders. The Commission states that the goal of having the framework is:
“to build trust in carbon removals and carbon farming while creating a competitive, sustainable, and circular economy.”
Corporate Demand Is Growing—but Still Limited
Large companies are starting to invest in carbon removal. However, the market remains small compared to what is needed.
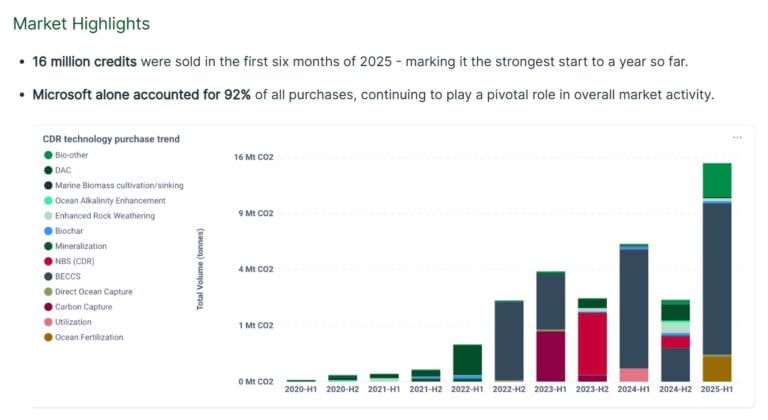
One major buyer is Microsoft. It currently holds about 35% of all global carbon removal credits, making it a dominant player in the market. In fact, it is responsible for 92% of purchased removal credits in the first half of 2025.
Other companies, including Adyen, a Dutch payments provider, have also joined the Stockholm project. These early buyers aim to secure a future supply of high-quality carbon credits as demand grows.
Ella Douglas, Adyen’s global sustainability lead, said in an interview with the Wall Street Journal:
“This project does exactly that [“catalytic impact” to the VMC] while also building key market infrastructure in collaboration with the European Commission.”
Still, many firms remain cautious. Carbon removal technologies are often expensive and not yet proven at a large scale. Some companies also worry about reputational risks if projects fail to deliver real climate benefits.
This creates a gap. Demand is rising, but the supply of trusted credits is still limited.
- SEE event: Carbon Removal Investment Summit 2026
A Market Set for Rapid Growth
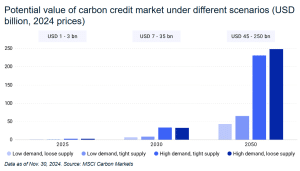
Despite these challenges, the long-term outlook for carbon removal is strong. Estimates suggest the market could reach $250 billion by mid-century, according to MSCI Carbon Markets.
Several factors drive this growth:
- First, global climate targets require large-scale carbon removal. The Intergovernmental Panel on Climate Change estimates that the world may need to remove around 10 billion metric tons of CO₂ per year by 2050 to limit warming.
- Second, many companies have set net-zero goals. These targets often include removing emissions that cannot be avoided, especially in sectors like aviation, shipping, and heavy industry.
- Third, new regulations are pushing companies to disclose and manage emissions more clearly. This increases demand for credible carbon solutions.
However, the current supply falls far short of what is needed. Only a small share of the required carbon removal credits has been developed or sold so far.
Balancing Removal and Emissions Cuts
While carbon removal is gaining attention, experts stress that it cannot replace emissions reductions. Removing carbon from the atmosphere is often more expensive and complex than avoiding emissions in the first place.
Groups like the European Environmental Bureau warn that over-reliance on credits could delay real climate action. They argue that companies should set separate targets for reducing emissions and for removing carbon.
The EU framework reflects this concern. It treats carbon removal as a tool for addressing residual emissions, not as a substitute for cutting pollution at the source. This distinction is important. It helps ensure that carbon markets support, rather than weaken, overall climate goals.
From Concept to Market Infrastructure
The Stockholm project marks a turning point for carbon removal. It shows how rules, strong verification, and corporate backing can bring structure to a fragmented market.
With support from players like Nasdaq, carbon removal is moving closer to becoming a mainstream financial asset. At the same time, the European Union’s certification system is setting the foundation for a more credible and scalable market.
The path ahead remains complex. Technologies must scale. Costs must fall. Trust must grow. But the direction is clear.
Carbon removal is no longer a niche idea. It is becoming a key part of the global climate economy, with the potential to shape investment flows for decades to come.
The post Nasdaq Invests in First EU-Certified Carbon Removal Credits from Stockholm Exergi appeared first on Carbon Credits.

The nuclear energy industry is entering a new phase of transformation. This shift is no longer just about building reactors—it is about building them faster, smarter, and more efficiently.
A recent breakthrough led by the U.S. Department of Energy (DOE), in collaboration with Idaho National Laboratory, Argonne National Laboratory, Microsoft, NVIDIA, Everstar, and Aalo Atomics, highlights that AI tools can streamline the nuclear regulatory process.
AI and DOE’s Genesis Mission: Breaking Bottlenecks in Nuclear Energy Deployment
The work supports President Trump’s Genesis Mission, a national initiative aimed at driving a new era of AI-accelerated innovation and discovery. The mission focuses on using advanced technologies like AI to solve critical national challenges, from energy to healthcare and beyond.
Under the Genesis Mission, DOE recently announced $293 million in competitive funding to tackle twenty-six pressing science and technology challenges, including one dedicated to speeding up nuclear energy deployment.
Rian Bahran, Deputy Assistant Secretary for Nuclear Reactors. said,
“Now is the time to move boldly on AI-accelerated nuclear energy deployment,” “This partnership, combined with the President’s orders, represents more than incremental ‘uplift’ improvements. It has the potential to transform how industry prepares its regulatory submissions and deploys nuclear energy while upholding the highest standards of safety and compliance.”
Simply put, from licensing to construction and operations, AI is now helping eliminate long-standing bottlenecks.
Faster Nuclear Licensing with Advanced Tools
The DOE’s recent announcement is a big step in modernizing nuclear regulation. Normally, preparing licensing documents for nuclear reactors is slow and complicated. It requires reviewing thousands of pages of technical data and making sure everything meets strict rules.
This shows how AI can make nuclear licensing faster and more accurate, helping advanced reactors reach the market sooner. Here’s how AI is simplifying this usually long and complex process.
Kevin Kong, CEO and Founder of Everstar, added:
“Nuclear is poised to solve today’s critical energy challenges,” said “We’re excited to partner with INL to meet the moment, working together to accelerate regulatory review and commercialization.”
Microsoft and NVIDIA Partnership: Building AI Infrastructure for Nuclear Energy
While the DOE demonstration focused on licensing, the broader transformation is being driven by a powerful collaboration between Microsoft and NVIDIA.
Together, they are developing a full-stack AI ecosystem designed specifically for nuclear energy. This platform combines cloud computing, simulation tools, and advanced AI models to streamline every phase of a nuclear project.
Key technologies in this ecosystem include:
- NVIDIA Omniverse for simulation and digital modeling
- NVIDIA CUDA-X and AI Enterprise for high-performance computing
- Microsoft Azure AI for data processing and automation
- Microsoft’s Generative AI tools for permitting and documentation
This integrated system enables developers to manage complex workflows in a unified environment. Instead of working with disconnected tools and datasets, teams can now operate within a single, AI-powered framework.
As a result, nuclear projects become more efficient, transparent, and predictable.
Carmen Krueger, Corporate Vice President, US Federal, Microsoft, further added:
“Our collaborations with DOE, INL, and across the industry are demonstrating how we can effectively bring secure, scalable AI technologies to solve key energy challenges and achieve the broader national and economic security goals envisioned by the Department’s Genesis Mission.”
Aalo Atomics: Cutting Permitting Time and Costs with AI
One of the most compelling real-world examples of AI impact comes from Aalo Atomics.
By leveraging Microsoft’s Generative AI for Permitting solution, Aalo has achieved dramatic improvements in project timelines. The company reported:
- A 92% reduction in permitting time
- Estimated annual savings of $80 million
These results show how AI can address one of the biggest challenges in nuclear development—delays caused by regulatory complexity.
Permitting often takes years and requires extensive documentation. However, AI can automate much of this work, allowing teams to focus on critical decision-making rather than repetitive tasks.
For Aalo, the value goes beyond speed. The technology also improves confidence in project execution by ensuring that all documentation is consistent, complete, and aligned with regulatory expectations.
This video demonstrated further details:
AI-Powered Nuclear Lifecycle: From Design to Operations
The impact of AI is not limited to licensing. It extends across the entire lifecycle of a nuclear plant. In the blog post, written by Darryl Willis, Corporate Vice President, Worldwide Energy and Resources Industry of Microsoft, explained how AI can help nuclear in a broader context.
- Design and Engineering Optimization: AI and digital twins allow engineers to simulate reactor designs in real time. This enables faster iteration and better decision-making. Developers can reuse proven design patterns and instantly evaluate how changes affect performance, safety, and cost.
- Licensing and Permitting Automation: Generative AI handles document drafting, data integration, and gap analysis. It ensures that applications are complete and consistent, reducing delays during regulatory review. This allows experts to focus on safety assessments instead of administrative tasks.
- Construction and Project Delivery: Advanced simulations now include time and cost dimensions. These 4D and 5D models allow developers to track progress, predict delays, and avoid costly rework. AI also enables real-time monitoring, ensuring that construction stays on schedule and within budget.
- Predictive maintenance and Plant Performance: Once a plant is operational, AI continues to add value. Predictive maintenance systems can detect issues early, reducing downtime and improving reliability. Digital twins provide continuous insights into plant performance, helping operators maintain optimal efficiency.
The post AI Solutions from Microsoft and NVIDIA Power DOE’s Nuclear Energy Genesis Mission appeared first on Carbon Credits.


-
Climate Change8 months ago
Guest post: Why China is still building new coal – and when it might stop
-
Greenhouse Gases8 months ago
Guest post: Why China is still building new coal – and when it might stop
-

 Greenhouse Gases2 years ago
嘉宾来稿:满足中国增长的用电需求 光伏加储能“比新建煤电更实惠”
-
Climate Change2 years ago
Bill Discounting Climate Change in Florida’s Energy Policy Awaits DeSantis’ Approval
-

 Climate Change2 years ago
嘉宾来稿:满足中国增长的用电需求 光伏加储能“比新建煤电更实惠”
-
Climate Change Videos2 years ago
The toxic gas flares fuelling Nigeria’s climate change – BBC News
-

 Renewable Energy5 months ago
Sending Progressive Philanthropist George Soros to Prison?
-

 Carbon Footprint2 years ago
US SEC’s Climate Disclosure Rules Spur Renewed Interest in Carbon Credits