

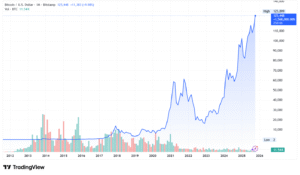
Bitcoin has broken another record, rising above $126,279 USD on the Coinbase BTC/USD pair on October 6, 2025. The price jump came as strong inflows poured into Bitcoin exchange-traded funds (ETFs) and as the U.S. government faced a partial shutdown.
The rally shows how much investor confidence has grown in digital assets. Even in uncertain economic conditions, Bitcoin continues to attract both institutional and retail investors. Analysts say that hundreds of millions of dollars entered Bitcoin ETFs in just a single day, helping push prices to new highs.
This rise also reflects a wider shift in financial markets. Investors are using Bitcoin not just as a speculative asset but also as a hedge against inflation and government instability. As one analyst put it, “Bitcoin’s resilience during macroeconomic stress strengthens its case as digital gold.”
The $126K Question: What’s Driving Bitcoin’s Meteoric Rise?
There are a few main reasons behind Bitcoin’s latest surge, and it’s hitting over $126,000.
First, institutional demand is back in full force. Spot Bitcoin ETFs are now approved and active in the U.S., making it easier for big investors to buy Bitcoin without dealing with the complexity of wallets and exchanges.
In recent trading sessions, U.S. spot Bitcoin ETFs saw total inflows of around $307 million in a single day. BlackRock’s iShares Bitcoin Trust (IBIT) alone accounted for $177 million of that amount. These are large numbers that reflect strong confidence from big players like asset managers, pension funds, and hedge funds.
Second, the U.S. government shutdown caused some investors to move money into alternative assets. When government operations slow or economic uncertainty grows, investors often turn to decentralized assets like Bitcoin as a form of protection.
Finally, market momentum itself plays a big role. As prices climb, new buyers enter, creating a feedback loop that drives Bitcoin even higher.
Despite this, analysts warn that volatility remains high. Sharp corrections are still possible as traders take profits or respond to changing policies.
The Environmental Side of Bitcoin
While the price surge excites investors, it also renews focus on Bitcoin’s environmental impact. Mining Bitcoin uses a lot of energy. That energy demand produces a significant amount of carbon emissions.
Estimates show that the Bitcoin network consumes around 175 to 180 terawatt-hours (TWh) of electricity each year. This is similar to the yearly power use of countries such as the Netherlands or Argentina, and even more than Norway.
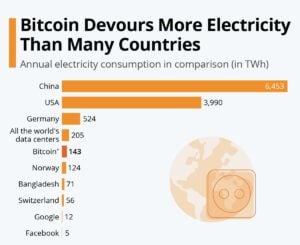
That level of energy use leads to about 98 million tonnes of CO₂ emissions every year. To put that in perspective, that’s roughly the same as the total annual emissions of some smaller developed countries.
- Each Bitcoin transaction can generate hundreds of kilograms of CO₂ (672 kg of CO₂), roughly the same as driving a gasoline car for more than 1,000 miles.
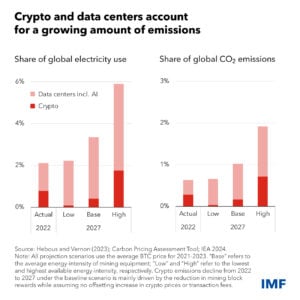
Globally, data centers and crypto mining together now use around 2% of the world’s electricity. Their combined emissions account for nearly 1% of global carbon output. If mining continues to grow, this share could rise further, raising questions about whether such growth is sustainable in a net-zero world.
- SEE MORE: The Energy Debate: How Bitcoin Mining, Blockchain, and Cryptocurrency Shape Our Carbon Future
- Bitcoin’s New Gold Rush: ETFs, Energy Battles and the Rise of American Bitcoin
Beyond the Blockchain: The Hidden E-Waste Problem
The environmental footprint of Bitcoin doesn’t stop at electricity. Mining requires powerful machines called ASICs (Application-Specific Integrated Circuits). Producing these machines consumes a lot of materials and energy.
Mining hardware becomes outdated quickly, often within one to two years. Newer models are more efficient, forcing miners to replace old machines. This creates a steady stream of electronic waste (e-waste).
A study from the United Nations University found that global e-waste could exceed 75 million tonnes per year by 2030, and crypto mining adds to this problem.
Building the machines also requires rare minerals like lithium, nickel, and copper. Extracting and refining these resources can harm local ecosystems and produce toxic waste. Manufacturing contributes up to 80% of the total lifecycle impact of some mining systems.
These factors mean that even before a Bitcoin is mined, environmental costs are already being paid.
Bitcoin’s Race Toward Renewable Power
In response, parts of the Bitcoin industry are shifting toward cleaner energy. Reports suggest that by mid-2025, about 52% of Bitcoin’s power mix will come from renewable or low-carbon sources like hydropower, wind, and solar.

Some miners have built facilities near renewable energy plants, using excess energy that would otherwise go to waste. Others buy carbon credits or join programs to offset their emissions.
For example, miners in Iceland and Norway already rely almost entirely on geothermal and hydropower, giving them some of the cleanest operations in the world. In Texas, where many U.S. miners operate, some companies now run flexible systems that shut down during peak electricity demand, helping stabilize the power grid.
However, not all mining is clean. Many sites in countries like Kazakhstan or regions in the U.S. still depend on coal or natural gas. These differences make it harder to calculate the true carbon footprint of the entire Bitcoin network.
Regulators Step In: Can Bitcoin Go Green Under Pressure?
As Bitcoin grows, so does pressure from regulators and ESG-focused investors. They want more transparency about how Bitcoin is mined and how much carbon it emits.
Some governments have discussed banning or limiting mining in areas with high emissions. However, bans can push miners to relocate to countries with dirtier energy, which increases global emissions instead of reducing them — a problem known as carbon leakage.
A more balanced solution could be a carbon tax on mining energy use. A report from the International Monetary Fund (IMF) suggested that a small tax — around $0.05 per kilowatt-hour — could both reduce emissions and generate government revenue.
Meanwhile, new frameworks for carbon intensity labeling are being discussed. These would give each cryptocurrency a score showing how clean or dirty its energy use is. Such tools could help investors choose more sustainable digital assets.
Institutional investors are also demanding better disclosure. They want mining companies to report their power sources, total energy use, and steps taken to reduce emissions. Without clear data, Bitcoin may find it difficult to fit into portfolios that follow ESG principles.
A Turning Point for Bitcoin’s Future
Bitcoin’s climb past $126,000 marks a major moment for the digital asset. It confirms that investor appetite remains strong and that Bitcoin has matured into a key part of the global financial system.
But the environmental costs are also becoming clearer. To remain part of a sustainable economy, the Bitcoin industry will need to:
- Use cleaner energy sources.
- Improve mining efficiency and reduce power per transaction.
- Extend hardware lifespan and recycle old machines.
- Increase transparency about emissions.
- Work with regulators on smart climate policies.
If these steps are in place, Bitcoin could continue to grow while shrinking its environmental footprint.
In the long run, balancing profit and planet will define Bitcoin’s role in the new financial era. Its future success will depend not only on market prices but also on how responsibly the network manages its impact on climate and energy systems.
- READ MORE: Bitcoin Price Hits $124,000 Record High vs Ethereum Price Near $4,800: Which Crypto Is Greener?
The post Bitcoin Breaks Records Passing $126K: The Bull Run That’s Redefining Digital Gold and Climate Debate appeared first on Carbon Credits.
For most businesses, the emissions that matter most sit outside their own walls. Scope 3 emissions, everything generated across your value chain, from the suppliers who make your inputs to the customers who use your products, typically make up the majority of a company’s total carbon footprint. Under the Corporate Sustainability Reporting Directive (CSRD), those value-chain emissions now have to be measured and disclosed with a rigour that spend-based estimates alone struggle to satisfy. This guide sets out how to improve Scope 3 data accuracy for CSRD: the calculation methods open to you, how to move from estimates to verified supplier data, and how to govern that data so it holds up to audit.
![]()
A carbon credit is a commitment that extends well into the future. The tonne of CO₂ compensated for today from a nature-based carbon project must remain out of the atmosphere for good, which means the forest behind the credit has to remain standing long after the transaction is complete. For any buyer, this raises a defining question: What ensures that the forest endures?
![]()
What replaced the cheap REDD credit on the boardroom slide deck, and why procurement is leading the rewrite.
Three years ago, a corporate slide showing a portfolio of cheap REDD+ credits could carry a board meeting. The number was big, the price was low, and the press release wrote itself. Today, that same slide gets sent back with questions. The questions are uncomfortable, the answers are unclear, and your general counsel is suddenly in the room.
Conventional carbon offsets are not dead. The voluntary carbon market retired 202 million tonnes in 2025, and the Morgan Stanley Institute for Sustainable Investing survey published in January 2026 confirmed that interest from corporate buyers remains substantial. What changed is the credibility threshold. The integrity floor has risen, the disclosure scrutiny has tightened, and the buyer profile has shifted. This article tracks what changed, what sophisticated buyers now ask before signing, and what serious corporates are putting on the board slide instead.
What boards used to buy, and why it stopped working
The 2020 to 2022 model was simple: buy a large tranche of avoidance credits at low single-digit prices, retire them against the company footprint, announce the carbon-neutral claim, and move on. Most of those credits came from REDD+ projects, renewable energy installations in countries where the renewable energy was already economic, or methane projects with thin documentation.
Several things broke that model. Academic research published in 2023, including a widely cited Science paper, found that the majority of REDD+ credits issued under the most common methodologies did not represent additional reductions when tested against rigorous counterfactuals. The Voluntary Carbon Markets Integrity Initiative published its Claims Code of Practice, which sets requirements for what companies can credibly claim from credit use. The European Union finalised its Green Claims Directive, restricting how companies can describe products as climate-neutral. France’s Décret 2022-539 already restricts carbon neutrality advertising. California’s AB 1305 imposes disclosure requirements on any company making net-zero or carbon-neutral claims while doing business in the state.
The collective effect: the cheap credit no longer buys the announcement, and the announcement now carries litigation risk.
The integrity reset: ICVCM, VCMI, and what changed
The Integrity Council for the Voluntary Carbon Market published the Core Carbon Principles in 2023 and began assessing methodologies against them in 2024. The first methodologies received the CCP label later that year. The point of the label is to give corporate buyers a defensible quality screen they can cite in disclosure.
The Voluntary Carbon Markets Integrity Initiative complements this on the demand side. Its Claims Code of Practice defines what a buyer can say (Silver, Gold, or Platinum claims, with associated requirements) based on the quality of credits used and the underlying decarbonisation strategy. Together, CCP and VCMI build a quality stack: CCP on the supply, VCMI on the claim, with the science-based target sitting underneath both.
The reset is not a ban on offsets. It is a ratchet. Credits that meet the new bar continue to clear; credits that do not, do not. The Morgan Stanley survey found that 61% of current buyers like the CCP label concept but that supply of labelled credits remains limited. That supply constraint is now visible in pricing.
What sophisticated buyers ask before they sign
The questions on the procurement scorecard have changed. A 2022 buyer might have asked about price, vintage, and project type. A 2026 buyer asks five different questions before any of those.
- What does the counterfactual look like, and who validated it.
- What is the permanence regime, and what is the buffer pool exposure.
- What is the leakage risk, and how is it mitigated.
- What rating has the project received from the independent ratings agencies (Sylvera, BeZero, Calyx Global), and what was the rationale.
- What is the documentation discipline that survives an audit four years from now when the procurement team that signed the contract has moved on.
If the vendor cannot answer those five questions on a first call, the conversation ends. Conversely, if the vendor can answer them with documented specificity, the conversation often expands beyond a single transaction toward a multi-year engagement.
Where this leaves your near-term commitments
You probably have near-term commitments that pre-date the integrity reset. Public targets to be carbon neutral by 2025 or 2030. Product-level claims that ran in last year’s marketing. Disclosed reduction trajectories that assumed continued access to cheap credits.
You have three workable paths. The first is to re-baseline your strategy, replacing the most exposed credits with higher-quality alternatives and adjusting the public language to match what you can defend. The second is to shift the underlying spend from offsetting outside your value chain to investing inside your value chain, where reductions count against Scope 3 directly and the audit trail is cleaner. The third is to keep the strategy and absorb the risk, which is increasingly the most expensive option once you price in litigation, restatement, and reputational exposure.
Most serious buyers are choosing the second path. It moves the carbon spend from a compliance cost to a procurement and resilience investment, and it removes the central failure point of the legacy model: the disconnect between where the emissions occurred and where the reductions sat. Nature-based supply chain investments, structured under the GHG Protocol Land Sector and Removals Standard and aligned to the SBTi FLAG Guidance, are the asset class that fits this brief. They generate inventory-grade reductions, they produce audit-grade documentation, and they survive the new claim restrictions because the carbon math sits inside the value chain that the disclosure already covers.
If you are reassessing a carbon strategy under the new integrity bar, or rebuilding a board narrative that has to survive a more skeptical audience, the carbon and sustainability experts at Carbon Credit Capital can help. The Dual-Value Model gives you a defensible alternative to legacy offset purchases, with the documentation and operational integration that survives the procurement scorecard and the audit. Schedule a consultation.


-
Climate Change11 months ago
Guest post: Why China is still building new coal – and when it might stop
-
Greenhouse Gases11 months ago
Guest post: Why China is still building new coal – and when it might stop
-

 Greenhouse Gases2 years ago
嘉宾来稿:满足中国增长的用电需求 光伏加储能“比新建煤电更实惠”
-

 Climate Change2 years ago
嘉宾来稿:满足中国增长的用电需求 光伏加储能“比新建煤电更实惠”
-
Climate Change2 years ago
Bill Discounting Climate Change in Florida’s Energy Policy Awaits DeSantis’ Approval
-

 Renewable Energy9 months ago
Sending Progressive Philanthropist George Soros to Prison?
-

 Carbon Footprint2 years ago
US SEC’s Climate Disclosure Rules Spur Renewed Interest in Carbon Credits
-
Greenhouse Gases1 year ago
嘉宾来稿:探究火山喷发如何影响气候预测