

Coastal flooding could bring $500bn of annual damages to the Asia-Pacific by the year 2100, if countries do not adapt to rising sea levels.
This is according to new research, published in the journal Scientific Reports, which assesses how coastal flooding is impacting the Asia-Pacific region – and models how the damages could worsen as sea level rises over the 21st century.
The paper finds that coastal flooding is already driving $26.8bn of damage every year across 29 countries in Asia and the Pacific, equivalent to 0.1% of the region’s GDP.
It projects that, under current policies, annual coastal flood damages in the region could rise to $518bn by 2100 – but this could drop to $338bn if warming is capped at 1.5C.
Small island states face the greatest risks from coastal flooding and will continue to bear the brunt of the damage as the planet continues to warm, according to the research.
For example, it finds that Tuvalu will face annual coastal flood damage equivalent to 38% of its GDP by the end of the century.
Meanwhile, small island states such as Kiribati, the Maldives, Micronesia and Tuvalu will permanently lose around 10% of their total land area.
The study’s lead author says the research shows how “rising seas” create “existential” and “economic” risks for low-lying islands in the Asia-Pacific.
He tells Carbon Brief that the paper highlights a “sharp inequality”, as developing nations with little historical responsibility for sea level rise face the brunt of its impacts.
Coastal damage
More than one billion people – about 15% of the world’s population – currently live within 10km of a coast.
Asia is home to some of the largest cities in the world, many of which are located near the sea, such as Mumbai, Tokyo, and Shanghai. The continent is home to 60% of the world’s coastal population.
However, there are hazards to living near the water.
Coastal flooding is caused by a combination of gradually rising sea levels and “episodic extreme sea levels”, such as high tides and storm surges, the study explains.
To assess these two factors, the study combines components including an ocean model and tide-height data.
The authors model flooding in all coastal Pacific and Asian countries that are listed as “developing member countries” by the Asian Development Bank. These 29 countries include Bangladesh, the Philippines and Tuvalu.
They calculate the economic damage caused by flooding, by combining their flood model with data on land use and “asset values” across the residential, commercial, industrial, infrastructure and agricultural sectors.
The authors assume when land floods permanently, the “assets” are completely lost. For areas that only flood periodically, the authors use a model linking flood depth to a percentage of land damaged to calculate the economic consequences.
They find that coastal flooding currently drives $27bn of damage every year in the Asia-Pacific.
China and Indonesia bear the greatest damage, each losing more than $6bn every year. The study authors say this is because both countries have “extensive coastlines, large populations in flood-prone areas and critical economic infrastructure concentrated near the coast”.
However, the study finds that small islands face the greatest economic damage as a percentage of their GDP.
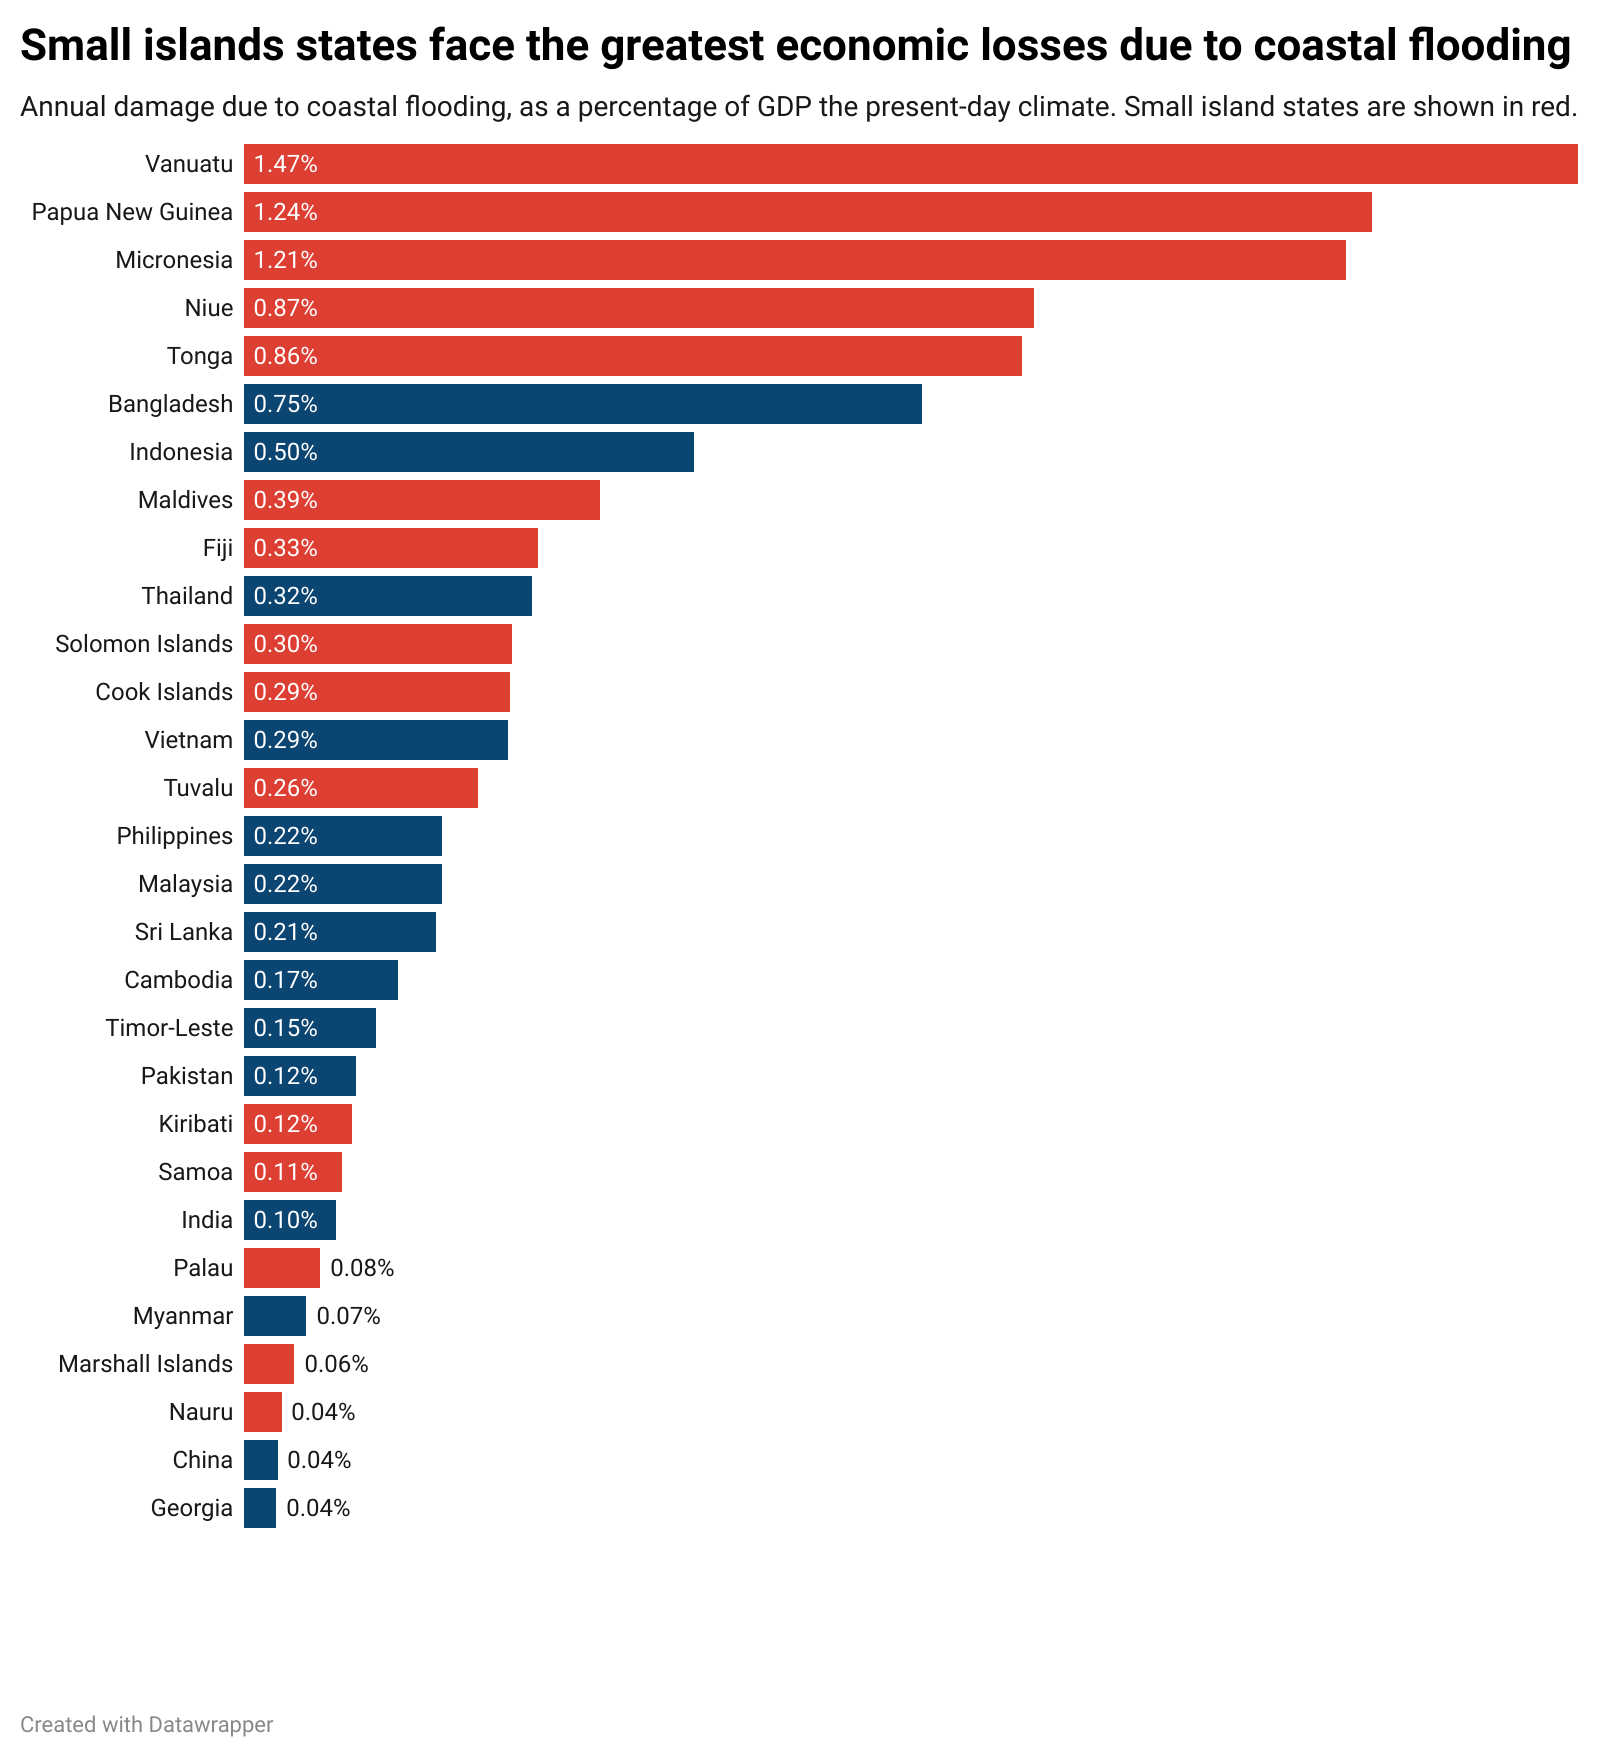
The study shows that the five most-severely affected countries are small island states. Vanuatu tops the ranking, losing 1.5% of its GDP to flooding every year. It is followed by Papua New Guinea and Micronesia.
Dr Michalis Vousdoukas is a researcher in coastal geography at the University of the Aegean in Greece and lead author of the study.
He tells Carbon Brief that even these damage estimates are “conservative” as they do not consider indirect economic losses, such as disruption to business, the loss of critical infrastructure, such as airports, or social impacts, such as migration.
Vousdoukas tells Carbon Brief that the study “highlights a sharp inequality between responsibility and impact”, explaining that the “countries that contributed the least to global emissions, particularly atoll nations, face the highest relative damages”.
Island nations in the Asia-Pacific region made of atolls – ring-shaped coral reefs or islands – include Kiribati, the Marshall Islands and Tuvalu.
Exposure
The authors also calculate population exposure to flooding, by overlaying their flood model with world population data.
Vousdoukas explains that “a person is considered exposed if they live in an area that appears as flooded in our model”.
The paper finds that six million people across the Asia-Pacific are currently at risk of coastal flooding each year, accounting for 0.2% of the region’s total population. The paper says:
“Although this may appear to be a small percentage, it still represents millions of individuals and families whose lives and livelihoods are under constant threat.”
Ranjan Panda is the convenor of the Combat Climate Change Network in India. Panda, who was not involved in the study, tells Carbon Brief that sea level rise is already forcing “millions of people to migrate out in distressed conditions to cities and other countries”.
China and Bangladesh rank the highest, with 2.2 million and 1.5 million people, respectively, exposed to coastal flooding each year.
However, small islands have the greatest percentage of their population exposed to flooding. Vanuatu again tops the table, with 2% of its population facing coastal flooding every year, according to the study. It is followed by Micronesia and the Maldives.
Bangladesh is the highest ranking non-island country, due to its “densely populated and flood-prone delta region”, the study finds.
Rising seas
As the climate warms, coastal flooding is worsening.
Average global sea levels have risen by more than 20cm since 1900, driven mainly by the thermal expansion of the ocean and the melting of glaciers and ice sheets.
Global warming is also “supercharging” hurricanes and typhoons, causing storm surges – the temporary rise in sea level that happens during a storm – to become more intense.
The study uses projections from the IPCC’s sixth assessment report to model sea level rise over the 21st century. These include thermal expansion and meltwater from glaciers and ice sheets, but exclude “low-likelihood, high-impact” events, such as ice-sheet collapse.
The authors assess five future scenarios:
- SSP1-1.9: A very-low emissions reductions pathway that “aligns with” the Paris Agreement’s 1.5C limit
- SSP1-2.6: A “low” emissions pathway achieving net-zero emissions after 2050
- SSP2-4.5: A “moderate” emissions scenario, often described as the trajectory under current climate policies.
- SSP3-7.0: A “high” emissions pathway
- SSP5-8.5: A very-high emissions pathway of “high fossil fuel reliance” throughout the 21st century
They find that, even under the lowest 1.5C warming scenario, countries in the Asia-Pacific will face damages of $338bn due to coastal flooding every year by the end of the century. This accounts for 1.3% of the region’s present-day GDP. (The authors assume no adaptation measures, changes in land use or inflation over the century.)
Under the current policy scenario, annual damage from coastal flooding rises to $518bn by the end of the century.
The chart below shows coastal flood damage as a percentage of annual GDP by the end of the century under the five scenarios for each country. Each horizontal bar shows the damage for one country, with the lowest warming SSP1-1.9 scenario on the left (grey) and highest warming SSP5-8.5 scenario (black) on the right.

The study finds that, by the end of the century, the Pacific island of Tuvalu will face the worst economic consequences from coastal flooding. Even under the 1.5C warming scenario, its annual economic losses due to coastal flooding will reach 38% of its GDP.
The authors also assess the amount of land that will be permanently lost to the sea.
They find that small island states – such as Kiribati, the Maldives, Micronesia and Tuvalu – will experience the highest percentage of their land permanently submerged, each losing around 10% of their total land area.
Two million people currently live in areas of the Asia-Pacific that will be permanently flooded by the end of the century under the 1.5C warming scenario, according to the research.
Finance gap
Countries can reduce the impacts of coastal flooding through adaptation. This can include building flood defenses, making infrastructure more resilient to flooding, or arranging “managed retreat” to move people away from vulnerable areas as the seas encroach.
The study authors model the cost of building defences – such as sea walls, levees, embankments and sand dunes – high enough that the economic damage from coastal flooding over the 21st century does not worsen beyond 2020 levels.
The research highlights that the cost of investing in these defences is substantially lower than the potential economic damages of sea level rise.
The authors estimate that, under a 1.5C warming scenario, building flood defenses to limit flood damage to 2020 levels would cost $9bn in total. However, building these defences would avoid $157bn in damages due to coastal flooding, they find.
Dr Rafael Almar is a researcher at the Laboratory of Space Geophysical and Oceanographic Studies in France and was not involved in the study. He says the study has “significant implications for development banks and financial institutions” as it could help them prioritise investments in “clearly identified hotspots”.
However, he emphasises that building flood defences “is not the only solution”. For example, he argues that “relocation and renaturalisation” – the process of moving people away from the coast and allowing the area to return to its natural state – can make an area “more resilient”.
Panda also warns that physical flood defenses “could actually be triggering further local environmental crises that accelerate the losses and damages faced by people due to sea level rise and flooding impacts”.
Sea walls have been shown to damage wildlife – for example, blocking animals such as turtles from reaching parts of the beach – according to an article in Climate Home News. The piece adds that physical defenses are “inflexible” and “mainly benefit the rich and encourage risky building near the coast”.
Sourcing money for developing countries to adapt to the impacts of climate change is an ongoing talking point at international climate negotiations.
A group of developed nations, including much of Europe, the US and Japan, is obliged under the Paris Agreement to provide international “climate finance” to developing countries. This money can be used for both mitigation – reducing emissions to limit warming – and adaptation.
In 2023, developed nations provided $26bn in international adaptation finance to developing nations, according to a recent UN report. This is roughly the amount that Asia-Pacific countries currently lose every year due to coastal flooding alone.

The post Asia-Pacific faces ‘$500bn-a-year’ hit from rising seas if current policies continue appeared first on Carbon Brief.
Asia-Pacific faces ‘$500bn-a-year’ hit from rising seas if current policies continue

Next week, diplomats from around the world will descend on Yerevan, Armenia, to negotiate a series of decisions under the UN Convention on Biological Diversity (CBD).
Between 19 and 30 October, 196 parties will gather to hammer out the precise wording of the dozens of legal texts that make up the decisions under the Conference of the Parties (COP) to the CBD.
This year’s summit is particularly significant, as it marks the halfway point between the agreement of the Kunming-Montreal Global Biodiversity Framework and the deadline for achieving its targets.
The CBD has found that countries are currently not on track to meet 22 out of the framework’s 23 targets.
During the fortnight, delegates will also be negotiating decisions relating to the two supplemental protocols to the CBD: the Cartagena Protocol, which covers biosafety; and the Nagoya Protocol, which covers access and benefit-sharing for the use of genetic resources.
(The Cartagena and Nagoya Protocols, which are each governed by a “meeting of the parties”, or “MOP”, have fewer parties than the CBD as a whole, with 173 and 141, respectively.)
Carbon Brief is tracking the progress of countries towards consensus on dozens of negotiating texts using the interactive table below.
The tracker includes texts from the COP, as well as the MOPs for the Cartagena and Nagoya protocols. It also includes draft decisions from the most recent subsidiary body meetings, as these form the starting point for the negotiations in Yerevan.
The CBD has three subsidiary bodies: the subsidiary body on scientific, technical and technological advice (SBSTTA), the subsidiary body on implementation (SBI) and the subsidiary body on article 8(j) and other provisions (SB8J).
SB8J focuses on issues related to the Indigenous peoples and local communities. It was established at COP16 in Cali, Colombia, in 2024.
The first two columns of the interactive tracker list the topic of each agenda item and the relevant body, with subsequent columns including dates, page counts and links to the original documents.
The table is searchable and can be sorted using the arrows in the header.
Areas of disagreement in UN draft texts are denoted by square brackets. Counting the brackets in a particular iteration of a text therefore gives a sense of how far parties are from reaching consensus.
The bracket column is colour-coded, with dark green indicating a low number of brackets and red indicating a high number of brackets remaining.
Texts can also present parties with choices using “options” or alternatives (“alt”), which are counted together in the sixth column of the table.
The key discussions in Yerevan will centre around two agenda items in particular. The first is the global review, which will assess progress towards the GBF and make recommendations for accelerating action.
The second is finance, which can be separated into two parts: resource mobilisation and the financial mechanism. On resource mobilisation, biodiverse global south countries are likely to push for an increased amount of international finance for conservation.
Disagreement over the creation of the financial mechanism led to the suspension of COP16 in Cali in October 2024, as parties failed to find agreement on the mobilisation of finance before the end of the summit.
Global south countries want the establishment of a separate financial mechanism under the control of the CBD; global north countries largely prefer to maintain the existing mechanism, which sits under the Global Environment Facility.
At the resumed session of COP16 in Rome in early 2025, countries agreed on a roadmap that would lead to the establishment of a permanent mechanism.
related
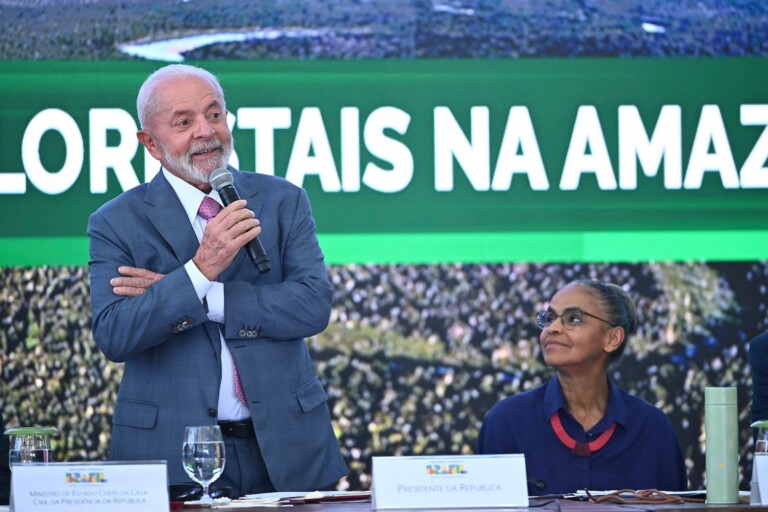
Analysis: Lula presidency saved at least 20,000km2 of Brazilian Amazon since 2022
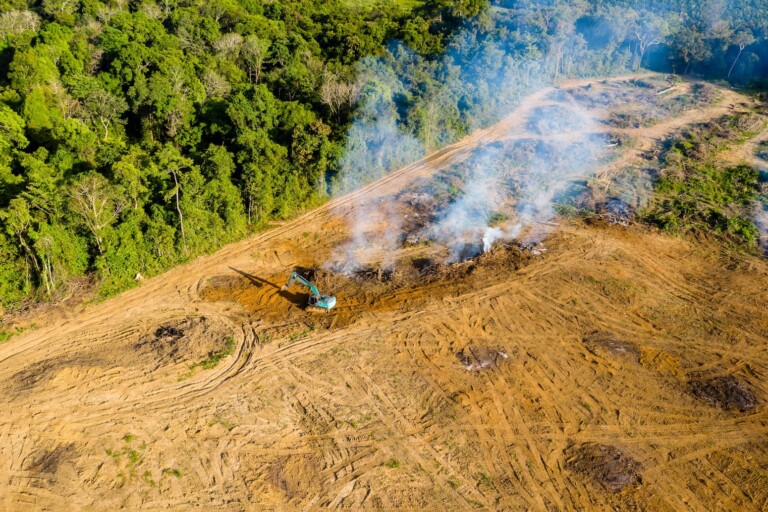
Why land-use emissions have fallen by a third this century – in six charts

Analysis: 84% of nations miss deadline to identify ‘nature-harming’ subsidies by 2025
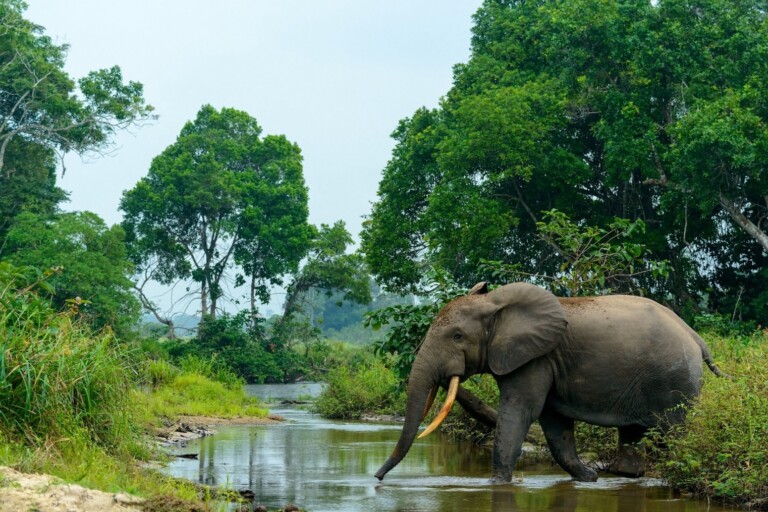
UK withdraws millions in funding from world’s second-largest rainforest in Congo
The post Interactive: Tracking negotiating texts at the COP17 biodiversity summit appeared first on Carbon Brief.
Interactive: Tracking negotiating texts at the COP17 biodiversity summit
A beacon of love
On an outer island of Fiji, two thousand nautical miles from Sydney, is a shining light of hope and resilience for our troubled world.
The island of Kioa is home to a Tuvaluan community who migrated from their atoll of Vaitupu in the late 1940s. It is a land of warm hearts, big smiles, and deep cultural roots; a place where the sound of a conch still summons the island together, where islanders paddle out to fish in carved outrigger canoes, and healthy happy children walk barefoot to school.
Here, culture is life. Kioans live sustainably through their traditional knowledge and practices. The island is alive with song, dance and the rhythms of a life tied to the tides, the winds, and the seasons.
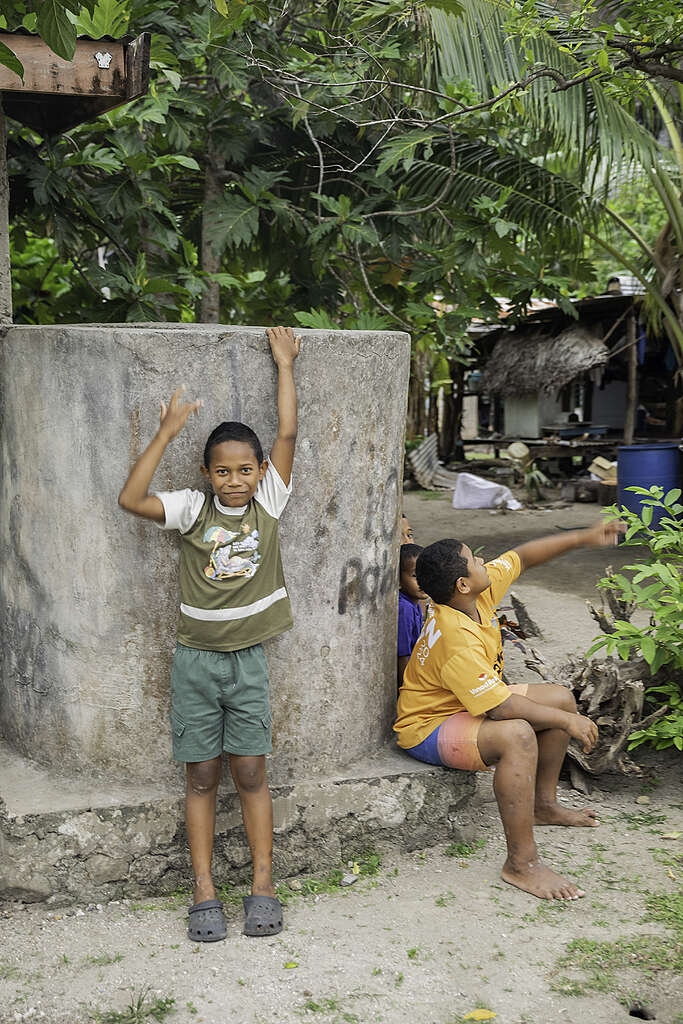
Facing the future
Greenpeace has been lucky to have a relationship with Kioa for a number of years now, and we are continually learning from this remarkable community.
Last week, as part of our Voyaging Oceania project, we returned to the island. Our purpose was twofold —- to carry messages from the island to leaders gathering in Nadi this week for the Pacific Pre-COP, and to support the Kioa community in their efforts to improve water security for the island.
Unlike Tuvalu itself, with its eight atolls, Kioa is a mountainous, forested and richly fertile island. It will remain habitable far into the future. Kioans did not initially migrate from Vaitupu due to climate change, but the move was prophetic. They now have a lifeboat.
However, even Kioa faces challenges on our rapidly warming planet, in particular when it comes to water. Climate change is shifting once reliable rainfall patterns. On top of this, the island is already feeling the effect of this year’s intensifying El Niño event, which for Fiji means reduced rainfall and prolonged dry spells.
Right now, fresh water has to be carefully rationed, and is only available for a few hours a day. During last week’s visit aboard our campaigning ship Oceania, Greenpeace was privileged to work with the Kioa community on a new solar-powered water distribution project for the island.
Designed and led by the island, the project involves using a solar pump to move water from a reliable source to a storage tank and then using gravity to distribute the water around the village.
It was a lesson in how local knowledge and ingenuity can be the backbone of today’s climate solutions. To build a dam around the source, the local community knew the exact spot where they could gather gravel at low tide to mix with the cement. They took only what was needed, knowing that all resources must be carefully conserved. Kioa has no roads and no machinery, and it was an all-of-island effort to carry the materials up to the project site, including many heavy bags of sand and rock.
Such projects truly bring to life the vision of a resilient, locally-led, fossil fuel free Pacific.