

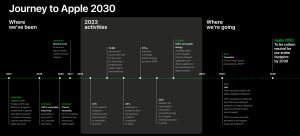
Apple is expanding its clean energy and nature restoration projects in Australia and Aotearoa, New Zealand. The company announced new solar power deals in Victoria. It also launched large-scale forest restoration projects in both the North and South Islands of New Zealand. These investments are part of Apple’s broader plan to achieve carbon-neutral products and supply chains by 2030.
The initiatives will provide more renewable energy for Apple customers. They will also boost the company’s efforts in verified carbon removal.
Lisa Jackson, Apple’s Vice President of Environment, Policy and Social Initiatives, said:
“By 2030, we want our users to know that all the energy it takes to charge their iPhone or power their Mac is matched with clean electricity. We’re proud to do our part to support Australia’s transition to a cleaner grid and drive positive impacts for communities and nature.”
The tech giant says the Australian projects will produce more than 1 million megawatt-hours (MWh) of clean electricity each year. Meanwhile, the New Zealand forest program aims to restore and protect around 8,600 hectares of land.
Powering Australia: Apple’s Solar Leap Forward
Apple’s new renewable energy agreement centers on the Lancaster Solar Project in Victoria. The site could deliver between 80 and 108 megawatts (MW) of solar capacity when fully operational. Construction is now underway, and the first energy is expected to reach Australia’s grid within the next few years.
This project marks Apple’s first major power purchase agreement (PPA) in Australia. The company will match clean energy generation with the electricity Australians use to charge their devices. In effect, the company will offset the electricity footprint of its customers’ daily device use with a new renewable supply.
Industry analysts note that corporate PPAs like Apple’s are a major driver of Australia’s energy transition. Corporate demand for clean power funds new renewable projects. It also pushes developers to grow their capacity. By committing to large volumes of generation, Apple is helping to strengthen Australia’s grid reliability while lowering emissions.

Apple’s PPA for the 108 MW in Victoria is a key renewable energy deal in Australia. However, it is mid-sized compared to the overall market. The largest corporate PPAs, such as Rio Tinto’s 1.3 GW Upper Calliope Solar Farm agreement, dwarf Apple’s PPA by over tenfold in capacity.
The iPhone maker’s new PPA is still significant. It’s the company’s first major one in Australia. It reflects the trend of tech companies driving the demand for clean energy. This boosts grid reliability and cuts emissions.
Restoring Nature: A Greener New Zealand Partnership
In parallel, Apple’s Restore Fund will invest in restoring and protecting native forest ecosystems across New Zealand. The company is working with Climate Asset Management. This group is a joint venture of HSBC Asset Management and Pollination.
The project will span about 8,600 hectares in total, with several sites in the Central North Island and one in the South Island. The restoration plan includes:
- Replanting native trees,
- Improving forest management, and
- Conserving existing woodlands.
These activities aim to remove carbon dioxide from the atmosphere while improving biodiversity and local water quality.
Apple states that its Restore Fund projects use strict carbon accounting standards and have third-party verification. Apart from carbon storage, the company expects measurable benefits for ecosystems and local communities.
Native reforestation helps make New Zealand’s landscapes stronger. It fights floods, reduces erosion, and boosts resilience against climate stress.
- SEE MORE on Apple:
Two Paths, One Goal: Clean Power Meets Carbon Removal
Apple plans to address energy and land-use emissions by combining solar energy with reforestation. Solar projects directly decarbonize electricity. Meanwhile, forest work removes carbon from the atmosphere.
This “two-track” model fits Apple’s global sustainability plan. The company already powers all of its offices, retail stores, and data centers with 100% renewable electricity. But a large portion of its footprint comes from manufacturing and product use — areas that require new solutions.

The Australia–New Zealand program focuses on two key areas: using renewables to power devices and offsetting leftover emissions with verified removals.
Measuring Apple’s Real-World Impact
Apple has pledged to publish regular updates on both the renewable and forest projects. Key metrics include:
- Clean-energy generation: more than 1 million MWh per year in Australia.
- Forest coverage: 8,600 hectares under protection or restoration in New Zealand.
- Carbon removal: verified carbon credits from restored native forests over the next 20 years.
- Local benefits: jobs in solar construction, sustainable forestry, and biodiversity monitoring.
The company also emphasizes engagement with local communities. In New Zealand, this means working with iwi (Māori group) and local councils. They help ensure projects match land use and cultural needs. In Australia, teaming up with local contractors will create short-term construction jobs and long-term maintenance roles.
READ MORE:
- Apple’s Clean Energy Blueprint: A Huge Leap with a 60% Carbon Cut
- Apple’s Earnings and (AAPL) Stock Up, Emissions Down: How Its 2030 Vision Is Paying Off
How This Fits into Apple’s 2030 Roadmap
Apple has reduced its total emissions by more than 45% since 2015, even as its business has grown. The company aims for net-zero by 2030. It will reduce most emissions directly and use reliable carbon removals for the rest.
The Restore Fund started in 2021 with $200 million. In 2023, it got another $200 million. It invests in nature-based projects around the globe. Goldman Sachs and Climate Asset Management co-manage it.
The focus is on financial returns tied to verified carbon outcomes. The New Zealand initiative represents one of the fund’s largest projects in the Asia-Pacific region so far.
On the energy side, Apple and its suppliers now operate more than 16 gigawatts of renewable capacity globally. The Australian PPA adds another piece to that network and supports Apple’s goal of using clean electricity across its entire value chain.

What It Means for Australia and New Zealand
For Australia and New Zealand, Apple’s participation brings attention and investment to emerging climate markets. In Australia, companies like Apple, Amazon, and Microsoft are speeding up new solar and wind projects. The sector generated over 35% of the nation’s electricity from renewables in 2024, a record high.
In New Zealand, restoring forests is key to hitting national emissions goals. The government plans to plant and restore one billion trees by 2030. Private-sector investment will help cover funding and capacity needs. As such, Apple’s Restore Fund investments help meet national goals. They also boost biodiversity and support community livelihoods.
A Template for Tech
Apple’s latest expansion highlights the merging of technology, clean energy, and nature-based climate action. By connecting renewable power in Australia with forest restoration in New Zealand, the company is building a region-wide portfolio of verified, measurable climate initiatives.
The next few years will show how well these projects keep their promises. This includes generating megawatt-hours of solar power and restoring hectares of healthy forest. Transparent reporting, third-party audits, and community partnerships will be key to maintaining credibility.
If Apple succeeds, its model could show other global companies how to invest in clean energy and restore nature for real climate progress.
- FURTHER READING: Apple Stock (AAPL) Goes Green: 14,000-Acre California Forest Deal Advances Carbon Neutral Strategy
The post Apple Doubles Down on Carbon Removal with Solar and Forest Projects Across Oceania appeared first on Carbon Credits.
For most businesses, the emissions that matter most sit outside their own walls. Scope 3 emissions, everything generated across your value chain, from the suppliers who make your inputs to the customers who use your products, typically make up the majority of a company’s total carbon footprint. Under the Corporate Sustainability Reporting Directive (CSRD), those value-chain emissions now have to be measured and disclosed with a rigour that spend-based estimates alone struggle to satisfy. This guide sets out how to improve Scope 3 data accuracy for CSRD: the calculation methods open to you, how to move from estimates to verified supplier data, and how to govern that data so it holds up to audit.
![]()
A carbon credit is a commitment that extends well into the future. The tonne of CO₂ compensated for today from a nature-based carbon project must remain out of the atmosphere for good, which means the forest behind the credit has to remain standing long after the transaction is complete. For any buyer, this raises a defining question: What ensures that the forest endures?
![]()
What replaced the cheap REDD credit on the boardroom slide deck, and why procurement is leading the rewrite.
Three years ago, a corporate slide showing a portfolio of cheap REDD+ credits could carry a board meeting. The number was big, the price was low, and the press release wrote itself. Today, that same slide gets sent back with questions. The questions are uncomfortable, the answers are unclear, and your general counsel is suddenly in the room.
Conventional carbon offsets are not dead. The voluntary carbon market retired 202 million tonnes in 2025, and the Morgan Stanley Institute for Sustainable Investing survey published in January 2026 confirmed that interest from corporate buyers remains substantial. What changed is the credibility threshold. The integrity floor has risen, the disclosure scrutiny has tightened, and the buyer profile has shifted. This article tracks what changed, what sophisticated buyers now ask before signing, and what serious corporates are putting on the board slide instead.
What boards used to buy, and why it stopped working
The 2020 to 2022 model was simple: buy a large tranche of avoidance credits at low single-digit prices, retire them against the company footprint, announce the carbon-neutral claim, and move on. Most of those credits came from REDD+ projects, renewable energy installations in countries where the renewable energy was already economic, or methane projects with thin documentation.
Several things broke that model. Academic research published in 2023, including a widely cited Science paper, found that the majority of REDD+ credits issued under the most common methodologies did not represent additional reductions when tested against rigorous counterfactuals. The Voluntary Carbon Markets Integrity Initiative published its Claims Code of Practice, which sets requirements for what companies can credibly claim from credit use. The European Union finalised its Green Claims Directive, restricting how companies can describe products as climate-neutral. France’s Décret 2022-539 already restricts carbon neutrality advertising. California’s AB 1305 imposes disclosure requirements on any company making net-zero or carbon-neutral claims while doing business in the state.
The collective effect: the cheap credit no longer buys the announcement, and the announcement now carries litigation risk.
The integrity reset: ICVCM, VCMI, and what changed
The Integrity Council for the Voluntary Carbon Market published the Core Carbon Principles in 2023 and began assessing methodologies against them in 2024. The first methodologies received the CCP label later that year. The point of the label is to give corporate buyers a defensible quality screen they can cite in disclosure.
The Voluntary Carbon Markets Integrity Initiative complements this on the demand side. Its Claims Code of Practice defines what a buyer can say (Silver, Gold, or Platinum claims, with associated requirements) based on the quality of credits used and the underlying decarbonisation strategy. Together, CCP and VCMI build a quality stack: CCP on the supply, VCMI on the claim, with the science-based target sitting underneath both.
The reset is not a ban on offsets. It is a ratchet. Credits that meet the new bar continue to clear; credits that do not, do not. The Morgan Stanley survey found that 61% of current buyers like the CCP label concept but that supply of labelled credits remains limited. That supply constraint is now visible in pricing.
What sophisticated buyers ask before they sign
The questions on the procurement scorecard have changed. A 2022 buyer might have asked about price, vintage, and project type. A 2026 buyer asks five different questions before any of those.
- What does the counterfactual look like, and who validated it.
- What is the permanence regime, and what is the buffer pool exposure.
- What is the leakage risk, and how is it mitigated.
- What rating has the project received from the independent ratings agencies (Sylvera, BeZero, Calyx Global), and what was the rationale.
- What is the documentation discipline that survives an audit four years from now when the procurement team that signed the contract has moved on.
If the vendor cannot answer those five questions on a first call, the conversation ends. Conversely, if the vendor can answer them with documented specificity, the conversation often expands beyond a single transaction toward a multi-year engagement.
Where this leaves your near-term commitments
You probably have near-term commitments that pre-date the integrity reset. Public targets to be carbon neutral by 2025 or 2030. Product-level claims that ran in last year’s marketing. Disclosed reduction trajectories that assumed continued access to cheap credits.
You have three workable paths. The first is to re-baseline your strategy, replacing the most exposed credits with higher-quality alternatives and adjusting the public language to match what you can defend. The second is to shift the underlying spend from offsetting outside your value chain to investing inside your value chain, where reductions count against Scope 3 directly and the audit trail is cleaner. The third is to keep the strategy and absorb the risk, which is increasingly the most expensive option once you price in litigation, restatement, and reputational exposure.
Most serious buyers are choosing the second path. It moves the carbon spend from a compliance cost to a procurement and resilience investment, and it removes the central failure point of the legacy model: the disconnect between where the emissions occurred and where the reductions sat. Nature-based supply chain investments, structured under the GHG Protocol Land Sector and Removals Standard and aligned to the SBTi FLAG Guidance, are the asset class that fits this brief. They generate inventory-grade reductions, they produce audit-grade documentation, and they survive the new claim restrictions because the carbon math sits inside the value chain that the disclosure already covers.
If you are reassessing a carbon strategy under the new integrity bar, or rebuilding a board narrative that has to survive a more skeptical audience, the carbon and sustainability experts at Carbon Credit Capital can help. The Dual-Value Model gives you a defensible alternative to legacy offset purchases, with the documentation and operational integration that survives the procurement scorecard and the audit. Schedule a consultation.


-
Climate Change11 months ago
Guest post: Why China is still building new coal – and when it might stop
-
Greenhouse Gases11 months ago
Guest post: Why China is still building new coal – and when it might stop
-

 Greenhouse Gases2 years ago
嘉宾来稿:满足中国增长的用电需求 光伏加储能“比新建煤电更实惠”
-

 Climate Change2 years ago
嘉宾来稿:满足中国增长的用电需求 光伏加储能“比新建煤电更实惠”
-
Climate Change2 years ago
Bill Discounting Climate Change in Florida’s Energy Policy Awaits DeSantis’ Approval
-

 Renewable Energy9 months ago
Sending Progressive Philanthropist George Soros to Prison?
-

 Carbon Footprint2 years ago
US SEC’s Climate Disclosure Rules Spur Renewed Interest in Carbon Credits
-
Greenhouse Gases1 year ago
嘉宾来稿:探究火山喷发如何影响气候预测