
The UK’s greenhouse gas emissions fell by 5.7% in 2023 to their lowest level since 1879, according to new Carbon Brief analysis.
The last time UK emissions were this low, Queen Victoria was on the throne, Benjamin Disraeli was prime minister, Mosley Street in Newcastle became the first road in the world with electric lighting and 59 people died in the Tay Bridge disaster in Dundee.
Carbon Brief’s analysis, based on preliminary government energy data, shows emissions fell to just 383m tonnes of carbon dioxide equivalent (MtCO2e) in 2023. This is the first time they have dropped below 400MtCO2e since Victorian times.
Other key findings from the analysis include:
- The UK’s emissions are now 53% below 1990 levels, while GDP has grown by 82%.
- The drop in emissions in 2023 was largely due to an 11% fall in gas demand. This was due to higher electricity imports after the French nuclear fleet recovered, above-average temperatures and weak underlying demand driven by high prices.
- Gas demand would have fallen even faster, but for a 15% fall in UK nuclear output.
- Coal use fell by 23% in 2023 to its lowest level since the 1730s, as all but one of the UK’s remaining coal-fired power stations closed down.
- Transport was the single-largest sector in terms of emissions, followed by buildings industry, agriculture and electricity generation. The electricity sector likely dropped below agriculture for the first time.
While the 23MtCO2e reduction in 2023 was faster than the 14MtCO2e per year average needed to reach net-zero by 2050, it was mostly unrelated to deliberate climate action. The UK will need to address emissions from buildings, transport, industry and agriculture to reach its 2050 target.
The analysis is the latest in a long-running series of annual estimates from Carbon Brief, covering emissions during 2022, 2020, 2019, 2018, 2017, 2016, 2015 and 2014.
Lowest since 1879
The UK’s territorial greenhouse gas emissions – those that occur within the country’s borders – have now fallen in 25 of the 34 years since 1990.
(Consumption-based emissions, including CO2 embedded in imported goods and services, were increasing until 2007, but have since fallen at a similar rate to territorial emissions.)
Apart from brief rebounds after the global financial crisis and the Covid-19 lockdowns, UK emissions have fallen during every year for the past two decades.
The latest 23MtCO2e (5.7%) reduction in 2023 takes UK emissions down to 383MtCO2e, according to Carbon Brief’s new analysis.
This is the lowest since 1879 – outside the 1926 general strike – as shown in the figure below.

Having dropped to a then-record low for the modern era of 404MtCO2e during the height of Covid in 2020, UK emissions bounced back in 2021 as the economy reopened.
While emissions declined in 2022, they remained above 2020 levels. In 2023, however, emissions fell below the lows seen during Covid lockdowns, to levels not seen since Victorian times.
Accidental action
The biggest contributor to the drop in UK greenhouse gas emissions in 2023 was an 11% reduction in gas demand, which accounted for around two-thirds of last year’s overall decline. This took the UK’s gas demand to its lowest level since the 1980s.
However, the drop in 2023 was not primarily due to deliberate climate action.
The figure below shows the estimated actual drop in emissions in red, followed by contributions from a series of factors that decreased emissions, in blue, and other factors in grey.
The most significant factor was the UK returning to its long-term position as a net electricity importer in 2023, reducing demand for domestically generated power from gas by more than 20%.
This followed an anomalous year in 2022, when the UK was a net exporter for the first time ever, as a result of widespread outages in the French nuclear fleet.
Lower demand for gas power accounted for more than two-thirds of the fall in gas use overall.
Next, above-average temperatures reduced the need for heating, while continuing very high prices since Russia’s invasion of Ukraine caused weak underlying demand for gas.
Reflecting both of these factors, there was a 6% drop in domestic demand in 2023, accounting for a fifth of the overall decline in gas consumption. A similar 7% drop in commercial demand for gas accounted for another tenth of the total, with a 5% drop in industrial demand the remainder.
Finally, the figure shows that there was a small reduction in gas demand and associated CO2 emissions as a result of increased wind and solar generation.
The impact of rising wind and solar capacity in 2023 was muted by average windspeeds being below average and the average number of sun hours falling sharply compared with 2022.

The UK’s emissions would have fallen even further in 2023 if not for a 15% decline in the output of the nation’s nuclear fleet. This followed the closure in 2022, of the Hunterston B station in Scotland and the Hinkley Point B plant in Somerset, as well as maintenance outages.
The decline in 2023 means UK nuclear output fell to the lowest level since the early 1980s. Following the site closures in 2022, the UK only has five operational nuclear power plants remaining, all but one of which – Sizewell B in Suffolk – are due to close this decade.
Out of coal
After gas, the next-largest driver of falling UK emissions in 2023 was coal, accounting for around 14% of the overall drop in emissions.
The decline of coal use in the UK – for homes, railways, factories and power stations – is a major part of the long-term reduction in greenhouse gas emissions over the past 30 years.
Factors in this long-term decline include controls on domestic coal burning to limit air pollution, the end of steam railways, the shift from coal-based “town gas” to “natural” gas from the North Sea, the deindustrialisation of the 1970s and the “dash for gas” of the 1990s.
More recently, coal demand has dropped precipitously as the rapid build-out of renewable sources of electricity has combined with falling demand and carbon pricing that favours gas.
The figure below shows how UK coal demand surged during the industrial revolution before levelling off through the 20th century, barring general strikes in 1921 and 1926.
Coal demand has been falling steadily since the passage of the Clean Air Act in 1956, in response to London’s “great smog” of 1952. In 2023, UK coal demand fell by another 23% to the lowest level since the 1730s, when George II was on the throne and Robert Walpole was prime minister.

The recent reduction of coal demand is largely down to the demise of coal power, which made up around 40% of the UK’s electricity generation as recently as 2012. Coal power output has fallen by 97% over the past decade, accounting for 87% of the fall in UK coal demand overall.
In 2023, only 1% of the UK’s electricity came from coal, with three coal-fired plants closing down: the coal units at Drax in Yorkshire; Kilroot in Northern Ireland; and West Burton A in Lincolnshire.
As of the start of October 2023, only one coal plant remains – the Ratcliffe-on-Soar site in Nottinghamshire. Operator Uniper plans to close Ratcliffe in September 2024, ahead of the government’s deadline to end coal power by October 2024.
Sectoral shifts
The reductions in gas use for power and building heat, as well as the fall in coal use for power, further cemented the transport sector as the largest contributor to UK emissions in 2023.
This is shown in the figure below, which highlights how transport emissions have barely changed over the past several decades as more efficient cars have been offset by increased traffic.
The power sector was the largest contributor to the UK’s emissions until 2014. In 2023, it was likely only the fifth-largest below transport, buildings, industry and – for the first time – also agriculture.

As of 2023, transport emissions were only around 10% below 1990 levels and made up nearly a third of the UK’s overall total. There are now more than a million electric vehicles (EVs) on the UK’s road, which will have avoided around 2MtCO2e of annual emissions.
However, the government has also frozen or cut fuel duty every year since 2010, rather than increasing it in line with inflation, adding up to around 20MtCO2e to the UK’s total.
Emissions from buildings – chiefly for heating and cooling – are the second-largest contributor to the UK’s emissions, accounting for around a fifth of the total.
They were around one-third lower than 1990 levels in 2023, with improved insulation and boiler regulations making the UK’s buildings more efficient to heat.
Efficiency improvements dried up around a decade ago and the fall in building emissions since 2021 has been driven by high prices suppressing demand, rather than deliberate policy choices.
Industrial emissions made up an estimated tenth of the UK’s total in 2023, having fallen by two-thirds since 1990 and by a quarter in the past decade.
In common with many other developed economies, the UK shifted from heavy industry towards advanced manufacturing and services from the 1970s onwards. However, industrial energy efficiency improvements and a shift to lower-carbon fuels are also part of the picture.
Agricultural emissions have barely changed for decades, making up just over a tenth of the UK’s total in 2023 and having fallen just 12% since 1990 as livestock herds have shrunk.
There was a small decrease in farm emissions in 2022 as the energy crisis filtered through into surging prices for fertilisers. For the figure above, Carbon Brief assumes the reduced fertiliser use in 2022 continued in 2023, as fertiliser prices only eased in summer 2023.
Decoupling emissions
The drop in UK emissions in 2023 came as the economy flatlined, growing by just 0.4% on 2022 levels. The UK’s emissions are now 53% below 1990 levels while the economy has grown 82%.
This “decoupling” of emissions from economic growth is shown in the figure below. As noted above, this analysis is based on territorial emissions within the UK’s borders.
Consumption-based emissions including imported goods and services were climbing in the early part of this century. However, emissions cuts over the past two decades have been very largely driven by sectors that cannot easily be “outsourced”, particularly power and building heat.

The UK is now in a mild recession and the economy is only expected to grow by around 1% in 2024. Recent trends in the “emissions intensity” of the UK economy – the emissions per unit of GDP – and weak economic growth suggests that emissions could continue to fall in 2024.
On the other hand, gas and oil prices are easing to pre-crisis levels, while above-average temperatures may not continue for another year. Petrol demand rose by nearly 5% in 2023 as traffic continued to rebound from the pandemic – and jet fuel use similarly climbed by 16%.
Moreover, the one-off impact of the UK returning to net electricity imports has now unwound. As such, further emissions cuts in 2024 are far from guaranteed.
Target practise
While the UK has made rapid progress in cutting its territorial emissions since 1990, it remains only around halfway to reaching its net-zero target for 2050, as the chart figure shows.
Emissions fell by 23MtCO2e in 2023, according to Carbon Brief’s analysis. This is faster than the 14MtCO2e reduction needed every year for the next quarter-century to reach net-zero by 2050.

However, with only one coal-fired power station remaining and the power sector overall now likely only the fifth-largest contributor to UK emissions, the country will need to start cutting into gas power and looking to other sectors, if it is to continue making progress towards its targets.
This will mean expanding wind and solar capacity to reduce gas use, while retaining gas-fired power stations for periods of low wind and starting to build low-carbon alternatives, such as gas with carbon capture and storage, long-term energy storage or hydrogen-fired turbines.
Emissions from road transport and buildings will be key areas if the UK is to progress, which is why changes to government plans around electric vehicles and heat pumps could be problematic.
Similarly, a government decision to “carry forward” the “surplus” emissions cuts from earlier years – largely due to external events such as Covid – would severely weaken UK targets at a time when continued ambition is needed, to stay on track for medium- and long-term climate goals.
Methodology
The starting point for Carbon Brief’s analysis of UK greenhouse gas emissions is preliminary government estimates of energy use by fuel. These are published quarterly, with the final quarter of each year appearing in figures published at the end of the following February. The same approach has accurately estimated year-to-year changes in emissions in previous years (see table, below).

One large source of uncertainty is the provisional energy use data, which is revised at the end of March each year and often again later on. Emissions data is also subject to revision in light of improvements in data collection and the methodology used, with major revisions in 2021.
The table above applies Carbon Brief’s emissions calculations to the comparable energy use and emissions figures, which may differ from those published previously.
Another source of uncertainty is the fact that Carbon Brief’s approach to estimating the annual change in emissions differs from the methodology used for the government’s own provisional estimates. The government has access to more granular data not available for public use.
Carbon Brief’s analysis takes figures on the amount of energy sourced from coal, oil and gas reported in Energy Trends 1.2. These figures are combined with conversion factors for the CO2 emissions per unit of energy, published annually by the UK government. Conversion factors are available for each fuel type, for example, petrol, diesel, gas, coal for electricity generation.
For oil, the analysis also draws on Energy Trends 3.13, which further breaks down demand according to the subtype of oil, for example, petrol, jet fuel and so on. Similarly, for coal, the analysis draws on Energy Trends 2.6, which breaks down solid fuel use by subtype.
Emissions from each fuel are then estimated from the energy use multiplied by the conversion factor, weighted by the relative proportions for each fuel subtype.
For example, the UK uses roughly 50m tonnes of oil equivalent (Mtoe) in the form of oil products, around half of which is from road diesel. So half the total energy use from oil is combined with the conversion factor for road diesel, another one-fifth for petrol and so on.
Energy use from each fossil fuel subtype is mapped onto the appropriate emissions conversion factor. In some cases, there is no direct read-across, in which case the nearest appropriate substitute is used. For example, energy use listed as “bitumen” is mapped to “processed fuel oils – residual oil”. Similarly, solid fuel used by “other conversion industries” is mapped to “petroleum coke”, and “other” solid fuel use is mapped to “coal (domestic)”.
The energy use figures are calculated on an inland consumption basis, meaning they include bunkers consumed in the UK for international transport by air and sea. In contrast, national emissions inventories exclude international aviation and shipping.
The analysis, therefore, estimates and removes the part of oil use that is due to the UK’s share of international aviation. It draws on the UK’s final greenhouse gas emissions inventory, which breaks emissions down by sector and reports the total for domestic aviation.
This domestic emissions figure is compared with the estimated emissions due to jet fuel use overall, based on the appropriate conversion factor. The analysis assumes that domestic aviation’s share of emissions is equivalent to its share of jet fuel energy use.
In addition to estimating CO2 emissions from fossil fuel use, Carbon Brief assumes that CO2 emissions from non-fuel sources, such as land-use change and forestry, are the same as a year earlier. Remaining greenhouse gas emissions are assumed to change in line with the latest government energy and emissions projections.
These assumptions are based on the UK government’s own methodology for preliminary greenhouse gas emissions estimates, published in 2019.
Note that the figures in this article are for emissions within the UK measured according to international guidelines. This means they exclude emissions associated with imported goods, including imported biomass, as well as the UK’s share of international aviation and shipping.
The Office for National Statistics (ONS) has published detailed comparisons between various different approaches to calculating UK emissions, on a territorial, consumption, environmental accounts or international accounting basis.
The UK’s consumption-based CO2 emissions increased between 1990 and 2007. Since then, however, they have fallen by a similar number of tonnes as emissions within the UK.
Bioenergy is a significant source of renewable energy in the UK and its climate benefits are disputed. Contrary to public perception, however, only around one quarter of bioenergy is imported.
International aviation is considered part of the UK’s carbon budgets and faces the prospect of tighter limits on its CO2 emissions. The international shipping sector has a target to at least halve its emissions by 2050, relative to 2008 levels.


The post Analysis: UK emissions in 2023 fell to lowest level since 1879 appeared first on Carbon Brief.
Analysis: UK emissions in 2023 fell to lowest level since 1879
Dozens of governments led by the EU and the UK have pledged to throw their political weight behind a rapid electrification of the world’s economy, billed as a “powerful weapon” for cutting reliance on planet-heating fossil fuels.
At a high-level summit in London’s Mansion House on Tuesday, energy ministers and business leaders were joined by UN secretary-general António Guterres in calling for faster action to curb demand for oil, coal and gas by powering homes, industry and transport with clean electricity.
Electrification – which spans measures such as switching from petrol cars to electric vehicles – has emerged as a key priority in climate and energy policy circles this year.
COP31 co-hosts Türkiye and Australia have made a global target for electricity to meet 35% of final energy demand by 2035, up from around 20% today, the main plank of this year’s action agenda for the UN summit. Reaching that level is necessary to keep the 1.5C warming limit within reach, according to the International Renewable Energy Agency (IRENA).
Turkish COP31 President-Designate Murat Kurum said earlier this month that the host nation would work to forge “a strong global coalition that is ready and determined to act” and promised to facilitate access to technical assistance.
-
Did Colombia’s energy transition just come to a halt?
With promises to lift a ban on oil and gas exploration and scale back renewables support, Colombia’s new Tiger President could threaten the country’s clean energy shift -
COP31 presidency ‘open’ to reflecting Santa Marta in UN climate process, ministers say
The two co-hosts want the gathering of over 60 governments in Colombia to be reflected in the official UNFCCC climate process -
UN asks AI companies to reveal full environmental impacts
UN chief António Guterres says big AI firms should disclose the emissions, water and energy use of their data centres amid community opposition


Rallying support for electrification
Five months before countries are due to sign on to the pledge, efforts to rally support gathered momentum at London Climate Action Week, as a record-breaking heatwave baking the capital underscored the urgency of weaning the world off fossil fuels.
Guterres said the world faces an “historic opportunity” to turn the page on its dependence on fossil fuels and fully embrace clean electrification powered by renewables.
“The age of clean electrification is here,” he added. “The question is whether we can build the grids and storage, mobilize the investment, and deliver the infrastructure at the speed and scale required”.
Without investment and government policies supporting upgrades in infrastructure, ageing power grids are often unable to handle the growing influx of renewable energy, creating bottlenecks and slowing the energy transition, according to the International Energy Agency (IEA).
Meanwhile, the high upfront costs of buying electric vehicles, heat pumps and industrial equipment remains a challenge to switch households and businesses away from using fossil fuels across the world, according IEA analysts, despite these technologies being cheaper over their whole lifecycle.
Global coordination platform
In a bid to overcome these hurdles, the European Commission and the UK government on Tuesday launched a new platform to coordinate global progress on electrification.
EU energy commissioner Dan Jorgensen said the goal was to build coalitions, draw up policy recommendations, share best practice and secure new funding to speed up the electrification of homes, industry and transport.
Brazil’s COP30 presidency, the joint Australia-Türkiye COP31 presidency, Ethiopia’s incoming COP32 presidency, Canada, the Philippines and South Korea joined the initiative at launch.
Jorgensen urged governments worldwide to “choose transformation over turbulence” and switch to clean electricity to make economies and societies more resilient and shield them from future shocks driven by volatile fossil fuels.
COP31 leaders unveil global targets, with spotlight on electrification
For many countries, especially those heavily reliant on imported fossil fuels, the oil and gas crisis triggered by the US and Israeli attacks on Iran and the ensuing blockade of the Strait of Hormuz has driven home the urgency of the clean energy transition.
The UK’s energy secretary Ed Miliband said on Tuesday that, unlike previous fossil fuel shocks, clean electrification now offers the world a clear alternative.
“An alternative that cannot be disrupted by foreign wars, that isn’t subject to global shocks because it is locked in stable prices at home, and that can create good jobs and drive growth,” he added, “an alternative that can deliver national security, energy security and indeed climate security.”
At the recent conference on transitioning away from fossil fuels in Santa Marta, a group of 60 governments led by the Netherlands and Colombia said electrification is one of the areas where they can align work with the UN climate talks.
Financial reforms needed
Achieving the electrification target – dubbed the “35 by 35” goal – will require significant financial resources. Investments in power grids alone need to double from their current rate to around $1 trillion each year in the next decade, according to IRENA.
But Guterres said that developing countries are still “starved from investment” in their clean energy sector. He urged deeper reforms of the global financial architecture by reducing lending risk, lowering the cost of capital and attracting more private investment.
Surangel Whipps Jr., president of the low-lying Pacific island state of Palau, said faster progress in electrification is a “powerful weapon in our arsenal”. But he warned that the energy transition would stall without “fit for purpose investment that is fast, predictable and accessible”.
The post EU, UK lead push for electrification as “powerful weapon” against fossil fuels appeared first on Climate Home News.
EU, UK lead push for electrification as “powerful weapon” against fossil fuels
A major ocean conference has ended in Mombasa, Kenya, with just a handful of countries committing to high-level political declarations on banning deep-sea mining, protecting climate-resilient coral reefs and combatting illegal fishing.
The Our Ocean Conference (OOC) brought together more than 5,000 delegates to discuss marine issues and make voluntary commitments to advance ocean sustainability.
It was the first time in the conference’s 11 editions that it had been held on African soil.
African countries played an “important leadership role” at the talks, observers told Carbon Brief, helping to drive ambition on fisheries transparency, a precautionary pause on deep-sea mining and developing proposals for marine protected areas on the high seas.
Across the three-day conference, attendees also made 320 separate commitments, including new funding for scientific research, improving waste-management programmes to reduce marine pollution and mapping Indigenous groups’ customary waters.
Some of these commitments were accompanied by announcements of new funding, with a total of $6.4bn “mobilised” across all pledges.
Several non-governmental organisations also released new reports during the conference, on topics ranging from the implementation of marine protected areas to “climate-resilient” coral reefs.
Observers told Carbon Brief that the commitments and discussions at the conference were “positive steps”, but added that these pledges must now be backed up by action.
During the opening ceremony, former US secretary of state John Kerry urged delegates to move “from commitments to implementation”.
Here, Carbon Brief outlines the key takeaways from the OOC across five major climate-related topics.
Background
The OOC was first held in Washington DC in 2014, where it was championed by Kerry.
The conference aims to “identify action-based solutions and make tangible commitments” towards addressing key issues facing the ocean, such as climate change and overfishing. It does so through voluntary commitments made by governments, non-governmental organisations, civil society groups and others.
These commitments align with the six “pillars” of the conference:
- The ocean-climate nexus
- Marine pollution
- Marine protected areas
- Maritime security
- Sustainable blue economy
- Sustainable fisheries
Since then, the conference has been held annually (with the exceptions of 2020 and 2021 during the Covid pandemic), with the host city changing every year.
Each edition of the conference is very different, attendees told Carbon Brief, and the host country plays a large role in setting the conference’s priorities.
For example, at the 2024 conference, held in Athens, Greece, shipping and sustainable tourism were discussed at length alongside the six existing pillars.
At this year’s summit, extra attention was paid to the roles of local communities in achieving a “healthy” ocean.
Since 2025, the conference has had its own dedicated secretariat, hosted at the research organisation, the World Resources Institute (WRI). (Prior to that, the US Department of State acted as the de-facto secretariat.)

Conference participants told Carbon Brief that the OOC has been “highly successful” in achieving its aims over the past decade.
An analysis of the first 10 years of the conference, published by WRI in 2025, found that of a total 2,618 commitments made at the OOC, around 1,130 had been completed and a further 1,005 were in progress.
In Mombasa this year, 104 countries and organisations made a total of 320 voluntary commitments. More than one-quarter of these commitments were made in the “sustainable blue economy” action area.
According to the preliminary report released by the secretariat at the conclusion of the OOC, the commitments made at the conference represent $6.4bn in “mobilised” finance. However, it is unclear from the report how much of this figure is new committed funding.
Marine protected areas
Marine protected areas (MPAs) are one of the six key action areas of the Our Ocean Conference.
A June 2026 independent assessment of the MPA-related commitments at previous editions of the OOC found that the conference has “made an outsized contribution to global marine conservation efforts”.
According to the analysis, more than one-third of the Earth’s MPAs stemmed from announcements made at the OOC – a total area of more than 10m square kilometres (km2).
This progress is the result of nearly two-thirds of MPA-related OOC commitments already fully implemented, the assessment says, while most of the remaining commitments “show evidence of progress”.
If all pledged MPAs were to be implemented, it would represent protection for around 14.4m km2 or 4% of the ocean.
The chart below shows the number of pledged actions related to MPAs and other area-based conservation methods that were pledged at the OOC between 2014 and 2025, coloured by the progress made on each commitment.
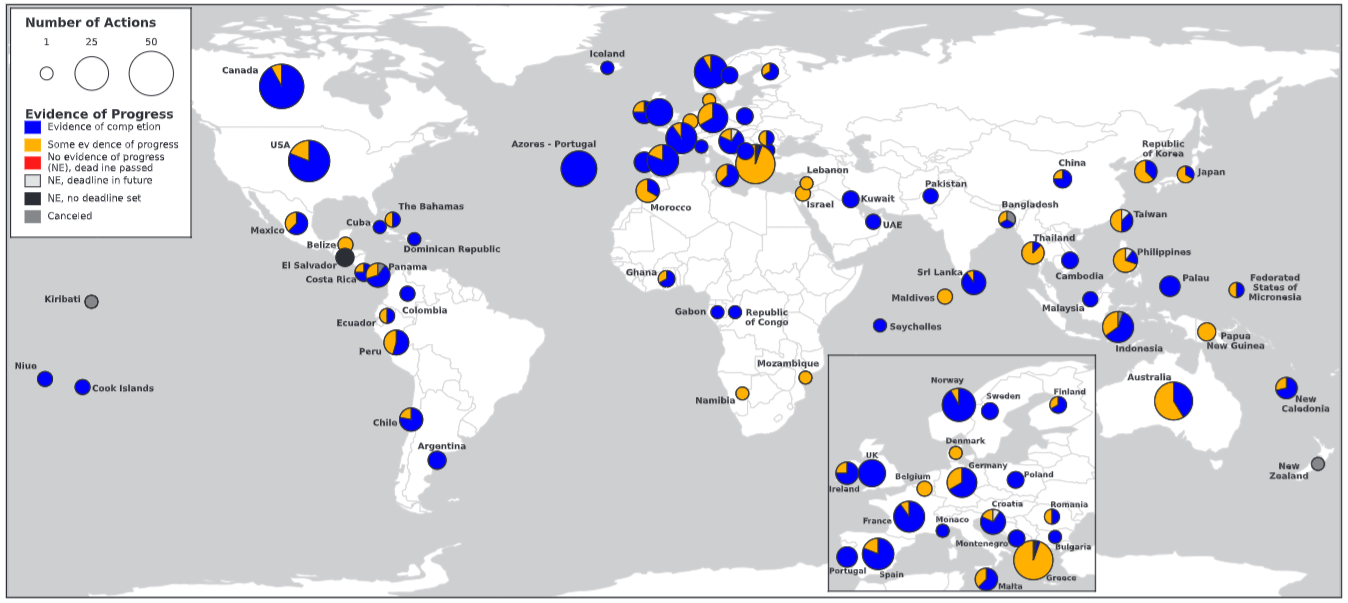
Several groups announced new MPAs – or the completion of previously announced MPA designations – at the OOC.
These included the establishment this year of two new MPAs in the Juan Fernández region of Chile, protecting a total of around 337,000km2 of ocean, and the approval of the Azores Marine Park, which will span 287,000km2 – making it the largest network of protected areas in the north Atlantic Ocean.
However, despite the progress made in designating MPAs, further work is needed to ensure that these areas are truly protected, experts told Carbon Brief in Mombasa.
A report released by the Smithsonian Tropical Research Institute (STRI) at the summit detailed the “implementation gap” facing MPAs. It noted that “at least half of existing MPAs remain unimplemented or operationally ineffective”, while just 3.5% of the global ocean is “fully and highly” protected.
Closing this gap will require “inclusive, sustained and context-sensitive design, management and funding approaches”, continued the report.
Dr Ana Spalding, the director of STRI’s Adrienne Arsht community-based resilience solutions initiative, told Carbon Brief that, while MPAs are typically evaluated based on their biodiversity outcomes, the communities that rely on ocean ecosystems are also very important to consider. Focusing on just one aspect or the other will result in an MPA that is not effective, she added:
“There’s going to be a sweet spot between the two.”
High Seas Treaty
The Agreement on the Conservation and Sustainable Use of Marine Biological Diversity of Areas Beyond National Jurisdiction – also known as the BBNJ Agreement or the High Seas Treaty – entered into force on 17 January 2026.
This followed the treaty, achieving the necessary 60 state ratifications on 19 September 2025. The week before the OOC, the east African nation of Comoros became the 90th party to ratify the agreement.
The first Conference of the Parties for the High Seas Treaty will be held in January 2027 in New York City. At that meeting, parties will be tasked with creating the rules of procedure, establishing the subsidiary bodies and carrying out other foundational work.
Because so many key decisions will be made at this COP1, it is “imperative” to have as many ratifications as possible before the conference begins, said Rebecca Hubbard, director of the High Seas Alliance, a coalition of non-governmental organisations that advocates for protection of the high seas. She added:
“We hope that well over 100 countries will be party to the agreement by COP1, so that they can be at the decision-making table.”

One of the key provisions of the High Seas Treaty is that it creates a mechanism for countries to establish MPAs in international waters. This will be key to achieving the “30 by 30” target of protecting 30% of the world’s land and oceans by 2030, Hubbard told Carbon Brief.
However, establishing a high-seas MPA under the agreement requires a thorough process, including a review by a scientific and technical subsidiary body, a consultation with parties and a vote by the COP. Thus, in order to achieve the “30 by 30” target, parties will need to act swiftly to begin the process of establishing high-seas MPAs, according to Hubbard. She said:
“It will be very, very tight. It’s definitely possible, but it requires really strong government leadership and prioritisation.”
She added that it is “essential” that governments begin forming proposals for high-seas MPAs before the COP meets in January, noting that some countries are already doing so.
At a side event on 16 June, representatives from South Africa and the EU detailed plans to propose a high-seas MPA that would link two existing protected areas in the sub-Antarctic – one South African and one French. Hubbard told Carbon Brief:
“That’s a really great example of what we can do with the High Seas Treaty – having developed and developing countries working together, sharing knowledge [and] developing scientific approaches together. I think that’s the hopeful future, collaboration [and] cooperation, that the High Seas Treaty really provides.”
Also at the summit, Senegal, Mauritania, the Gambia and Guinea-Bissau committed to creating “at least two” transboundary west African MPAs.
Deep-sea mining
Although deep-sea mining was not a major focus of the Mombasa talks, it did feature at several side events.
At a reception held by the Deep Sea Conservation Coalition (DSCC), Prof Rashid Sumaila of the University of British Columbia said the “wrong question is being asked” about deep-sea mining. He continued:
“It’s not whether they have the minerals, it’s whether extracting them gives a net-positive impact.”
Sumaila added that evaluating the risk of deep-sea mining will require a cost-benefit analysis that is as “broad and inclusive as possible”.
At the same reception, the foreign-affairs minister of Malawi, Dr George Chaponda, announced the country’s support of a “precautionary pause” on seabed mining in international waters. This would prohibit mineral exploration in such areas until there is robust scientific evidence showing limited environmental harm.
In doing so, Malawi became the first African country to support such a pause – and the 41st country overall to support a precautionary pause or moratorium on the activity.
Chaponda told the assembled guests that Malawi’s existence as a landlocked country did not preclude its involvement in the deep-sea debates, urging:
“To my fellow landlocked states: geography does not diminish our stake in the ocean.”
Later in the week, Kenya and Madagascar also announced their support for such a pause.
In a statement, David Willima, the Africa lead at DSCC, said:
“The leadership shown by Malawi, Kenya and Madagascar sends a vital signal that African nations are stepping forward to defend the deep ocean and are unwilling to accept the risks of deep-sea mining.”
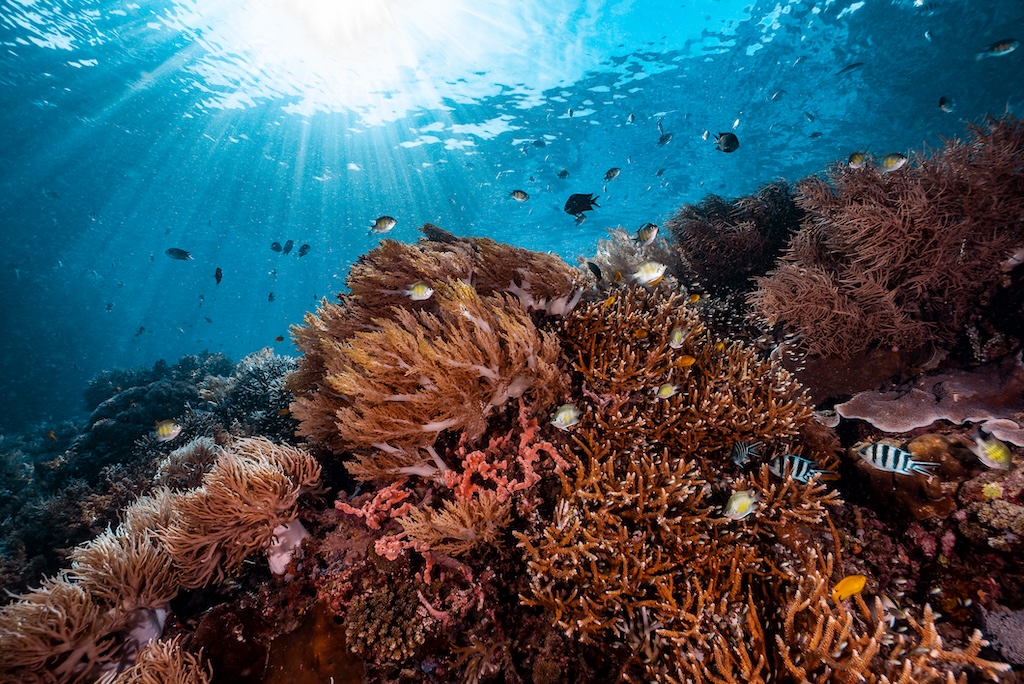
Coral reefs
At the third UN Ocean Conference (UNOC), held in Nice, France, in June 2025, 11 countries and several partner organisations launched the high-level commitment to protect “climate-resilient” coral reefs.
These are reefs that, according to scientists, have the “best chance of long-term survival in the face of climate change”.
(UNOC occurs every three years and is specifically focused on achieving the UN Sustainable Development Goal on sustainable ocean use. Unlike the OOC, UNOC results in a negotiated political declaration.)
A further four countries signed the commitment in Mombasa: Comoros, the Dominican Republic, Kenya and the UK. According to a representative at the launch event, the goal is to reach 31 signatories – representing 80% of the world’s coral cover – by COP31 in Turkey in November this year.
Signatory governments pledged their commitment to:
- Identifying climate-resilient reefs and prioritising their protection.
- Integrating coral-reef protection into national strategies and plans.
- Enacting policies to reduce the local pressures facing coral reefs, such as overfishing, pollution and overdevelopment.
- Implementing national reef monitoring programmes and action plans.
- Ensuring equity and working with local communities in protecting reefs.
The Mombasa conference also coincided with the presentation of a new study on climate-resilient reefs, covered in the 17 June edition of Carbon Brief’s Cropped newsletter. (The study is currently in the final stages of peer review.)
Building on a 2018 project that identified the 50 coral reefs that “form an optimal portfolio of reefs that are most likely to survive climate change”, the new work mapped more than 165,000km2 of coral reefs across 70 countries. These were found to have the best chances of persisting in the face of climate change and a warming, acidifying ocean.
Dr Emily Darling, director of coral-reef conservation at the Wildlife Conservation Society and a co-author of the study, told Carbon Brief that “one of the key things countries can do that have these important reefs is elevate them into national policy” across multiple government sectors.
She added that learning from these reefs will become vital over the coming months as El Niño warms the world’s oceans even further.
Darling told Carbon Brief:
“Climate change is not a single blanket on the world’s oceans. There are a lot of pockets of resilience, there are pockets of revolution for corals, and it’s all about finding those places, and how do we support them through the other local pressures that they experience that we know we can manage.”
Although few monetary coral-related commitments were made at the summit, Norway pledged to allocate NOK 20m ($2m) to the Global Fund for Coral Reefs.
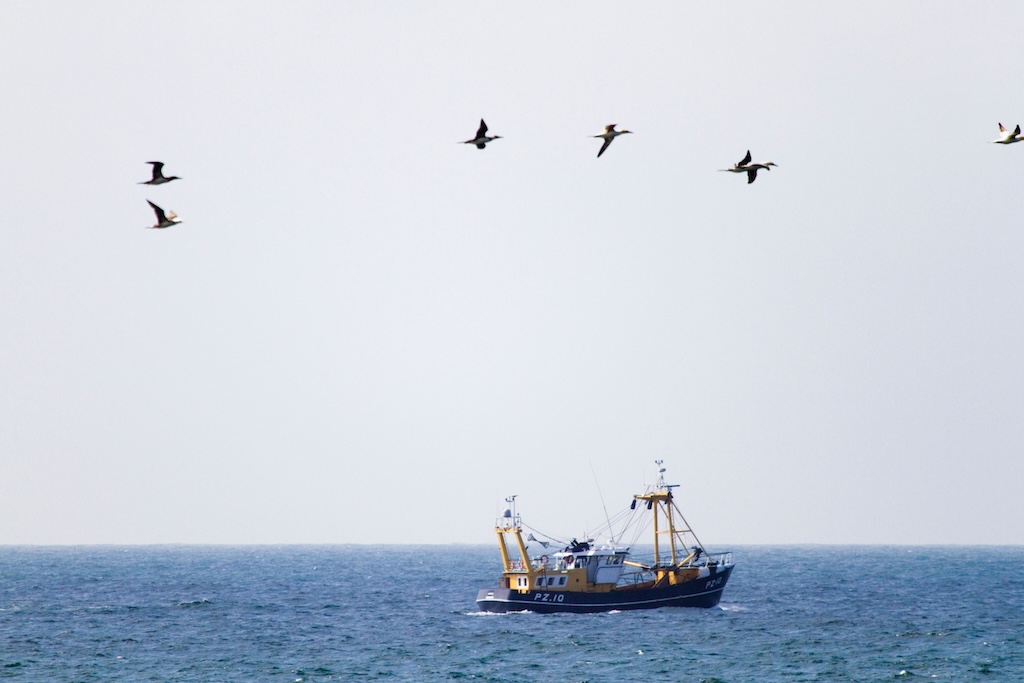
Fisheries
One of the major achievements of the summit was the adoption of the Mombasa Declaration to advance fisheries transparency and combat illegal fishing.
The declaration “recognise[s]” that illegal, unreported and unregulated (IUU) fishing is a major factor driving the unsustainable use of ocean resources and the degradation of marine ecosystems.
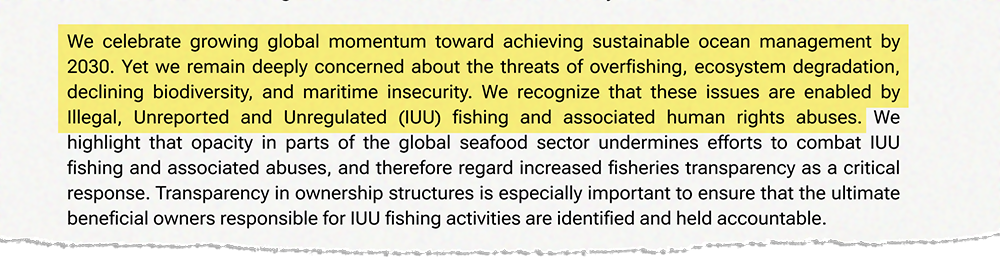
The declaration, which was signed by 16 national governments – eight of them from Africa – commits parties to follow a set of principles laid out in the Global Charter for Fisheries Transparency. This was developed and promoted by a group of civil society organisations known as the Coalition for Fisheries Transparency.
The commitments in the Mombasa Declaration fall within four broad categories:
- Supporting transparency and accountability in the fishing industry.
- Strengthening monitoring of fishing activities and cooperating with enforcement actions.
- Building capacity and supporting implementation of transparency reforms.
- Strengthening ocean-observing systems and promoting the use of open-access data.
The declaration notes that these principles should “apply to and benefit both small-scale and industrial fisheries” and support “broader ocean-management efforts”.
At a press conference announcing the launch of the declaration, Ghanaian fisheries and aquaculture minister Emelia Arthur called it a “global testament of our collective commitment to transparent fisheries”. She emphasised the importance of the sector to all aspects of life, saying:
“Fisheries is nutrition. Fisheries is food security. Fisheries is livelihoods. Fisheries is national security.”
Several civil society organisations, philanthropies, community groups and governments also made separate fisheries-related commitments at the summit.
The EU committed €46m ($52m) through its Horizon Europe research programme to fisheries work, including €32m ($36m) for “adaptive co-management strategies” and €14m ($16m) for research on conservation and sustainable management of migratory fishes.
The EU and Italy both also announced contributions to the European Maritime, Fisheries and Aquaculture Fund.
The government of Kenya made nine fisheries-related pledges at the summit, including committing to train compliance officers dedicated to combatting IUU fishing, developing management plans for all of its commercial fisheries and establishing bycatch mitigation measures.
At the summit, the UN Food and Agriculture Organization launched its biannual “state of world fisheries and aquaculture” report.
According to the report, the world set a new record for fisheries and aquaculture in 2024 – producing a total of 235m tonnes of fish and algae. This total consisted of nearly 92m tonnes of fish from capture fisheries, 103m tonnes of farmed fish and 40m tonnes of algae production.
The amount of fish produced by capture fisheries has remained largely stable since 2000, while aquaculture production has increased by an average annual percentage rate of just under 5%, according to the report.
While the largest growth has occurred in Africa, Latin America and the Caribbean, the vast majority of aquaculture production – 89% – occurs in Asia.
The report also says that more than one-third of the world’s marine fish stocks are overfished, with significant variation based on region and species. It adds that climate change may play an increasing role in driving the unsustainability of fisheries in the future:
“Despite the uncertainty of climate risks in the short, medium and long term, studies on the impacts of climate change on aquatic food systems around the world increasingly document the relevance and potential success of adaptation measures, urging decision-makers to integrate climate change considerations into fisheries and aquaculture planning and management.”

The post Mombasa: Key outcomes from the Our Ocean Conference in Kenya appeared first on Carbon Brief.
Mombasa: Key outcomes from the Our Ocean Conference in Kenya
Christopher Wright is the principal analyst at CarbonBridge, a decarbonisation consulting firm.
Less than two months ago, Colombia hosted the world’s first international conference on Transitioning Away from Fossil Fuels. This weekend, however, it appears that Colombia’s first ever leftist presidency has ended. Far-right candidate Abelardo de la Espriella, who was last week strongly endorsed by Donald Trump, will not only take the reins of government but also steer the future of Colombia’s energy transition.
As the world’s sixth-largest coal exporter, and fourth largest oil exporter in Latin America, Colombia plays a critical role in the world’s energy markets. However, this role had shrunk under President Gustavo Petro’s administration, as it sought to proactively shift the country away from its fossil-fuel based economy, ahead of a potential oil and gas production shortage over the next decade.
That could all change as De la Espriella’s takes power. Calling himself the Tiger (“El Tigre”), he has promised to focus on deregulation, exploit oil extraction “to the maximum” and leverage the energy sector as a key “engine of growth”.
Colombia’s world-leading energy transition
Over the last four years, Colombia has embarked on one of the most rapid and holistic energy transitions anywhere in the world. Shortly after coming to power in 2022, the government of Gustavo Petro halted new oil and gas exploration contracts, suspended all hydraulic fracking pilots, and pledged to end the development of new unabated coal power plants.
While many of these moves faced domestic and legislative challenges, they were widely praised in climate circles around the world.
Colombia soon became a pivotal member of the Powering Past Coal Alliance, the Beyond Oil and Gas Alliance and the Fossil Fuel Non-Proliferation Alliance. It then went on to host the biodiversity COP in 2024, launch a $40-billion climate transition investment portfolio, and famously, host the Santa Marta conference earlier this year.

While fossil fuels still comprise around 7% of Colombia’s GDP and 56% of its total exports, there were already signs that the transition policies had begun to have an effect.
Coal production last year fell to its lowest level in the last 22 years. According to the Colombian national association of coal producers, coal export volumes declined by 23% in 2025. While the oil sector has not seen an equivalent precipitous drop, production levels have remained historically low since COVID.
What about its domestic electricity sector?
Since the 1970s Colombia’s electricity sector has been dominated by large hydro-electric dams, endowing it with some of the lowest carbon electrons anywhere in the world. Today, close to 70% of its electricity supply comes from these large dams.
However, electricity demand rose by close to 10% under the Petro government. To meet this demand, total installed electricity capacity has expanded by a similar figure, and solar power has made up over 70% of new electricity capacity since.

As a result, by the end of 2025, gas power generation in the electricity sector had hit its lowest point since 2018. Wind power had doubled, and solar power generation had risen by over 630%. Colombia’s renewable energy association predicts that, by the end of 2026, the country may be home to more than 4.2 GW of installed variable renewable energy capacity.
Far-right jumps on energy challenges
Despite the progress, the last three years have been an incredibly challenging period for Colombia’s energy sector.
During Petro’s first two years in office, inflation remained above 10%, and interest rates stayed above 13% for most of 2023. This put a pause on new energy investments, as foreign direct investment fell by a third since 2022.
On top of this, Colombia suffered through an El Niño-fuelled drought in 2023-24, crippling its hydro-electric power supply. This forced the country to turn to expensive gas and coal power, just as both sectors had effectively begun to pull back. This sent electricity prices through the roof, increasing nearly 40% in a single year, and led the Petro government to intervene with price controls, aiming to protect everyday Colombians.
-
UN chief says fossil fuel industry must cut methane for warming “relief”
The UN Secretary-General urges drastic reductions in methane emissions, starting with the energy sector, to limit an expected overshoot of global warming beyond 1.5C -
COP31 presidency ‘open’ to reflecting Santa Marta in UN climate process, ministers say
The two co-hosts want the gathering of over 60 governments in Colombia to be reflected in the official UNFCCC climate process

Unsurprisingly, this made energy investors even more cautious. By the end of 2023, GDP growth had plummeted and renewable energy investments fell by 70%. Since then, all the major credit agencies have downgraded the country’s credit rating, making it even shakier to invest.
As a result, even with the new solar coming online, and 1.2 GW of additional hydro-power from the Ituango dam expected by 2028, the country could still face a major energy deficit by 2027, with permitting delays halting project developments, and 5.1 GW of approved projects unable to reach financial close.
Challenging domestic debate
This has led to a challenging domestic debate on energy policy. While 96% of Colombians want to see solar expand further, they have been understandably frustrated by high electricity bills and limited economic growth.
As a result, De la Espriella’s campaign, which has largely focused on taking a hardline stance to combat growing concerns around security and crime, was relatively open to solar power, but sought to blame Colombia’s current energy crisis on the speed of its current energy transition.
Branding himself as neither a climate denialist nor “dogmatic environmentalist” the incoming president who will take office in August, will likely seek to revoke the ban on new hydrocarbon exploration contracts, legalise fracking and restructure the national oil company, Ecopetrol.
While he is unlikely to cancel market-driven projects and may reduce regulatory hold-ups, it is also likely that he will shift away from the government’s recent overwhelming support for long-renewable energy and battery storage projects, which have driven much of the recent uptake in solar power.
Future of energy transition in doubt
In a country of close to 54 million people, the final election count was only decided by about 250,000 votes. However, this weekend’s margin belies the magnitude of the shift that will likely now take place.
With the country facing a potential domestic energy shortage 2027, President-elect De la Espriella has promised to revitalise the hydrocarbon economy, shifting Colombia’s recent energy transition on an entirely new course.
While this may unlock some regulatory challenges hindering renewables roll-out, broader support mechanisms for solar projects will likely be dismantled, and the broader economic transition abandoned, along with its recent flurry of international climate alliances.
He will also take his place among a wave of right-leaning Presidents that have swept to power across the continent in the last 18 months. This has seen right-wing electoral victories across Ecuador, Bolivia, Chile, Costa Rica, Argentina and now Colombia, with Peru’s Keiko Fujimori potentially joining the club soon – pending a final vote count.
With the Brazilian elections scheduled for October, and run-off scenarios between Lula and Flávio Bolsonaro still far too close to call, 2026 will undoubtedly be a pivotal year for Latin America’s energy future.
The post Did Colombia’s energy transition just come to a halt? appeared first on Climate Home News.


-
Greenhouse Gases11 months ago
Guest post: Why China is still building new coal – and when it might stop
-
Climate Change11 months ago
Guest post: Why China is still building new coal – and when it might stop
-

 Greenhouse Gases2 years ago
嘉宾来稿:满足中国增长的用电需求 光伏加储能“比新建煤电更实惠”
-

 Climate Change2 years ago
嘉宾来稿:满足中国增长的用电需求 光伏加储能“比新建煤电更实惠”
-
Climate Change2 years ago
Bill Discounting Climate Change in Florida’s Energy Policy Awaits DeSantis’ Approval
-

 Renewable Energy8 months ago
Sending Progressive Philanthropist George Soros to Prison?
-

 Carbon Footprint2 years ago
US SEC’s Climate Disclosure Rules Spur Renewed Interest in Carbon Credits
-
Greenhouse Gases11 months ago
嘉宾来稿:探究火山喷发如何影响气候预测