Connect with us

Published

on

The year 2025 saw the return to power of Donald Trump, a jewellery heist at the Louvre museum in Paris and an engagement that “broke the internet”.

Amid the biggest stories of the year, climate change research continued to feature prominently in news and social media feeds.

Using data from Altmetric, which scores research papers according to the attention they receive online, Carbon Brief has compiled its annual list of the 25 most talked-about climate-related studies of the past year.

The top 10 – shown in the infographic above and list below – include research into declining butterflies, heat-related deaths, sugar intake and the massive loss of ice from the world’s glaciers:

  1. Indicators of Global Climate Change 2024: annual update of key indicators of the state of the climate system and human influence
  2. Rapid butterfly declines across the US during the 21st century
  3. Global warming has accelerated: Are the UN and the public well informed?
  4. Community estimate of global glacier mass changes from 2000 to 2023
  5. The EAT-Lancet Commission on healthy, sustainable and just food systems
  6. Carbon majors and the scientific case for climate liability
  7. Estimating future heat-related and cold-related mortality under climate change, demographic and adaptation scenarios in 854 European cities
  8. Systematic attribution of heatwaves to the emissions of carbon majors
  9. Ambient outdoor heat and accelerated epigenetic aging among older adults in the US
  10. Rising temperatures increase added sugar intake disproportionately in disadvantaged groups in the US

Later in this article, Carbon Brief looks at the rest of the top 25 and provides analysis of the most featured journals, as well as the gender diversity and country of origin of authors.

New for this year is the inclusion of Altmetric’s new “sentiment analysis”, which scores how positive or negative a paper’s social media attention has been.

(For Carbon Brief’s previous Altmetric articles, see the links for 2024, 2023, 2022, 2021, 2020, 2019, 2018, 2017, 2016 and 2015.)

Global indicators

The top-scoring climate paper of 2025, ranking 24th of any research paper on any topic, is the annual update of the “Indicators of Global Climate Change” (IGCC) report.

The report was established in 2023 to help fill the gap in climate information between assessments of the Intergovernmental Panel on Climate Change (IPCC), which can take up to seven years to complete. It includes the latest data on global temperatures, the remaining carbon budget, greenhouse gas emissions and – for the first time – sea level rise.

Ragout: Indicators of Global Climate Change 2024: annual update of key indicators of the state of the climate system and human influence

The paper, published in Earth System Science Data, has an Altmetric score of 4,099. This makes it the lowest top-scoring climate paper in Carbon Brief’s list since 2017.

(An Altmetric score combines the mentions that published peer-reviewed research has received from online news articles, blogs, Wikipedia and on social media platforms such as Facebook, Reddit, Twitter and Bluesky. See an earlier Carbon Brief article for more on how Altmetric’s scoring system works.)

Previous editions of the IGCC have also appeared in Carbon Brief’s list – the 2024 and 2023 iterations ranked 17th and 18th, respectively.

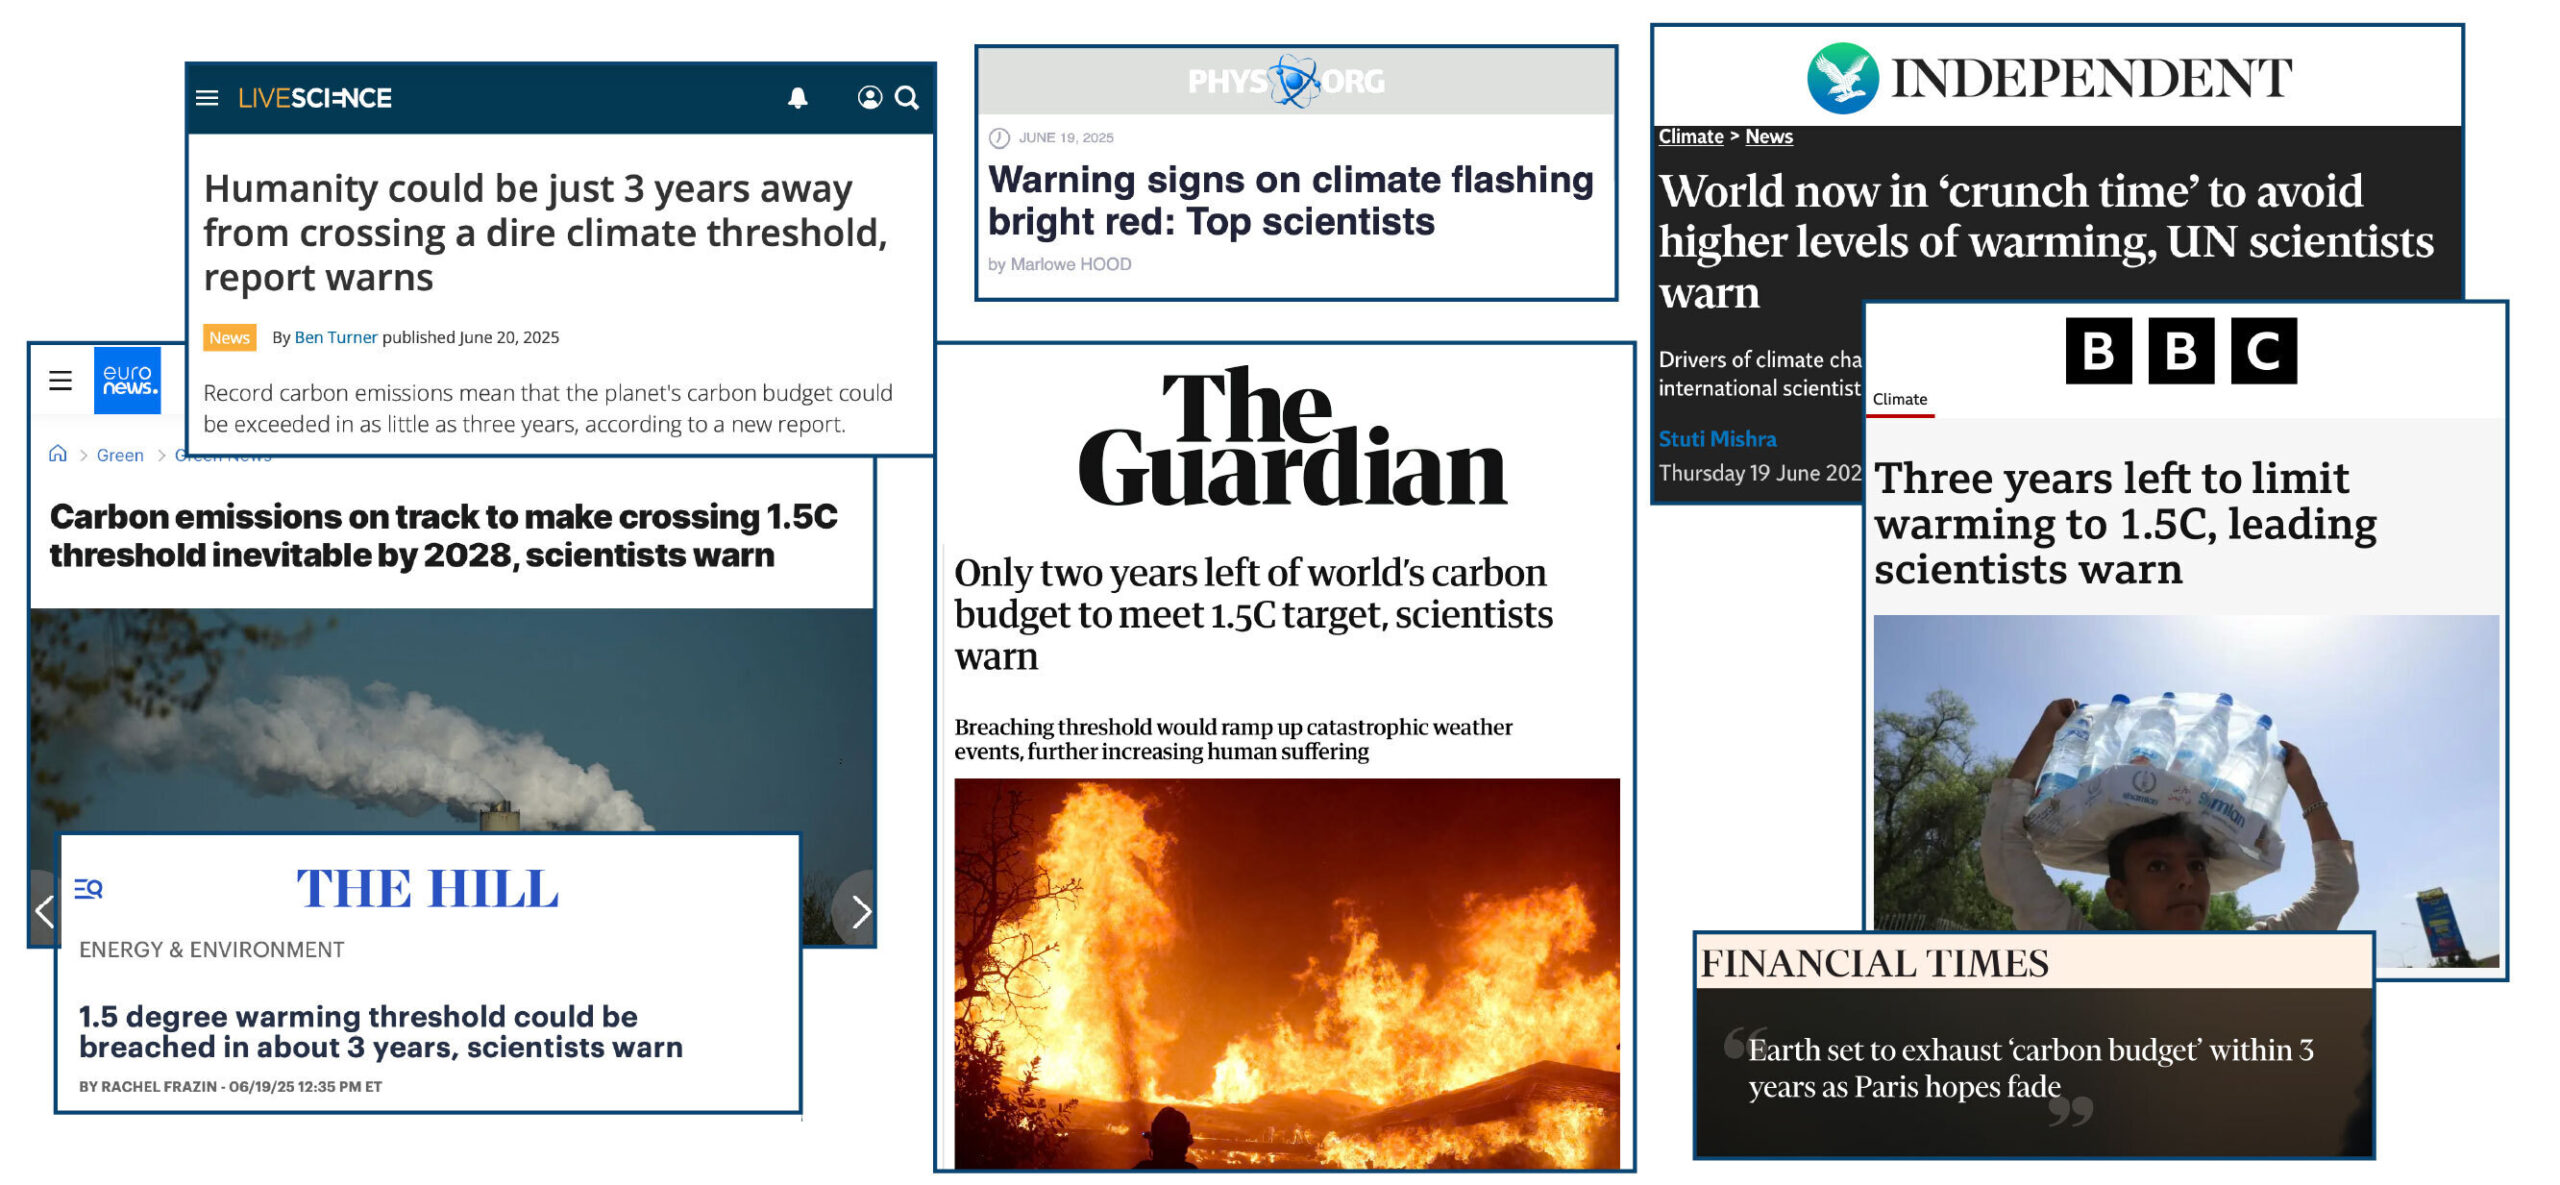
This year’s paper was mentioned 556 times in online news stories, including in the Associated Press, Guardian, Independent, Hill and BBC News.

Many outlets led their coverage with the study’s findings on the global “carbon budget”. This warned that the remaining carbon budget to limit warming to 1.5C will be exhausted in just three years if global emissions continue at their current rate.

Headline_Montage

In a Carbon Brief guest post about the study, authors Prof Piers Forster and Dr Debbie Rosen from the University of Leeds wrote:

“It is also now inevitable that global temperatures will reach 1.5C of long-term warming in the next few years unless society takes drastic, transformative action…Every year of delay brings reaching 1.5C – or even higher temperatures – closer.”

Forster, who was awarded a CBE in the 2026 new year honours list, tells Carbon Brief that media coverage of the study was “great” at “putting recent extreme weather in the context of rapid long-term rates of global warming”.

However, he adds:

“Climate stories are not getting the coverage they deserve or need at the moment so the community needs to get all the help we can for getting clear consistent messages out there.”

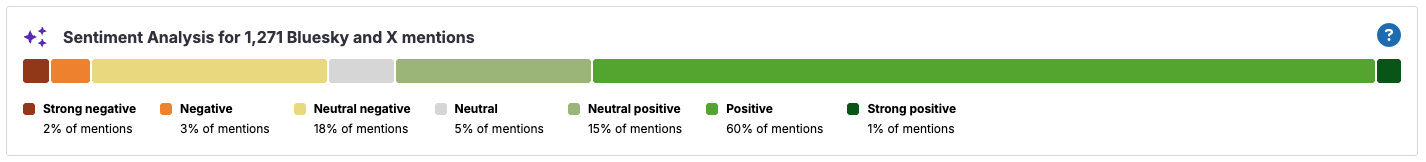
The paper was tweeted more than 300 times and posted on Bluesky more than 950 times. It also appeared in 22 blogs. 

Using AI, Altmetric now analyses the “sentiment” of this social media attention. As the summary figure below shows, the posts about this paper were largely positive, with an approximate 3:1 split of positive and negative attention.

Altmetric’s AI-generated summary of the sentiment of social media posts regarding the Forster et al.
Altmetric’s AI-generated summary of the sentiment of social media posts regarding the Forster et al. (2025) paper. Totals may add up to more than 100% because of rounding. Source: Altmetric

Butterfly decline

With an Altmetric score of 3,828, the second-highest scoring climate paper warns of “widespread” declines in butterfly numbers across the US since the turn of the century.

The paper, titled “Rapid butterfly declines across the US during the 21st century” and published in Science, identifies a 22% fall in butterfly numbers across more than 500 species between 2000 and 2020.

(There is a higher-scoring paper, “The 2025 state of the climate report: a planet on the brink”, in the journal BioScience, but it is a “special report” and was not formally peer reviewed.)

Ragout: Rapid butterfly declines across the United States during the 21st
century

The scale of the decline suggests “multiple and broadly acting threats, including habitat loss, climate change and pesticide use”, the paper says. The authors find that “species generally had stronger declines in more southerly parts of their ranges”, with some of the most negative trends in the driest and “most rapidly warming” US states.

The research was covered in 560 news articles, including the New York Times, Guardian, Associated Press, NPR, El País and BBC News. Much of the news coverage led with the 22% decline figure.

The paper was also mentioned in 13 blogs, more than 750 Bluesky posts and more than 600 tweets.

The sentiment analysis reveals that social media posts about the paper were largely negative. However, closer inspection reveals that this negativity is predominantly towards the findings of the paper, not the research itself.

For example, a Bluesky post on the “distressing” findings by one of the study’s authors is designated as “neutral negative” by Altmetric’s AI analysis.

In a response to a query from Carbon Brief, Altmetric explains that the “goal is to measure how people feel about the research paper itself, not the topic it discusses”. However, in some cases the line can be “blurred” as the AI “sometimes struggles to separate the subject matter from the critique”. The organisation adds that it is “continuously working on improving our models to better distinguish between the post’s content and the research output”.

Altmetric’s AI-generated summary of the sentiment of social media posts regarding the Forster et al.
Altmetric’s AI-generated summary of the sentiment of social media posts regarding the Forster et al. (2025) paper. Totals may add up to more than 100% because of rounding. Source: Altmetric

On the attention that the paper received, lead author Dr Collin Edwards of Washington State University in Vancouver says that “first and foremost, people care about butterflies and our results are broad-reaching, unequivocal and, unfortunately, very concerning”.

Edwards tells Carbon Brief he hopes the clarity of the writing made the paper accessible to readers, noting that he and his co-authors “sweat[ed] over every word”.

The resulting news coverage “accurately captured the science”, Edwards says:

“Much as I wish our results were less consistently grim, the consistency and simplicity of our findings mean that even if a news story only provides the highest level summary, it isn’t misleading readers by skipping some key caveat or nuance that changes the interpretation.”

Warming ‘acceleration’

In third place in Carbon Brief’s list for 2025 is the latest scientific paper from veteran climatologist Dr James Hansen, former director of the NASA Goddard Institute for Space Studies and now adjunct professor at Columbia University’s Earth Institute.

The paper, titled “Global warming has accelerated: Are the UN and the public well-informed?” was published in the journal Environment: Science and Policy for Sustainable Development. It generated an Altmetric score of 3,474.

Ragout: Global Warming Has Accelerated: Are the United Nations and the Public Well-Informed

The study estimates that the record-high global temperatures in the last few years were caused by a combination of El Niño and a reduction in air pollution from international shipping.

The findings suggest that the cooling effect of aerosols – tiny, light‑scattering particles produced mainly by burning fossil fuels – has masked more of the warming driven by greenhouse gases than previously estimated by the IPCC.

As efforts to tackle air pollution continue to reduce aerosol emissions, warming will accelerate further – reaching 2C by 2045, according to the research.

The paper was covered by almost 400 news stories – driven, in part, by Hansen’s comments in a press briefing that the Paris Agreement’s 2C warming limit was already “dead”.

Hansen’s analysis received a sceptical response from some scientists. For example, Dr Valerie Masson-Delmotte, an IPCC co-chair for its most recent assessment report on climate science, told Agence France-Presse the research “is not published in a climate science journal and it formulates a certain number of hypotheses that are not consistent with all the available observations”.

In addition, other estimates, including by Carbon Brief, suggest new shipping regulations have made a smaller contribution to warming than estimated by Hansen.

Hansen tells Carbon Brief that the paper “did ok” in terms of media coverage, although notes “it’s on [scientists] to do a better job of making clear what the core issues are in the physics of climate change”.

With more than 1,000 tweets, the paper scored highest in the top 25 for posts on Twitter. It was also mentioned in more than 800 Bluesky posts and on 27 blogs. 

The sentiment analysis suggests that these posts were largely positive, with just a small percentage of negative comments.

Altmetric’s AI-generated summary of the sentiment of social media posts regarding the Hansen et al.
Altmetric’s AI-generated summary of the sentiment of social media posts regarding the Hansen et al. (2025) paper. Totals may add up to more than 100% because of rounding. Source: Altmetric

Making the top 10

Ranking fourth in Carbon Brief’s analysis is a Nature paper calculating changes in global glacier mass over 2000-23. The study finds glaciers worldwide lost 273bn tonnes of ice annually over that time – with losses increasing by 36% between 2000-11 and 2012-23.

The study has an Altmetric score of 3,199. It received more news coverage than any other paper in this year’s top 25, amassing 1,187 mentions. with outlets including the Guardian, Associated Press and Economic Times.

At number five, with an Altmetric score of 2,860, is the EAT-Lancet Commission on healthy, sustainable and just food systems.

Carbon Brief’s coverage of the report highlights that “a global shift towards ‘healthier’ diets could cut non-CO2 greenhouse gas emissions, such as methane, from agriculture by 15% by 2050”. It adds:

“The findings build on the widely cited 2019 report from the EAT-Lancet Commission – a group of leading experts in nutrition, climate, economics, health, social sciences and agriculture from around the world.”

Also making the top 10 – ranking sixth and eighth – are a pair of papers published in Nature, which both link extreme heat to the emissions of specific “carbon majors” – large producers of fossil fuels, such as ExxonMobil, Shell and Saudi Aramco,.

The first is a perspective, titled “Carbon majors and the scientific case for climate liability”, published in April. It begins:

“Will it ever be possible to sue anyone for damaging the climate? Twenty years after this question was first posed, we argue that the scientific case for climate liability is closed. Here we detail the scientific and legal implications of an ‘end-to-end’ attribution that links fossil fuel producers to specific damages from warming.”

The authors find “trillions (of US$) in economic losses attributable to the extreme heat caused by emissions from individual companies”.

The paper was mentioned 1,329 times on Bluesky – the highest in this year’s top 25. It was also mentioned in around 270 news stories.

Published four months later, the second paper uses extreme event attribution to assess the impact of climate change on more than 200 heatwaves recorded since the year 2000.

The authors find one-quarter of the heatwaves would have been “virtually impossible” without human-caused global warming. They add that the heatwaves were, on average, 1.7C hotter due to climate change, with half of this increase due to emissions stemming from the operations and production of carbon majors.

This study was mentioned in almost 300 news stories – including by Carbon Brief – as well as 222 tweets and 823 posts on Bluesky.

In seventh place is a Nature Medicine study, which quantifies how heat-related and cold-related deaths will change over the coming century as the climate warms.

A related research briefing explains the main findings of the paper:

“Heat-related deaths are estimated to increase more rapidly than cold-related deaths are estimated to decrease under future climate change scenarios across European cities. An unrealistic degree of adaptation to heat would be required to revert this trend, indicating the need for strong policies to reduce greenhouse gases emissions.”

The paper was mentioned 345 times in the news, including in the Financial Times, New Scientist, Guardian and Bloomberg.

The paper in ninth place also analyses the health impacts of extreme heat. The study, published in Science Advances, finds that extreme heat can speed up biological ageing in older people.

Rounding out the top 10 is a Nature Climate Change study, titled “Rising temperatures increase added sugar intake disproportionately in disadvantaged groups in the US”.

The study finds that at higher temperatures, people in the US consume more sugar – mainly due to “higher consumption of sugar-sweetened beverages and frozen desserts”. The authors project that warming of 5C would drive additional sugar consumption of around 3 grams per day, “with vulnerable groups at an even higher risk”.

Elsewhere in the top 25

The rest of the top 25 includes a wide range of research, from “glacier extinction” and wildfires to Amazon drought and penguin guano.

In 13th place is a Nature Climate Change study that finds the wealthiest 10% of people – defined as those who earn at least €42,980 (£36,605) per year – contributed seven times more to the rise in monthly heat extremes around the world than the global average.

The authors also explore country-level emissions, finding that the wealthiest 10% in the US produced the emissions that caused a doubling in heat extremes across “vulnerable regions” globally.

(See Carbon Brief’s coverage of the paper for more details.)

In 15th place is the annual Lancet Countdown on health and climate change – a lengthy report with more than 120 authors.

The study warns that “climate change is increasingly destabilising the planetary systems and environmental conditions on which human life depends”.

This annual analysis from the Lancet often features in Carbon Brief’s top 25 analysis. After three years in the Carbon Brief’s top 10 over 2020-23, the report landed in 20th place in 2023 and missed out on a spot in the top 25 altogether in 2024.

In 16th place is a Science Advances study, titled “Increasing rat numbers in cities are linked to climate warming, urbanisation and human population”. The study uses public complaint and inspection data from 16 cities around the world to estimate changes in rat populations.

It finds that “warming temperatures and more people living in cities may be expanding the seasonal activity periods and food availability for urban rats”.

The study received 320 new mentions, including in the Washington Post, New Scientist and National Geographic.

In 21st place is a Nature Climate Change paper, titled “Peak glacier extinction in the mid-21st century”. The study authors “project a sharp rise in the number of glaciers disappearing worldwide, peaking between 2041 and 2055 with up to ~4,000 glaciers vanishing annually”.

Completing the top 25 is a Nature study on the “prudent planetary limit for geological carbon storage” – where captured CO2 is injected deep underground, where it can stay trapped for thousands of years.

In a Carbon Brief guest post, study authors Dr Matthew Gidden and Prof Joeri Rogelj explain that carbon dioxide removal will only be effective at limiting global temperature rise if captured CO2 is injected “deep underground, where it can stay trapped for thousands of years”.

The guest post warns that “geological carbon storage is not limitless”. It states that “if all available safe carbon storage capacity were used for CO2 removal, this would contribute to only a 0.7C reduction in global warming”.
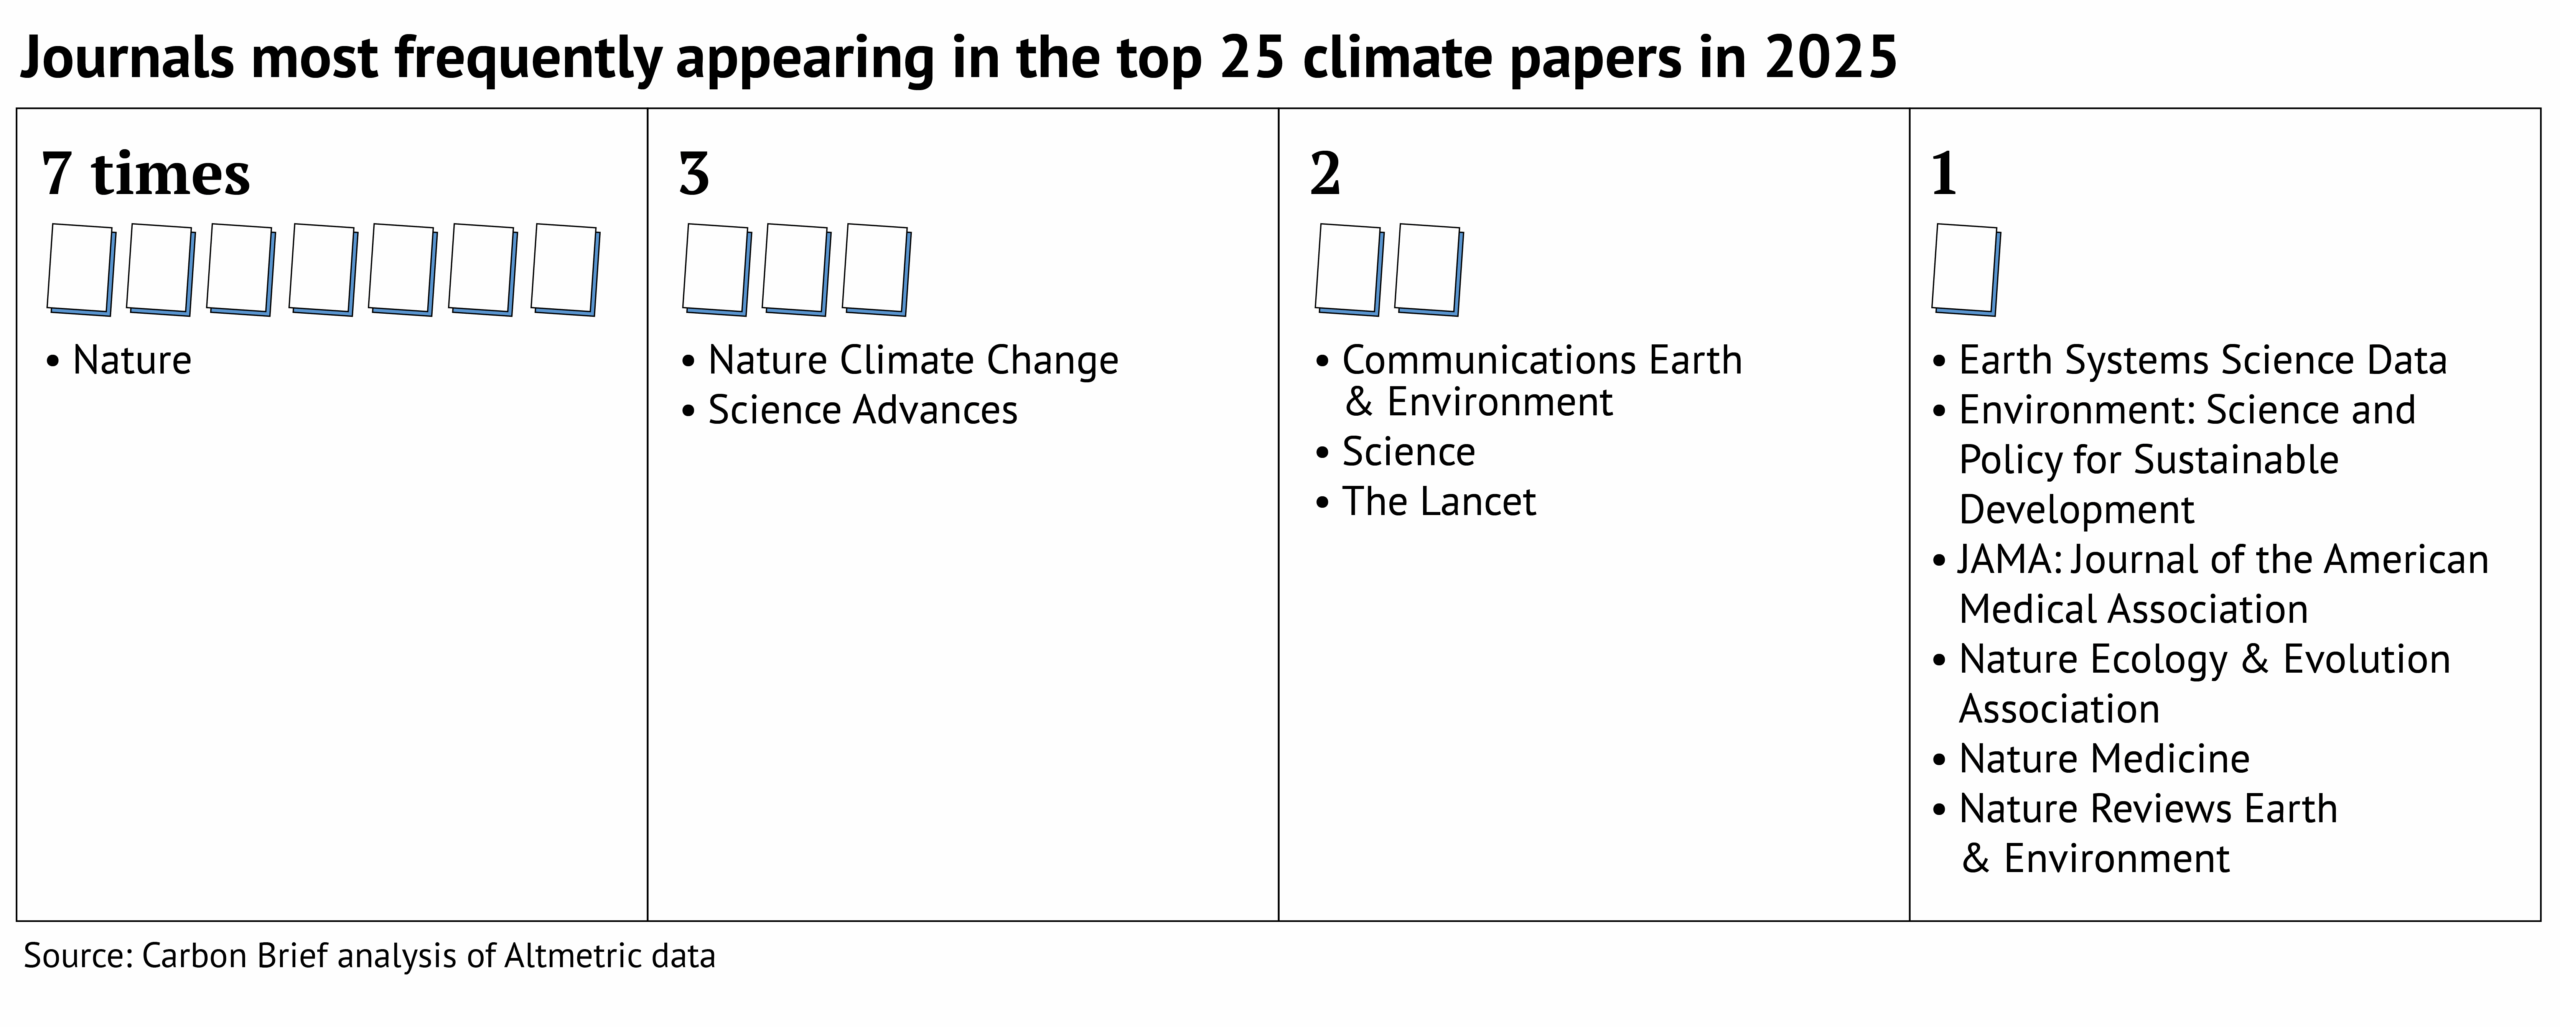
Top journals

The journal Nature dominates Carbon Brief’s top 25, with seven papers featured.

Many other journals in the Springer Nature stable also feature, including Nature Climate Change (three), Communications Earth & Environment (two), as well as Nature Ecology & Evolution, Nature Medicine and Nature Reviews Earth & Environment (one each).

Also appearing more than once in the top 25 are Science Advances (three), Science (two) and the Lancet (two).

This is shown in the graphic below.

Graphic: Journals most frequently appearing in the top 25 climate papers in 2025

All the final scores for 2025 can be found in this spreadsheet.

Diversity in the top 25

The top 25 climate papers of 2025 cover a huge range of topics and scope. However, analysis of their authors reveals a distinct lack of diversity.

In total, the top 25 includes more than 650 authors – the highest number since Carbon Brief began this analysis in 2022.

This is largely due to a few publications with an exceptionally high number of authors. For example, the 2025 report of the Lancet Countdown on health and climate change has almost 130 authors alone, accounting for almost one-fifth of authors in this analysis.

Carbon Brief recorded the gender and country of affiliation for each of these authors. (The methodology used was developed by Carbon Brief for analysis presented in a special 2021 series on climate justice.)

The analysis reveals that 88% of the authors of the climate papers most featured in the media in 2025 are from institutions in the global north.

Global South: The “global south” is a term used to broadly describe lower-income countries in regions such as Africa, Asia and Latin America. It is often used to denote nations that are either in… Read More

Carbon Brief defines the global north as North America, Europe, Japan, Australia and New Zealand. It defines the global south as Asia (excluding Japan), Africa, Oceania (excluding Australia and New Zealand), Latin America and the Caribbean.

The analysis shows that 53% of authors are from European institutions, while only 1% of authors are from institutions in Africa.

Further data analysis shows that there are also inequalities within continents. The map below shows the percentage of authors from each country, where dark blue indicates a higher percentage. Countries that are not represented by any authors in the analysis are shown in grey.

The number of all authors from the climate papers most featured in the media in 2025.
The number of all authors from the climate papers most featured in the media in 2025. The designations employed and the presentation of the material on this map do not imply the expression of any opinion whatsoever on the part of Carbon Brief concerning the legal status of any country, territory, city or area or of its authorities, or concerning the delimitation of its frontiers or boundaries. Map by Carbon Brief using Datawrapper.

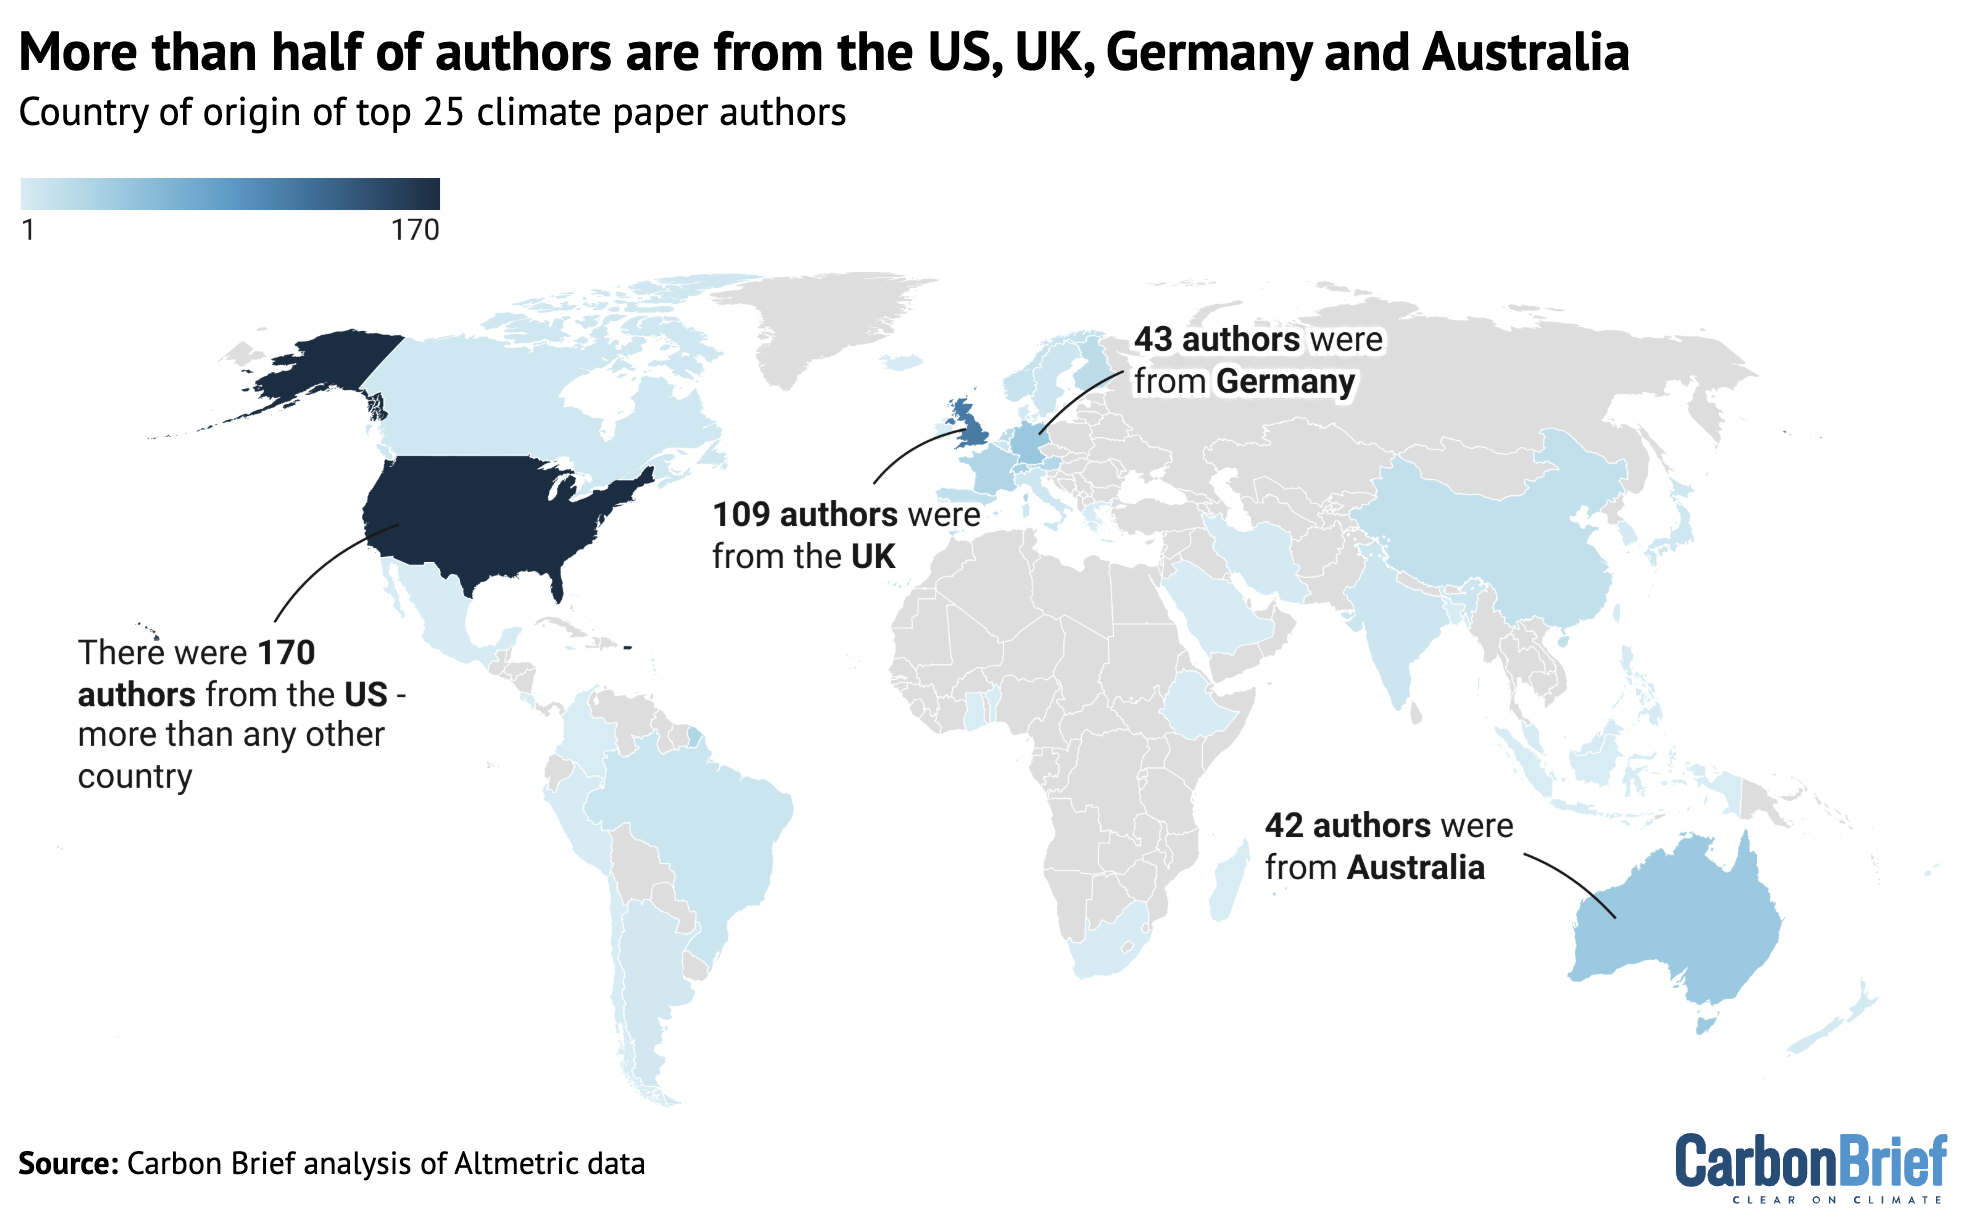
The top-ranking countries on this map are the US and the UK, which account for 26% and 16% of the authors, respectively.

Carbon Brief also analysed the gender of the authors.

Only one-third of authors from the top 25 climate papers of 2025 are women and only five of the 25 papers list a woman as lead author.

The plot below shows the number of authors from each continent, separated into men (dark blue) and women (light blue).

The number of men (dark blue) and women (light blue) listed as authors in the climate papers most featured in the media in 2025, shown by continent.
The number of men (dark blue) and women (light blue) listed as authors in the climate papers most featured in the media in 2025, shown by continent. Chart by Carbon Brief using Datawrapper.

The full spreadsheet showing the results of this data analysis can be found here. For more on the biases in climate publishing, see Carbon Brief’s article on the lack of diversity in climate-science research.

The post Analysis: The climate papers most featured in the media in 2025 appeared first on Carbon Brief.

Analysis: The climate papers most featured in the media in 2025

Continue Reading

Climate Change

The EU should partner with Global South to protect carbon-storing wetlands

Published

on

Fred Pearce is a freelance author and journalist writing on behalf of Wetlands International Europe.

Everybody knows that saving the Amazon rainforest is critical to our planet’s future. But the Pantanal? Most people have never heard of Brazil’s other ecological treasure, the world’s largest tropical wetland – let alone understood its importance, as home to the highest concentration of wildlife in the Americas, while keeping a billion tonnes of carbon out of the atmosphere, and protecting millions of people downstream from flooding.

Hundreds of millions of euros are spent every year on protecting and restoring the world’s forests. Wetlands are just as important, yet don’t get anything like the same recognition or investment. That, scientists insist, has to change. And Europe can lead the way.

For forests, the EU already provides financial and technical assistance for a series of Forest Partnerships with non-EU countries, as part of its Global Gateway strategy for investing globally in environmentally and socially sustainable infrastructure. Such partnerships operate in Guyana, the Democratic Republic of the Congo, Mongolia and elsewhere.

I believe the time is now right to establish a parallel EU Wetland Partnerships, framing wetlands as a strategic, cost-effective investment offering high financial, environmental and social returns.

Wetlands store a third of global soil carbon

Wetlands come in many shapes and sizes: freshwater peatlands, lakes and river floodplains, as well as coastal salt marshes, mangroves and seagrass beds. They are vital natural infrastructure, maintaining river flows that buffer against extreme weather events such as floods and drought, as well as protecting biodiversity, and providing jobs and economic opportunities, often for the most vulnerable nature-dependent communities.

Wetlands cover just six percent of the land surface, but store a third of global soil carbon – twice the amount in all the world’s forests. Yet they have been disappearing three times faster than forests, with 35 percent lost in the past half century.

A just agricultural transition takes root in Brazil

Their loss adds to climate change, causes species extinction, triggers mass exoduses of fishers and other people whose livelihoods disappear, and depletes both surface and underground water reserves. Continued wetlands destruction is estimated to contribute five percent of global CO2 emissions – more than aviation and shipping combined.

EU Wetland Partnerships can be critical to unlocking finance to stem the losses and realise the benefits by promoting nature-based economic development, such as sustainable aquaculture, eco-tourism, and forms of wetlands agriculture known as paludiculture, while contributing to climate adaptation by improving the resilience of water resources.

Pantanal faces multiple threats

The Pantanal would be a prime candidate for a flagship project. The vast seasonal floodplain stretching from Brazil into Paraguay and Bolivia, is home to abundant populations of cayman, capybaras, jaguars and more than 600 species of birds. It is vital also for preventing flooding on the River Paraguay for some 2000 kilometres downstream to the Atlantic Ocean.

The Pantanal faces multiple threats, from droughts due to upstream water diversions and climate change, invasions by farmers setting fires and a megaproject to dredge the river and create a shipping corridor through the wetland.

But EU investment to achieve partnership targets agreed with Brazil on restoration, conservation and sustainable management could reinvigorate traditional sustainable land use – including cattle ranching that helps sustain the Pantanal’s open flooded grasslands.

A delegation from the Pantanal Association for Organic and Sustainable Livestock Farming, pictured in the Pantanal wetland, Mato Grosso do Sul, Brazil. (Photo: Wetlands International Brazil office)

A delegation from the Pantanal Association for Organic and Sustainable Livestock Farming, pictured in the Pantanal wetland, Mato Grosso do Sul, Brazil. (Photo: Wetlands International Brazil office)

Accounting for wetlands carbon in national emissions targets

Africa, a main focus of the Global Gateway, has abundant potential for early partnership initiatives. They include the Inner Niger Delta in Mali, which sustains some three million inhabitants, but is threatened by upstream dams and conflicts over resources between farmers and herders.

Another is the Sango Bay-Minziro wetland, a region of swamp forests, flooded grasslands and papyrus swamp straddling the border between Uganda and Tanzania on the shores of Lake Victoria, Africa’s largest lake.

The two countries have agreed to cooperate in pushing back against illegal logging, papyrus extraction and farming, and Wetlands International has been working with local governments to encourage community-based initiatives. But an EU partnership could dramatically expand this work, helping sustain the wider ecology of Lake Victoria and the Nile Basin.

Deep in the Amazon, forest protection cash must vie with glitter of illegal gold

National pledges to bring wetlands to the fore of environmental action are proliferating rapidly, especially since the 2023 global climate stocktake at COP28 in the UAE emphasised the importance of accounting for wetlands carbon in national emissions targets.

Since then, more than 50 countries have signed up to the 2023 Freshwater Challenge to protect freshwater ecosystems; more than 40 governments with 40 percent of the world’s mangroves have endorsed the 2022 Mangrove Breakthrough that aims to protect and restore 15 million hectares by 2030; and the newly established Peatland Breakthrough aims at rewetting at least 30 million hectares and halting the loss of undrained peatland by 2030.

Such ambition will almost certainly be endorsed at the 2026 UN Water Conference to be hosted by the UAE and Senegal in December this year. But the key to turning targets into reality on the ground lies in finding the billions of Euros needed to deliver on the ambition. EU Wetlands Partnerships could help seal the deal.

The post The EU should partner with Global South to protect carbon-storing wetlands appeared first on Climate Home News.

The EU should partner with Global South to protect carbon-storing wetlands

Continue Reading

Climate Change

DeBriefed 30 January 2026:  Fire and ice; US formally exits Paris; Climate image faux pas

Published

on

Welcome to Carbon Brief’s DeBriefed.
An essential guide to the week’s key developments relating to climate change.

This week

Fire and ice

OZ HEAT: The ongoing heatwave in Australia reached record-high temperatures of almost 50C earlier this week, while authorities “urged caution as three forest fires burned out of control”, reported the Associated Press. Bloomberg said the Australian Open tennis tournament “rescheduled matches and activated extreme-heat protocols”. The Guardian reported that “the climate crisis has increased the frequency and severity of extreme weather events, including heatwaves and bushfires”.

WINTER STORM: Meanwhile, a severe winter storm swept across the south and east of the US and parts of Canada, causing “mass power outages and the cancellation of thousands of flights”, reported the Financial Times. More than 870,000 people across the country were without power and at least seven people died, according to BBC News.

COLD QUESTIONED: As the storm approached, climate-sceptic US president Donald Trump took to social media to ask facetiously: “Whatever happened to global warming???”, according to the Associated Press. There is currently significant debate among scientists about whether human-caused climate change is driving record cold extremes, as Carbon Brief has previously explained.

Around the world

  • US EXIT: The US has formally left the Paris Agreement for the second time, one year after Trump announced the intention to exit, according to the Guardian. The New York Times reported that the US is “the only country in the world to abandon the international commitment to slow global warming”.
  • WEAK PROPOSAL: Trump officials have delayed the repeal of the “endangerment finding” – a legal opinion that underpins federal climate rules in the US – due to “concerns the proposal is too weak to withstand a court challenge”, according to the Washington Post
  • DISCRIMINATION: A court in the Hague has ruled that the Dutch government “discriminated against people in one of its most vulnerable territories” by not helping them to adapt to climate change, reported the Guardian. The court ordered the Dutch government to set binding targets within 18 months to cut greenhouse gas emissions in line with the Paris Agreement, according to the Associated Press.
  • WIND PACT: 10 European countries have agreed a “landmark pact” to “accelerate the rollout of offshore windfarms in the 2030s and build a power grid in the North Sea”, according to the Guardian
  • TRADE DEAL: India and the EU have agreed on the “mother of all trade deals”, which will save up to €4bn in import duty, reported the Hindustan Times. Reuters quoted EU officials saying that the landmark trade deal “will not trigger any changes” to the bloc’s carbon border adjustment mechanism.
  • ‘TWO-TIER SYSTEM’: COP30 president André Corrêa do Lago believes that global cooperation should move to a “two-speed system, where new coalitions lead fast, practical action alongside the slower, consensus-based decision-making of the UN process”, according to a letter published on Tuesday, reported Climate Home News

$2.3tn

The amount invested in “green tech” globally in 2025, marking a new record high, according to Bloomberg.


Latest climate research

  • Including carbon emissions from permafrost thaw and fires reduces the remaining carbon budget for limiting warming to 1.5C by 25% | Communications Earth & Environment 
  • The global population exposed to extreme heat conditions is projected to nearly double if temperatures reach 2C | Nature Sustainability
  • Polar bears in Svalbard – the fastest-warming region on Earth – are in better condition than they were a generation ago, as melting sea ice makes seal pups easier to reach | Scientific Reports

(For more, see Carbon Brief’s in-depth daily summaries of the top climate news stories on Monday, Tuesday, Wednesday, Thursday and Friday.)

Captured

EV sales just overtook petrol cars in EU for the first time. Chart shows monthly new passenger card registrations in the EU.

Sales of electric vehicles (EVs) overtook standard petrol cars in the EU for the first time in December 2025, according to new figures released by the European Automobile Manufacturers’ Association (ACEA) and covered by Carbon Brief. Registrations of “pure” battery EVs reached 217,898 – up 51% year-on-year from December 2024. Meanwhile, sales of standard petrol cars in the bloc fell 19% year-on-year, from 267,834 in December 2024 to 216,492 in December 2025, according to the analysis.

Spotlight

Looking at climate visuals

Carbon Brief’s Ayesha Tandon recently chaired a panel discussion at the launch of a new book focused on the impact of images used by the media to depict climate change.

When asked to describe an image that represents climate change, many people think of polar bears on melting ice or devastating droughts.

But do these common images – often repeated in the media – risk making climate change feel like a far-away problem from people in the global north? And could they perpetuate harmful stereotypes?

These are some of the questions addressed in a new book by Prof Saffron O’Neill, who researches the visual communication of climate change at the University of Exeter.

The Visual Life of Climate Change” examines the impact of common images used to depict climate change – and how the use of different visuals might help to effect change.

At a launch event for her book in London, a panel of experts – moderated by Carbon Brief’s Ayesha Tandon – discussed some of the takeaways from the book and the “dos and don’ts” of climate imagery.

Power of an image

“This book is about what kind of work images are doing in the world, who has the power and whose voices are being marginalised,” O’Neill told the gathering of journalists and scientists assembled at the Frontline Club in central London for the launch event.

O’Neill opened by presenting a series of climate imagery case studies from her book. This included several examples of images that could be viewed as “disempowering”.

For example, to visualise climate change in small island nations, such as Tuvalu or Fiji, O’Neill said that photographers often “fly in” to capture images of “small children being vulnerable”. She lamented that this narrative “misses the stories about countries like Tuvalu that are really international leaders in climate policy”.

Similarly, images of power-plant smoke stacks, often used in online climate media articles, almost always omit the people that live alongside them, “breathing their pollution”, she said.

Ayesha Tandon with panellists at London’s Frontline Club. Credit: Carbon Brief

During the panel discussion that followed, panellist Dr James Painter – a research associate at the Reuters Institute for the Study of Journalism and senior teaching associate at the University of Oxford’s Environmental Change Institute – highlighted his work on heatwave imagery in the media.

Painter said that “the UK was egregious for its ‘fun in the sun’ imagery” during dangerous heatwaves.

He highlighted a series of images in the Daily Mail in July 2019 depicting people enjoying themselves on beaches or in fountains during an intense heatwave – even as the text of the piece spoke to the negative health impacts of the heatwave.

In contrast, he said his analysis of Indian media revealed “not one single image of ‘fun in the sun’”.

Meanwhile, climate journalist Katherine Dunn asked: “Are we still using and abusing the polar bear?”. O’Neill suggested that polar bear images “are distant in time and space to many people”, but can still be “super engaging” to others – for example, younger audiences.

Panellist Dr Rebecca Swift – senior vice president of creative at Getty images – identified AI-generated images as “the biggest threat that we, in this space, are all having to fight against now”. She expressed concern that we may need to “prove” that images are “actually real”.

However, she argued that AI will not “win” because, “in the end, authentic images, real stories and real people are what we react to”.

When asked if we expect too much from images, O’Neill argued “we can never pin down a social change to one image, but what we can say is that images both shape and reflect the societies that we live in”. She added:

“I don’t think we can ask photos to do the work that we need to do as a society, but they certainly both shape and show us where the future may lie.”

Watch, read, listen

UNSTOPPABLE WILDFIRES: “Funding cuts, conspiracy theories and ‘powder keg’ pine plantations” are making Patagonia’s wildfires “almost impossible to stop”, said the Guardian.

AUDIO SURVEY: Sverige Radio has published “the world’s, probably, longest audio survey” – a six-hour podcast featuring more than 200 people sharing their questions around climate change.

UNDERSTAND CBAM: European thinktank Bruegel released a podcast “all about” the EU’s carbon adjustment border mechanism, which came into force on 1 January.

Coming up

Pick of the jobs

DeBriefed is edited by Daisy Dunne. Please send any tips or feedback to debriefed@carbonbrief.org.

This is an online version of Carbon Brief’s weekly DeBriefed email newsletter. Subscribe for free here.

The post DeBriefed 30 January 2026:  Fire and ice; US formally exits Paris; Climate image faux pas appeared first on Carbon Brief.

DeBriefed 30 January 2026:  Fire and ice; US formally exits Paris; Climate image faux pas

Continue Reading

Climate Change

Factcheck: What it really costs to heat a home in the UK with a heat pump

Published

on

Electric heat pumps are set to play a key role in the UK’s climate strategy, as well as cutting the nation’s reliance on imported fossil fuels.

Heat pumps took centre-stage in the UK government’s recent “warm homes plan”, which said that they could also help cut household energy bills by “hundreds of pounds” a year.

Similarly, innovation agency Nesta estimates that typical households could cut their annual energy bills nearly £300 a year, by switching from a gas boiler to a heat pump.

Yet there has been widespread media coverage in the Times, Sunday Times, Daily Express, Daily Telegraph and elsewhere of a report claiming that heat pumps are “more expensive” to run.

The report is from the Green Britain Foundation set up by Dale Vince, owner of energy firm Ecotricity, who campaigns against heat pumps and invests in “green gas” as an alternative.

One expert tells Carbon Brief that Vince’s report is based on “flimsy data”, while another says that it “combines a series of worst-case assumptions to present an unduly pessimistic picture”.

This factcheck explains how heat pumps can cut bills, what the latest data shows about potential savings and how this information was left out of the report from Vince’s foundation.

How heat pumps can cut bills

Heat pumps use electricity to move heat – most commonly from outside air – to the inside of a building, in a process that is similar to the way that a fridge keeps its contents cold.

This means that they are highly efficient, adding three or four units of heat to the house for each unit of electricity used. In contrast, a gas boiler will always supply less than one unit of heat from each unit of gas that it burns, because some of the energy is lost during combustion.

This means that heat pumps can keep buildings warm while using three, four or even five times less energy than a gas boiler. This cuts fossil-fuel imports, reducing demand for gas by at least two-fifths, even in the unlikely scenario that all of the electricity they need is gas-fired.

Simon Evans on BlueSky (@drsimevans.carbonbrief.org): "Going slow on heat pumps could mean UK consumers having to pay an extra £3bn for imported gas 2026-2030, says Energy UK Says UK govt foot-dragging is "increasing costs for energy customers & hampering future system planning"

Since UK electricity supplies are now the cleanest they have ever been, heat pumps also cut the carbon emissions associated with staying warm by around 85%, relative to a gas boiler.

Heat pumps are, therefore, the “central” technology for cutting carbon emissions from buildings.

While heat pumps cost more to install than gas boilers, the UK government’s recent “warm homes plan” says that they can help cut energy bills by “hundreds of pounds” per year.

Similarly, Nesta published analysis showing that a typical home could cut its annual energy bill by £280, if it replaces a gas boiler with a heat pump, as shown in the figure below.

Nesta and the government plan say that significantly larger savings are possible if heat pumps are combined with other clean-energy technologies, such as solar and batteries.

Chart showing that clean electric tech could save households £1,000 a year, compared to gas boilers
Annual energy bill savings (£) for a typical household from April 2026, by using different clean-energy technologies in comparison with a gas boiler. Source: Nesta analysis, using data from Ofgem, the Centre for Net Zero and an Octopus Energy tariff.

Both the government and Nesta’s estimates of bill savings from switching to a heat pump rely on relatively conservative assumptions.

Specifically, the government assumes that a heat pump will deliver 2.8 units of heat for each unit of electricity, on average. This is known as the “seasonal coefficient of performance” (SCoP).

This figure is taken from the government-backed “electrification of heat” trial, which ran during 2020-2022 and showed that heat pumps are suitable for all building types in the UK.

(The Green Britain Foundation report and Vince’s quotes in related coverage repeat a number of heat pump myths, such as the idea that they do not perform well in older properties and require high levels of insulation.)

Nesta assumes a slightly higher SCoP of 3.0, says Madeleine Gabriel, the organisation’s director of sustainable future. (See below for more on what the latest data says about SCoP in recent installations.)

Both the government and Nesta assume that a home with a heat pump would disconnect from the gas grid, meaning that it would no longer need to pay the daily “standing charge” for gas. This currently amounts to a saving of around £130 per year.

Finally, they both consider the impact of a home with a heat pump using a “smart tariff”, where the price of electricity varies according to the time of day.

Such tariffs are now widely available from a variety of energy suppliers and many have been designed specifically for homes that have a heat pump.

Such tariffs significantly reduce the average price for a unit of electricity. Government survey data suggests that around half of heat-pump owners already use such tariffs.

This is important because on the standard rates under the price cap set by energy regulator Ofgem, each unit of electricity costs more than four times as much as a unit of gas.

The ratio between electricity and gas prices is a key determinant of the size and potential for running-cost savings with a heat pump. Countries with a lower electricity-to-gas price ratio consistently see much higher rates of heat-pump adoption.

(Decisions taken by the UK government in its 2025 budget mean that the electricity-to-gas ratio will fall from April, but current forecasts suggest it will remain above four-to-one.)

In contrast, Vince’s report assumes that gas boilers are 90% efficient, whereas data from real homes suggests 85% is more typical. It also assumes that homes with heat pumps remain on the gas grid, paying the standing charge, as well as using only a standard electricity tariff.

Prof Jan Rosenow, energy programme leader at the University of Oxford’s Environmental Change Institute, tells Carbon Brief that Vince’s report uses “worst-case assumptions”. He says:

“This report cherry-picks assumptions to reach a predetermined conclusion. Most notably, it assumes a gas boiler efficiency of 90%, which is significantly higher than real-world performance…Taken together, the analysis combines a series of worst-case assumptions to present an unduly pessimistic picture.”

Similarly, Gabriel tells Carbon Brief that Vince’s report is based on “flimsy data”. She explains:

“Dale Vince has drawn some very strong conclusions about heat pumps from quite flimsy data. Like Dale, we’d also like to see electricity prices come down relative to gas, but we estimate that, from April, even a moderately efficient heat pump on a standard tariff will be cheaper to run than a gas boiler. Paired with a time-of-use tariff, a heat pump could save £280 versus a boiler and adding solar panels and a battery could triple those savings.”

What the latest data shows about bill savings

The efficiency of heat-pump installations is another key factor in the potential bill savings they can deliver and, here, both the government and Vince’s report take a conservative approach.

They rely on the “electrification of heat” trial data to use an efficiency (SCoP) of 2.8 for heat pumps. However, Rosenow says that recent evidence shows that “substantially higher efficiencies are routinely available”, as shown in the figure below.

Detailed, real-time data on hundreds of heat pump systems around the UK is available via the website Heat Pump Monitor, where the average efficiency – a SCoP of 3.9 – is much higher.

Charts showing that recent heat-pump installations tend to be far more efficient
Number of installations by heat pump efficiency, in the electrification of heat trial (left) and on the website Heat Pump Monitor (right). An efficiency of three means that each unit of electricity delivers three units of heat, on average, across a year. Source: Heat Pump Monitor.

Homes with such efficient heat-pump installations would see even larger bill savings than suggested by the government and Nesta estimates.

Academic research suggests that there are simple and easy-to-implement reasons why these systems achieve much higher efficiency levels than in the electrification of heat trial.

Specifically, it shows that many of the systems in the trial have poor software settings, which means they do not operate as efficiently as their heat pump hardware is capable of doing.

The research suggests that heat pump installations in the UK have been getting more and more efficient over time, as engineers become increasingly familiar with the technology.

It indicates that recently installed heat pumps are 64% more efficient than those in early trials.

Jan Rosenow on BlueSky (@janrosenow.bsky.social): "Well-installed heat pumps installed in the UK today achieve on average a 64% higher efficiency than those during the early trials 15 years ago. It is testament to the brilliant installers and to the technology getting better. More in our recent paper"

Notably, the Green Britain Foundation report only refers to the trial data from the electrification of heat study carried out in 2020-22 and the even earlier “renewable heat premium package” (RHPP). This makes a huge difference to the estimated running costs of a heat pump.

Carbon Brief analysis suggests that a typical household could cut its annual energy bills by nearly £200 with a heat pump – even on a standard electricity tariff – if the system has a SCoP of 3.9.

The savings would be even larger on a smart heat-pump tariff.

In contrast, based on the oldest efficiency figures mentioned in the Green Britain Foundation report, a heat pump could increase annual household bills by as much as £200 on a standard tariff.

To support its conclusions, the report also includes the results of a survey of 1,001 heat pump owners, which, among other things, is at odds with government survey data. The report says “66% of respondents report that their homes are more expensive to heat than the previous system”.

There are several reasons to treat these findings with caution. The survey was carried out in July 2025 and some 45% of the heat pumps involved were installed between 2021-23.

This is a period during which energy prices surged as a result of Russia’s invasion of Ukraine and the resulting global energy crisis. Energy bills remain elevated as a result of high gas prices.

The wording of the survey question asks if homes are “more or less expensive to heat than with your previous system” – but makes no mention of these price rises.

The question does not ask homeowners if their bills are higher today, with a heat pump, than they would have been with the household’s previous heating system.

If respondents interpreted the question as asking whether their bills have gone up or down since their heat pump was installed, then their answers will be confounded by the rise in prices overall.

There are a number of other seemingly contradictory aspects of the survey that raise questions about its findings and the strong conclusions in the media coverage of the report.

For example, while only 15% of respondents say it is cheaper to heat their home with a heat pump, 49% say that one of the top three advantages of the system is saving money on energy bills.

In addition, 57% of respondents say they still have a boiler, even though 67% say they received government subsidies for their heat-pump installation. It is a requirement of the government’s boiler upgrade scheme (BUS) grants that homeowners completely remove their boiler.

The government’s own survey of BUS recipients finds that only 13% of respondents say their bills have gone up, whereas 37% say their bills have gone down, another 13% say they have stayed the same and 8% thought that it was too early to say.

The post Factcheck: What it really costs to heat a home in the UK with a heat pump appeared first on Carbon Brief.

Factcheck: What it really costs to heat a home in the UK with a heat pump

Continue Reading

Trending

Copyright © 2022 BreakingClimateChange.com