Connect with us

Published

on

Cities around the world are facing more frequent and intense bouts of extreme heat, leading to an increasing focus on the use of air conditioning to keep urban areas cool.

With the UK having experienced its hottest summer on record in 2025, for example, there was a wave of media attention on air conditioning use.

Yet less than 5% of UK homes have air conditioning and those most vulnerable – older adults, low-income households or people with pre-existing health conditions – often cannot afford to install or operate it.

While air conditioning may be appropriate in certain contexts, such as hospitals, community spaces or care homes, it is not the only solution.

Our research as part of the IMAGINE Adaptation project shows that a universal focus on technical solutions risks deepening inequality and has the potential to overlook social, economic and environmental realities.

Instead, to adapt to record temperatures, our research suggests a keener focus on community and equity is needed.

Contextualising urban heat vulnerability

In the UK, heatwaves are becoming more frequent and severe. Moreover, the evidence points to significant disparities in exposure and vulnerability. By 2080, average summer temperatures could rise by up to 6.7C, according to the Met Office.

During the summer of 2023, around 2,295 heat-related deaths occurred across the UK, with 240 in the South West region. Older adults, particularly those over 65, were the most affected, government figures show.

A recent UN Environment Programme report highlights that there is an “urgent” need for adaptation strategies to deal with rising summer heat.

However, our research shows that framing air conditioning as the default solution risks worsening urban heat by increasing emissions and energy bills, as well as missing the opportunity to design more inclusive, human-centred responses to rising temperatures.

Addressing both gradual and extreme heat involves understanding who is most affected, how people move through cities and the role of social networks.

In recognition of this, cities around the world are already developing potential cooling strategies that combine low-emission interventions with community-based care.

Expanding the concept of ‘cool spaces’

In the UK, Bristol City Council is working on a “cool space” initiative with support from the European Research Council-funded project IMAGINE Adaptation.

The initiative aims to identify a network of public spaces that can offer respite during periods of extreme heat. These spaces can potentially include parks, libraries, community centres or even urban farms.

The map below shows how heat vulnerability varies across the city of Bristol, identifying neighbourhoods most at risk from current and future heatwaves.

Overall heat vulnerability index (by ward), Bristol
Map of heat vulnerability in Bristol from the “Keep Bristol Cool” mapping tool. Source: Bristol City Council.

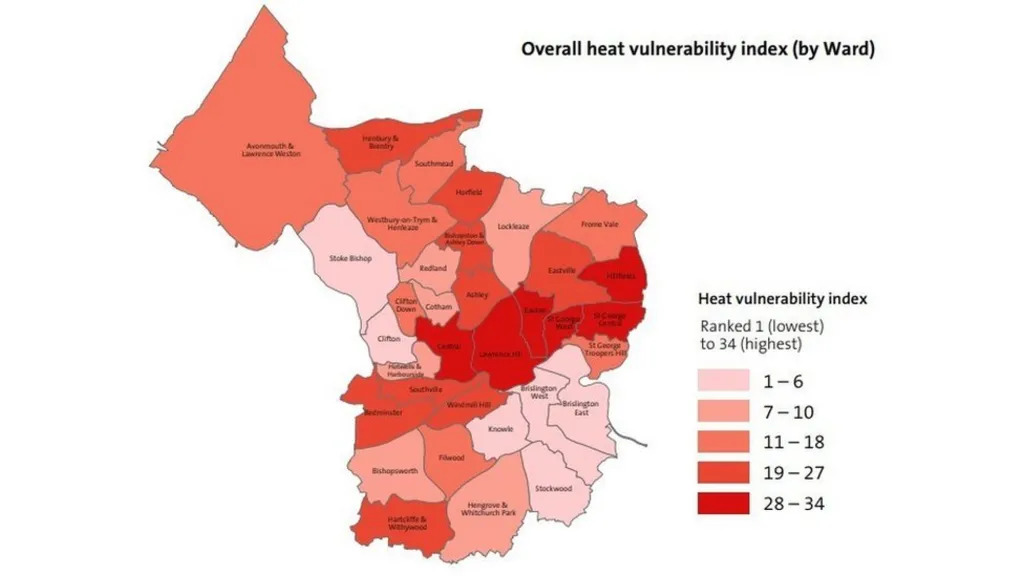
But what makes a space “cool”? We used surveys, interviews and workshops to collectively come to an understanding of what a cool space means for Bristol communities.

What emerged from our work is that “cool” is about far more than temperature.

Shade, natural ventilation, seating, access to water and toilets all contribute to comfort, but they do not capture the full picture.

Social and cultural factors, such as whether people feel welcome, whether spaces are free to use or whether children can safely reach them, are equally important. For example, we found that while many community spaces are open to the public, people are often unsure whether they can spend time there without having to buy something.

Our research shows that the presence of a café, even unintentionally, can signal that time and space come at a cost. Clear signage, free entry, drinking water and toilets can help people feel that they are welcome to stay.

Additionally, our research highlights that it is important to recognise that public space is not experienced equally by everyone. Some city centre parks, for instance, may be seen as unwelcoming by people who do not drink alcohol or who feel uncomfortable around noise and large groups.

Creating cool spaces that serve the whole community involves understanding these dynamics and exploring more inclusive alternatives.

Connecting adaptation efforts

The importance of understanding the dynamics of adaptation efforts is especially relevant when considering children, as they are often more vulnerable to increasing temperatures.

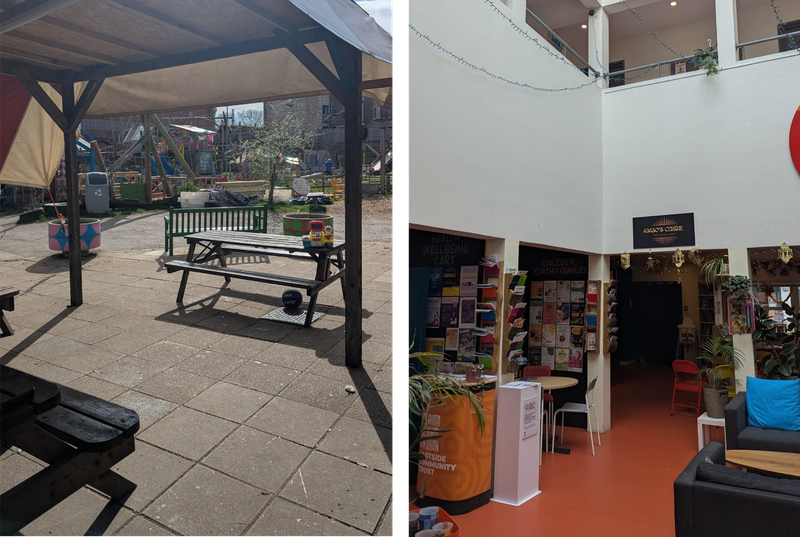
At Felix Road adventure playground – one of the early pilot sites in Bristol – staff introduced shaded areas, drinking water and ice lollies to support children during hot weather.

However, adaptation does not just happen at individual sites, but between them, as connectivity to the playground by foot or public transport exposes children to the heat and traffic.

This highlights that adaptation to heat is a city-wide concern, as the effectiveness of individual cooling interventions can depend on both the space itself and how it can be accessed and used by vulnerable populations.

Buses and trains can become uncomfortably hot, making travel difficult for those most at risk. Our research suggests that for some, staying home might seem safer, but many lack cooling options.

Early discussions in the cool space trial show this is especially true for older adults, who also seek social contact alongside thermal comfort in community centres. Advice to stay home during heatwaves, without adequate cooling or guidance, therefore risks both physical harm and increased social isolation.

Felix Road adventure playground (left) and Eastside Community Trust (right), both potential “cool spaces” participating in the trial. Source: IMAGINE adaptation. Photo by William Lewis.

Relational approaches to adaptation

Viewing cooling as a social issue transforms how we approach urban adaptation and, more importantly, climate action.

Air conditioning reduces temperature, but it does not help foster trust or strengthen community ties. Our research shows that a well-designed community space, by contrast, integrates physical comfort with social support.

For example, they offer places where a parent can supervise children safely in water play, where an older adult might be offered a cold drink or a fan, or where people can simply rest without judgment. These small interactions, while often overlooked, can contribute to reducing heat stress, dehydration or social isolation during heatwaves, creating public spaces that are safer and more supportive for heat-vulnerable residents.

Cool spaces can also serve multiple roles. A library may host children’s activities or provide food support, while a community centre might offer advice on home cooling.

These spaces show that strong community relationships are key to real climate action, offering comfort, connection and practical help all in one place.

Our research shows that by embedding care into design, cities can build approaches to adaptation that go beyond temperature control, recognising the diverse needs of their communities.

However, to continue serving this role effectively, community spaces require ongoing support, including adequate funding, staffing and resources. Without such support, their ability to provide safe, welcoming and inclusive cooling environments for the most vulnerable can be limited.

Challenges and trade-offs

Our research finds that imagining “cool” adaptation is not without challenges.

Our reflections from the ongoing work in Bristol highlight the importance of context-sensitive, adaptive strategies that consider how people live and their needs and expectations, without neglecting the urgent demands of climate action and health protection.

What works in one neighbourhood may be unsuitable in another – and success cannot be defined solely by temperature reduction or visitor numbers.

Listening to communities, observing patterns of use and being willing to reconsider early designs through experimentation and learning are arguably essential for interventions that are socially, culturally and environmentally appropriate.

Climate change is already reshaping how cities function and how communities think and behave. Heatwaves are no longer rare events; they are increasingly intense and dangerous.

In this context, air conditioning may have a role in specific settings and for specific reasons, but it is not the sole answer. Our research shows it cannot replace locally grounded, inclusive and relational approaches to adaptation.

Bristol’s “cool spaces” initiative demonstrates that interventions are most likely to be effective when they are accessible, welcoming and build community, providing more than just shade or technical relief.
This requires investment, coordination and time, but also a shift in perspective: cooling is not just a technical challenge, but about how we look after one another and how we collectively imagine our public spaces in a changing climate.

The post Guest post: Why cities need more than just air conditioning for extreme heat appeared first on Carbon Brief.

Guest post: Why cities need more than just air conditioning for extreme heat

Continue Reading

Climate Change

‘America needs you’: US seeks trade alliance to break China’s critical mineral dominance  

Published

on

The US is urging countries to form a critical mineral trading bloc to shore up access to resources that are pivotal to manufacturing energy, digital and advanced technologies and technologies, and to reduce the world’s dependence on China for mineral supplies.

Washington says this mineral club would provide countries with a tariff-free trade zone to buy and sell critical minerals with guaranteed minimum prices, helping them compete with Chinese producers and create more resilient supply chains.

China dominates global mineral refining capacity for 19 of 20 key minerals needed to manufacture clean energy technologies and advanced digital infrastructure.

“The Trump administration is proposing a concrete mechanism to return the global critical minerals market to a healthier, more competitive state,” US Vice President JD Vance told government representatives from 54 countries and the European Union attending the first US-hosted critical minerals ministerial meeting on Wednesday.

Large economies like India, Japan, France, Germany and the UK as well as resource-rich emerging and developing economies such as Argentina, the Democratic Republic of the Congo and Zambia were represented at the event in Washington DC.

“We want to eliminate th[e] problem of people flooding into our markets with cheap critical minerals to undercut our domestic manufacturers,” Vance said, without naming China.

“We want members to form a trading bloc among allies and partners, one that guarantees American access to American industrial might, while also expanding production across the entire zone. The benefits will be immediate and durable,” he added.

“In the end, it’s all in the US interest of course,” Bryan Bille, a principal at Benchmark Mineral Intelligence, told Climate Home News. “At the same time, the Trump Administration realises that international cooperation is needed to address these challenges.”

“America needs you”

“It feels like ‘thank you for coming, America needs your help’,” Patrick Schröder, a senior research fellow at Chatham House, said of the meeting.

“The US now have realised they cannot solve their critical minerals problem just on their own. To really reduce dependence on China, they need this bigger group of countries,” he said.

There is potential for a mineral trading club to become useful to diversify supply chains and support mineral production in developing countries “but it can’t be all about supplying the US with minerals,” Schröder told Climate Home News.

    On Wednesday, the US signed 11 bilateral critical minerals agreements with Argentina, the Cook Islands, Ecuador, Guinea, Morocco, Paraguay, Peru, the Philippines, the UAE and Uzbekistan. This comes on top of 10 other deals signed in the past five months, including with Australia, Japan, South Korea, Saudi Arabia and Thailand. The EU and the US have committed to conclude a deal within the next 30 days. The US government says the deals will form the basis for global collaboration.

    Secretary of the Interior Doug Burgum told a conference on Tuesday that “there is strong interest from another 20 countries” to sign similar deals.

    The US also announced the creation of the Forum on Resource Geostrategic Engagement (FORGE), which will succeed the Minerals Security Partnership and enable member countries to collaborate on mineral policy and projects. It will be chaired by South Korea until June.

    Prioritising cleantech

    US officials emphasised the growing need for minerals to power artificial intelligence, data centres and the digital economy but made no reference to the booming demand from cleantech industries manufacturing batteries, heat pumps, solar panels and wind turbines.

    For Schröder, Europe could play a role in shaping the initiative by prioritising cleantech industries.

    Any price-floor mechanism “should also be linked to ensuring that mining and processing is done to the highest possible environmental standards” and support efforts to improve supply chain traceability, he said.

      The Trump administration argues that setting a minimum price for minerals will help create a stable environment to attract long-term capital into new mining projects.

      But how this will work in practice remains unclear and complex. Prices vary for each mineral, each stage of the value chain and across different countries. “All of that needs to be discussed and agreed,” said Schröder, warning that a trading club could easily become “a cartel” and risk breaching World Trade Organisation rules.

      Chinese dependence

      The US’s attempt to broker new alliances to secure mineral supplies comes as Washington is seeking to fast-track mining permits at home and announced plans to stockpile minerals to help shield domestic manufacturers from cheaper Chinese competition.

      This is particularly acute when it comes to rare earths with China accounting for around 60% of mining output and more than 90% of global rare earths refining capacity.

      The Trump administration has doubled down on efforts to diversify its mineral supplies, especially for rare earths, after American manufacturers faced supply shortages last year when China expanded export restrictions amid trade tensions with Washington.

      Rare earths are pivotal to producing magnets that are used in wind turbines, electric vehicle motors as well as many other advanced technologies. Both countries reached a deal to lift the restrictions on supplies but some limits are still in place despite the truce.

      “We just can’t be in a position where our entire economy… is in a position to be held hostage by someone that could change the world economy through a form of export controls,” US Secretary of the Interior Burgum said on Tuesday.

        Yet, for many resource-rich countries, the US’s national security strategy poses the biggest risk to global supply chain stability, said Cory Combs, head of critical mineral research at advisory firm Trivium China.

        Ultimately, global efforts to diversify mineral value chain mean China will lose market share. “But it’s not going to lose its advantages,” he told Climate Home News.

        “Industry will still buy every Chinese material they can possibly get their hands on, because it’s cheaper, it’s better, it’s faster and more reliable when you don’t have the export controls,” he said.

        Project Vault

        To help shore up mineral reserves in the short-term, President Donald Trump announced the establishment of a US critical mineral reserve earlier this week.

        Project Vault will “ensure that American businesses and workers are never harmed by any shortage – we never want to go through what we went through a year ago,” he said.

        The US Export-Import Bank is providing up to $10 billion in loans – the largest deal in the bank’s history – to procure and store minerals in warehouses across the US for manufacturers to use in case of a supply shock.

        Dozens of companies have committed an additional $1.67bn in private capital to build up the reserve. EV battery manufacturer Clarios, GE Vernova, which produces wind turbines and grid electrification technologies, as well as carmakers Stellantis and General Motors and planemaker Boeing have said they would participate.

        Mineral analysts warn that stockpiling might be a short-term solution to securing minerals but in the case of rare earths it could in fact deepen reliance on Beijing if Chinese supplies remain the cheapest on the market and are therefore used to fill the vault.

        The post ‘America needs you’: US seeks trade alliance to break China’s critical mineral dominance   appeared first on Climate Home News.

        ‘America needs you’: US seeks trade alliance to break China’s critical mineral dominance  

        Continue Reading

        Climate Change

        Gas flaring soars in Niger Delta post-Shell, afflicting communities  

        Published

        on

        There are days when the sulphur-like, toxic smell coming from the nearby oil facilities is so potent that Azuh Chinenye struggles to go outside her house early in the morning. “When you inhale, you as a person, your body system, and every other thing will change… you can’t stand the odour,” she said.

        Chinenye lives in Oyigbo, a town less than 20 miles (32 km) from Port Harcourt, in the Niger Delta, the heart of Nigeria’s main oil-producing region.

        Signs of the industry are everywhere in Oyigbo. Active flare stacks stand just metres from homes and businesses, whose walls are caked in soot. Close to a primary school, Climate Home News saw oil spilling from a corroded underground pipe.

        The local oil field here was for many years owned and operated by Shell, until it was sold to a Nigerian firm for $533 million in early 2021. Since the sale, gas flaring has increased dramatically at Oyigbo, despite the new operator’s promise to “protect our planet” and the health of communities.

        A local doctor and residents told Climate Home News that the opposite is happening in reality, as people struggle with the effects of noxious pollutants released by flaring at production facilities close to their homes.

        Flaring worsens climate crisis

        Fifteen times more gas was burned at the Oyigbo field in 2024 compared to 2020, according to an analysis of satellite data prepared for Climate Home News by SkyTruth, an environmental watchdog. This pattern is repeated at other fields previously owned by Shell across the Niger Delta, the data shows.

        Flaring occurs when gas produced during oil drilling is burned off, instead of being utilised. The process releases vast amounts of carbon dioxide and methane, a potent planet-heating greenhouse gas, alongside toxic chemicals.

        Failure to tackle gas flaring pushes global climate goals further out of reach, as cutting methane emissions from the oil and gas industry is widely seen by climate and energy experts as a quick win to slow global warming in the short term.

        Shell claims to have significantly reduced its emissions and says it achieved zero routine flaring last year, but our analysis reveals that this was driven primarily by selling off high-emission assets – from the US to Nigeria – which are then free to continue polluting, albeit under different management.

        After Shell divestments, flaring on the rise

        A spokesperson for Shell told Climate Home News by email that, when the energy giant selects buyers for divestments, it assesses “a number of factors such as their financial strength, operating culture and environmental performance” and shares emissions reduction plans for the assets, where relevant.

        But Shell does not monitor the performance of those assets once it has handed over control to the buyer, the spokesperson said, adding that regulation of operations by the new owner is carried out by governments.

        After years of staying flat at the global level, flaring has risen again since 2023, including in Nigeria, where smaller home-grown firms have been ramping up production seeking to maximise oil revenues while lacking the expertise to prevent flaring, according to a World Bank report.

        To understand more about how this wasteful and dangerous process continues to harm people’s lives, Climate Home News went to the Niger Delta, a part of the world unique for how many residents are forced to live in close proximity to flare stacks.

        New owner promised sustainable production

        Rising gas flaring in Oyigbo is harming the wellbeing of the local community. Photo: Vivian Chime

        Chief Maduabuchi Felix Achiele at his home in Oyigbo. Photo: Vivian Chime

        Rising gas flaring in Oyigbo is harming the wellbeing of the local community. Photo: Vivian Chime

        Chief Maduabuchi Felix Achiele at his home in Oyigbo. Photo: Vivian Chime

        “Gas flaring has increased in the years since Shell left,” said Chief Maduabuchi Felix Achiele, a community leader in Oyigbo. “In a week, we can observe two, three, four instances of flaring but when Shell was here, it was just once in a while.”

        The field has been owned by Trans-Niger Oil and Gas (TNOG) since January 2021, along with the rest of the assets within the OML 17 oil block. The company that runs operations in the block – Lagos-based Heirs Energies – has boasted about turning an “underperforming asset” into an economic success after taking it over from Shell.

        Heirs Energies said it has doubled production at OML 17 without that coming at the expense of environmental and climate integrity. “We can create a symmetry, a symbiotic relationship between oil and gas, the environment and people […] sustainability is infused in what we are doing,” its CEO Osayande Igiehon said in an interview late last year.

          Heirs Energies announced an agreement with the Nigerian National Petroleum Corporation (NNPC) to capture and monetise gas from OML 17 in December, though the company did not give a timeframe for when this project would be completed. Heirs failed to respond to questions sent by Climate Home News for this story.

          On its website, the company says it is “committed to eliminating routine flaring and greenhouse gas emissions by 2025”. But the emissions figures and experience of the local community tell a radically different story.

          Jump in flaring volumes

          In OML 17, the vast oil block that covers much of the urban area of Port Harcourt and its surrounding towns like Oyigbo, gas flaring volumes grew sevenfold between 2020 – the last year of Shell’s involvement – and 2024, according to data presented to Climate Home News by SkyTruth.

          To conduct this analysis, we tracked sales of onshore Nigerian assets, determined the location of each site using open source data, and then worked with SkyTruth to monitor flaring from these locations using data from the Earth Observation Group at the Colorado School of Mines.

          Within OML 17, at Agbada, about a 30-minute drive north of Port Harcourt city centre, flaring doubled immediately after the sale in 2021. The following year, it almost doubled again and has remained close to that mark since. In Nkali, another asset within OML 17, flaring was nearly four times higher in the year after the sale.

          While SkyTruth’s analysis was only able to use figures up to 2024, flaring remained high at these oil blocks throughout 2025, according to publicly available data from the NNPC.

          This pattern can be seen in other oil blocks. Shell lost its right to operate OML 11 in August 2021, a block that spans the Ogoniland region. This helped the company to record a drop in emissions from both greenhouse gases and volatile organic compounds, while flaring went up under the block’s new operator, a subsidiary of the government-owned NNPC.

          “Catastrophic” for communities

          Communities in Ogoniland are seeking reparations for the decades-long environmental devastation caused by oil drilling. When it took control of the assets in 2021, the NNPC said the firm’s operations would be driven by “a social contract that would put the people and environment of the Niger Delta above pecuniary considerations”. Nonetheless, gas flaring tripled between 2021 and 2024 across all OML 11 fields, according to the analysis prepared by SkyTruth.

          It was a similar story at Nembe Creek, part of the OML 29 block sold by Shell to Nigerian firm Aiteo for $1.7bn in March 2015. That year, flaring rose by around a quarter and then doubled in 2016.

          For blighted Niger Delta communities, oil spill clean-ups are another broken promise

          Production at the facility fell dramatically following a huge oil spill in 2021 that dumped 20,000 barrels of oil per day into local creeks for a month. Gas flaring at Nembe Creek spiked again in 2024, to an annual volume 54% higher than in 2014, when Shell still ran the field. In June 2024, another spill forced Aiteo to halt production.

          Andrew Baxter, senior director for business and energy transition at the Environmental Defense Fund (EDF), told Climate Home News: “Flaring and spills harm human health. Flaring is not just a climate menace, it’s catastrophic to the communities that live around these facilities.”

          It also wastes energy, he said. “This is a depressing waste of resources when there are still significant challenges around energy access,” he added.

          Q&A: “False” climate solutions help keep fossil fuel firms in business

          Given the need to address climate change, it’s important that when majors sell fossil fuel assets, buyers have comparable green targets and operating standards, according to organisations like EDF.

          Baxter argued that the way Shell managed its troubled oil operations in the Niger Delta over decades had limited its options when selling them on.

          “When operators have a poor environmental record and substandard record of community engagement, it should come as little surprise when they cannot attract many interested buyers for those assets. This rule applies globally,” he said.

          Big Oil’s “paper decarbonisation”

          Between 2016 and 2023, more than 60% of Shell’s emissions reductions came from divestments. That matters because, despite these emissions no longer being Shell’s responsibility, they are still heating up the Earth’s climate.

          Krista Halttunen, a visiting researcher at Imperial College London who focuses on the future of the oil industry, told Climate Home News that companies like Shell are practising “paper decarbonisation”, reducing emissions in their annual reports rather than the real world.

          “This story shows the limits of company-driven emissions reduction,” she said. “Very few companies are reducing real-world emissions. Fossil fuel companies can’t meaningfully decarbonise without changing their business model, because their whole reason for being is digging up material that will add more carbon to the atmosphere.”

          Shell did not reply to Climate Home News’ questions about how it had achieved its emission reductions.

          It also appears that Shell’s achievement of reaching zero routine flaring in 2025 was achieved in large part through the sale of its Nigerian assets. In March of that year Shell sold its onshore Nigerian assets to a consortium of companies called Renaissance Africa. Earlier, in 2023, Shell had stated that its remaining Nigerian assets accounted for around half of total routine and non-routine flaring in its integrated gas and upstream facilities.

          Removing Nigerian assets from its portfolio, whether in the Renaissance deal or earlier transactions, may have helped transform Shell’s flaring emissions, but for people living in the Niger Delta life has stayed the same.

          Active flaring at an oil production facility in Oyigbo seen in January 2026. Photo: Vivian Chime

          An oil puddle near a community path in Oyigbo. The local chief said oil often spills from corroded underground pipelines. Photo: Vivian Chime

          Active flaring at an oil production facility in Oyigbo seen in January 2026. Photo: Vivian Chime

          An oil puddle near a community path in Oyigbo. The local chief said oil often spills from corroded underground pipelines. Photo: Vivian Chime

          “Flaring is not new in this community,” explained Theodore Ike Ogu, a 60-year-old smallholder farmer who lives in Oyigbo. “We are suffering and flaring is increasing.”

          Here, temperatures regularly hover around 35 degrees Celsius during the day, with humidity often exceeding 50%. When the flares are going full blast, the heat for those living and working nearby can be unbearable, locals said. At night, when the town is quiet, the noise from the flares keeps people awake.

          Chief Maduabuchi recalled that residents used to collect water during the rainy season to drink and wash. “You can’t even use it to wash because, as it comes down, it is dirty because of the smoke,” he complained.

          Health risks from toxic chemicals

          Gas flaring releases harmful chemicals, and numerous studies, including some conducted in the Niger Delta, have linked living close to flares with being more likely to contract forms of cancer and respiratory illnesses.

          Complaints from local communities about health issues and unexplained deaths have been rising in oil-producing communities such as Oyigbo as gas flaring intensifies, according to Dr Bieye Renner Briggs, a Port Harcourt-based public health physician and environmental advocate.

          While he cautions that a direct link has not yet been scientifically proven in the Niger Delta, Dr Briggs says the connection is “probable”, given similar findings in other oil regions worldwide. He recommended performing routine autopsies in the local communities to establish clear evidence of whether deaths are caused by gas flaring or oil pollution.

          In Oyigbo, flames can be seen rising from flare stacks located near homes and businesses. Source: Airbus / Google Earth – Image from 30/05/2025

          In Oyigbo, flames can be seen rising from flare stacks located near homes and businesses. Source: Airbus / Google Earth – Image from 30/05/2025

          Dr Briggs warned that people living near flare sites face a wide range of serious health hazards, from hypertension and cardiomyopathy, which can increase the risk of heart failure, to asthma, chronic bronchitis and kidney disease.

          Soot particles released by flaring represent a particularly acute health risk, he warned. These are small enough to bypass the body’s natural defences and enter the bloodstream, increasing the risk of cancers and other conditions, he told Climate Home News. “Everything a smoker will suffer and more is what somebody that is exposed to soot will suffer,” he said, noting that, unlike smokers, residents can do little to limit their constant exposure.

          The oil companies contacted by Climate Home News for this article, including Shell, did not respond to requests for comment on the health effects of flaring.

          “I have different health issues: incessant lung pains, at times a cough, all those things, catarrh,” said Theodore Ike Ogu, adding there are “so many things that we notice health-wise which we believe are due to flaring”.

          Azuh Chinenye’s husband, Kelechi Prince Azuh, died in May last year after suffering from breathing difficulties and frequent asthma attacks. “He was 49 years old,” she said, fighting back tears. “You see his poster outside there and three of the children are in university. He didn’t even see them complete their first year.”

          Azuh Chinenye said gas flaring has had a major impact on her life. Photo: Vivian Chime

          A poster commemorating Kelechi Prince Azuh who died last year after suffering from breathing difficulties. Photo: Vivian Chime

          Azuh Chinenye said gas flaring has had a major impact on her life. Photo: Vivian Chime

          A poster commemorating Kelechi Prince Azuh who died last year after suffering from breathing difficulties. Photo: Vivian Chime

          “Nowhere else to go”

          Oil production, meanwhile, has increased at former Shell fields. Extracting oil from mature fields like those in Nigeria produces a significant amount of associated gas and, in the absence of funding and infrastructure to make use of this, it is often flared.

          Last May, Heirs Energies CEO Igiehon told the Financial Times that Nigerian firms could build better relationships with locals, after years of tension with oil majors over frequent spills and the destruction of local livelihoods. “We’re able to move around unfettered because we have a robust relationship with the communities,” he argued.

          The increase in flaring in blocks like OML 17 has tested that idea.

          Colombia aims to launch fossil fuel transition platform at first global conference

          “Shell was great,” said Chief Maduabuchi, who explained that the company provided healthcare and food to the local community. The new operator, he says, “only gives us a small amount of rice, unlike Shell which used to give us each 50kg”.

          Asked why she has chosen to stay in Oyigbo after her husband’s death, Azuh Chinenye explains that it’s much cheaper to live here than in the centre of Port Harcourt. She uses her inhaler when she struggles to breathe and tries not to go outside when the soot gets bad.

          “I can easily pack up, but this is my compound, this is my community, and there is nowhere else I will go,” she said.

          Cover photo: A woman empties a plastic bowl filled with tapioca, which is derived from cassava paste, on sewn sacks laid on the ground close to a gas flaring furnace in Ughelli, Delta State, Nigeria September 17, 2020. (Photo: REUTERS/Afolabi Sotunde)

          The post Gas flaring soars in Niger Delta post-Shell, afflicting communities   appeared first on Climate Home News.

          Gas flaring soars in Niger Delta post-Shell, afflicting communities  

          Continue Reading

          Climate Change

          Analysis: Clean energy drove more than a third of China’s GDP growth in 2025

          Published

          on

          Solar power, electric vehicles (EVs) and other clean-energy technologies drove more than a third of the growth in China’s economy in 2025 – and more than 90% of the rise in investment.

          Clean-energy sectors contributed a record 15.4tn yuan ($2.1tn) in 2025, some 11.4% of China’s gross domestic product (GDP) – comparable to the economies of Brazil or Canada.

          The new analysis for Carbon Brief, based on official figures, industry data and analyst reports, shows that China’s clean-energy sectors nearly doubled in real value between 2022-25 and – if they were a country – would now be the 8th-largest economy in the world.

          Other key findings from the analysis include:

          • Without clean-energy sectors, China would have missed its target for GDP growth of “around 5%”, expanding by 3.5% in 2025 instead of the reported 5.0%.
          • Clean-energy industries are expanding much more quickly than China’s economy overall, with their annual growth rate accelerating from 12% in 2024 to 18% in 2025.
          • The “new three” of EVs, batteries and solar continue to dominate the economic contribution of clean energy in China, generating two-thirds of the value added and attracting more than half of all investment in the sectors.
          • China’s investments in clean energy reached 7.2tn yuan ($1.0tn) in 2025, roughly four times the still sizable $260bn put into fossil-fuel extraction and coal power.
          • Exports of clean-energy technologies grew rapidly in 2025, but China’s domestic market still far exceeds the export market in value for Chinese firms.

          These investments in clean-energy manufacturing represent a large bet on the energy transition in China and overseas, creating an incentive for the government and enterprises to keep the boom going.

          However, there is uncertainty about what will happen this year and beyond, particularly for solar power, where growth has slowed in response to a new pricing system and where central government targets have been set far below the recent rate of expansion.

          An ongoing slowdown could turn the sectors into a drag on GDP, while worsening industrial “overcapacity” and exacerbating trade tensions.

          Yet, even if central government targets in the next five-year plan are modest, those from local governments and state-owned enterprises could still drive significant growth in clean energy.

          This article updates analysis previously reported for 2023 and 2024.

          Clean-energy sectors outperform wider economy

          China’s clean-energy economy continues to grow far more quickly than the wider economy. This means that it is making an outsize contribution to annual economic growth.

          The figure below shows that clean-energy technologies drove more than a third of the growth in China’s economy overall in 2025 and more than 90% of the net rise in investment.

          Contributions to the growth in Chinese investment (left) and GDP overall (right) in 2025 by sector, trillion yuan.
          Contributions to the growth in Chinese investment (left) and GDP overall (right) in 2025 by sector, trillion yuan. Source: Centre for Research on Energy and Clean Air (CREA) analysis for Carbon Brief.

          In 2022, China’s clean-energy economy was worth an estimated 8.4tn yuan ($1.2tn). By 2025, the sectors had nearly doubled in value to 15.4tn yuan ($2.1tn).

          This is comparable to the entire output of Brazil or Canada and positions the Chinese clean-energy industry as the 8th-largest economy in the world. Its value is roughly half the size of the economy of India – the world’s fourth largest – or of the US state of California.

          The outperformance of the clean-energy sectors means that they are also claiming a rising share of China’s economy overall, as shown in the figure below.

          Share of China’s GDP contributed by clean-energy sectors, %.
          Share of China’s GDP contributed by clean-energy sectors, %. Source: CREA analysis for Carbon Brief.

          This share has risen from 7.3% of China’s GDP in 2022 to 11.4% in 2025.

          Without clean-energy sectors, China’s GDP would have expanded by 3.5% in 2025 instead of the reported 5.0%, missing the target of “around 5%” growth by a wide margin.

          Clean energy thus made a crucial contribution during a challenging year, when promoting economic growth was the foremost aim for policymakers.

          The table below includes a detailed breakdown by sector and activity.

          Sector Activity Value in 2025, CNY bln Value in 2025, USD bln Year-on-year growth Growth contribution Value contribution Value in 2025, CNY trn Value in 2024, CNY trn Value in 2023, CNY trn Value in 2022, CNY trn
          EVs Investment: manufacturing capacity 1,643 228 18% 10.4% 10.7% 1.6 1.4 1.2 0.9
          EVs Investment: charging infrastructure 192 27 58% 2.9% 1.2% 0.192 0.122 0.1 0.08
          EVs Production of vehicles 3,940 548 29% 36.4% 25.6% 3.94 3.065 2.26 1.65
          Batteries Investment: battery manufacturing 277 38 35% 3.0% 1.8% 0.277 0.205 0.32 0.15
          Batteries Exports: batteries 724 101 51% 10.1% 4.7% 0.724 0.48 0.46 0.34
          Solar power Investment: power generation capacity 1,182 164 15% 6.3% 7.7% 1.182 1.031 0.808 0.34
          Solar power Investment: manufacturing capacity 506 70 -23% -6.5% 3.3% 0.506 0.662 0.95 0.51
          Solar power Electricity generation 491 68 33% 5.1% 3.2% 0.491 0.369 0.26 0.19
          Solar power Exports of components 681 95 21% 4.9% 4.4% 0.681 0.562 0.5 0.35
          Wind power Investment: power generation capacity, onshore 612 85 47% 8.1% 4.0% 0.612 0.417 0.397 0.21
          Wind power Investment: power generation capacity, offshore 96 13 98% 2.0% 0.6% 0.096 0.048 0.086 0.06
          Wind power Electricity generation 510 71 13% 2.4% 3.3% 0.51 0.453 0.4 0.34
          Nuclear power Investment: power generation capacity 173 24 18% 1.1% 1.1% 0.17 0.15 0.09 0.07
          Nuclear power Electricity generation 216 30 8% 0.7% 1.4% 0.216 0.2 0.19 0.19
          Hydropower Investment: power generation capacity 54 7 -7% -0.2% 0.3% 0.05 0.06 0.06 0.06
          Hydropower Electricity generation 582 81 3% 0.6% 3.8% 0.582 0.567 0.51 0.51
          Rail transportation Investment 902 125 6% 2.1% 5.8% 0.902 0.851 0.764 0.714
          Rail transportation Transport of passengers and goods 1,020 142 3% 1.3% 6.6% 1.02 0.99 0.964 0.694
          Electricity transmission Investment: transmission capacity 644 90 6% 1.5% 4.2% 0.64 0.61 0.53 0.5
          Electricity transmission Transmission of clean power 52 7 14% 0.3% 0.3% 0.052 0.046 0.04 0.04
          Energy storage Investment: Pumped hydro 53 7 5% 0.1% 0.3% 0.05 0.05 0.04 0.03
          Energy storage Investment: Grid-connected batteries 232 32 52% 3.3% 1.5% 0.232 0.152 0.08 0.02
          Energy storage Investment: Electrolysers 11 2 29% 0.1% 0.1% 0.011 0.009 0 0
          Energy efficiency Revenue: Energy service companies 620 86 17% 3.8% 4.0% 0.62 0.528003 0.52 0.45
          Total Investments 7,198 1001 15% 38.2% 46.7% 7.20 6.28 6.00 4.11
          Total Production of goods and services 8,216 1,143 22% 61.8% 53.3% 8.22 6.73 5.58 4.32
          Total Total GDP contribution 15,414 2144 18% 100.0% 100.0% 15.41 13.01 11.58 8.42

          EVs and batteries were the largest drivers of GDP growth

          In 2024, EVs and solar had been the largest growth drivers. In 2025, it was EVs and batteries, which delivered 44% of the economic impact and more than half of the growth of the clean-energy industries. This was due to strong growth in both output and investment.

          The contribution to nominal GDP growth – unadjusted for inflation – was even larger, as EV prices held up year-on-year while the economy as a whole suffered from deflation. Investment in battery manufacturing rebounded after a fall in 2024.

          The major contribution of EVs and batteries is illustrated in the figure below, which shows both the overall size of the clean-energy economy and the sectors that added the most to the rise from year to year.

          Contribution of clean-energy sectors to China’s GDP and GDP growth, trillion yuan, 2022-2025.
          Contribution of clean-energy sectors to China’s GDP and GDP growth, trillion yuan, 2022-2025. Source: CREA analysis for Carbon Brief.

          The next largest subsector was clean-power generation, transmission and storage, which made up 40% of the contribution to GDP and 30% of the growth in 2025.

          Within the electricity sector, the largest drivers were growth in investment in wind and solar power generation capacity, along with growth in power output from solar and wind, followed by the exports of solar-power equipment and materials.

          Investment in solar-panel supply chains, a major growth driver in 2022-23, continued to fall for the second year. This was in line with the government’s efforts to rein in overcapacity and “irrational” price competition in the sector.

          Finally, rail transportation was responsible for 12% of the total economic output of the clean-energy sectors, but saw relatively muted growth year-on-year, with revenue up 3% and investment by 6%.

          Note that the International Energy Agency (IEA) world energy investment report projected that China invested $627bn in clean energy in 2025, against $257bn in fossil fuels.

          For the same sectors as the IEA report, this analysis puts the value of clean-energy investment in 2025 at a significantly more conservative $430bn. The higher figures in this analysis overall are therefore the result of wider sectoral coverage.

          Electric vehicles and batteries

          EVs and vehicle batteries were again the largest contributors to China’s clean-energy economy in 2025, making up an estimated 44% of value overall.

          Of this total, the largest share of both total value and growth came from the production of battery EVs and plug-in hybrids, which expanded 29% year-on-year. This was followed by investment into EV manufacturing, which grew 18%, after slower growth rates in 2024.

          Investment in battery manufacturing also rebounded after a drop in 2024, driven by new battery technology and strong demand from both domestic and international markets. Battery manufacturing investment grew by 35% year-on-year to 277bn yuan.

          The share of electric vehicles (EVs) will have reached 12% of all vehicles on the road by the end of 2025, up from 9% a year earlier and less than 2% just five years ago.

          The share of EVs in the sales of all new vehicles increased to 48%, from 41% in 2024, with passenger cars crossing the 50% threshold. In November, EV sales crossed the 60% mark in total sales and they continue to drive overall automotive sales growth, as shown below.

          Production of combustion-engine vehicles and EVs in China, million units. EVs include battery electric vehicles and plug-in hybrids.
          Production of combustion-engine vehicles and EVs in China, million units. EVs include battery electric vehicles and plug-in hybrids. Source: China Association of Automobile Manufacturers data via Wind Financial Terminal.

          Electric trucks experienced a breakthrough as their market share rose from 8% in the first nine months of 2024 to 23% in the same period in 2025.

          Policy support for EVs continues, for example, with a new policy aiming to nearly double charging infrastructure in the next three years.

          Exports grew even faster than the domestic market, but the vast majority of EVs continue to be sold domestically. In 2025, China produced 16.6m EVs, rising 29% year-on-year. While exports accounted for only 21% or 3.4m EVs, they grew by 86% year-on-year. Top export destinations for Chinese EVs were western Europe, the Middle East and Latin America.

          The value of batteries exported also grew rapidly by 41% year-on-year, becoming the third largest growth driver of the GDP. Battery exports largely went to western Europe, north America and south-east Asia.

          In contrast with deflationary trends in the price of many clean-energy technologies, average EV prices have held up in 2025, with a slight increase in average price of new models, after discounts. This also means that the contribution of the EV industry to nominal GDP growth was even more significant, given that overall producer prices across the economy fell by 2.6%. Battery prices continued to drop.

          Clean-power generation

          The solar power sector generated 19% of the total value of the clean-energy industries in 2025, adding 2.9tn yuan ($41bn) to the national economy.

          Within this, investment in new solar power plants, at 1.2tn yuan ($160bn), was the largest driver, followed by the value of solar technology exports and by the value of the power generated from solar. Investment in manufacturing continued to fall after the wave of capacity additions in 2023, reaching 0.5tn yuan ($72bn), down 23% year-on-year.

          In 2025, China achieved another new record of wind and solar capacity additions. The country installed a total of 315GW solar and 119GW wind capacity, adding more solar and two times as much wind as the rest of the world combined.

          Clean energy accounted for 90% of investment in power generation, with solar alone covering 50% of that. As a result, non-fossil power made up 42% of total power generation, up from 39% in 2024.

          However, a new pricing policy for new solar and wind projects and modest targets for capacity growth have created uncertainty about whether the boom will continue.

          Under the new policy, new clean-power generation has to compete on price against existing coal power in markets that place it at a disadvantage in some key ways.

          At the same time, the electricity markets themselves are still being introduced and developed, creating investment uncertainty.

          Investment in solar power generation increased year-on-year by 15%, but experienced a strong stop-and-go cycle. Developers rushed to finish projects ahead of the new pricing policy coming into force in June and then again towards the end of the year to finalise projects ahead of the end of the current 14th five-year plan.

          Investment in the solar sector as a whole was stable year-on-year, with the decline in manufacturing capacity investment balanced by continued growth in power generation capacity additions. This helped shore up the utilisation of manufacturing plants, in line with the government’s aim to reduce “disorderly” price competition.

          By late 2025, China’s solar manufacturing capacity reached an estimated 1,200GW per year, well ahead of the global capacity additions of around 650GW in 2025. Manufacturers can now produce far more solar panels than the global market can absorb, with fierce competition leading to historically low profitability.

          China’s policymakers have sought to address the issue since mid-2024, warning against “involution”, passing regulations and convening a sector-wide meeting to put pressure on the industry. This is starting to yield results, with losses narrowing in the third quarter of 2025.

          The volume of exports of solar panels and components reached a record high in 2025, growing 19% year-on-year. In particular, exports of cells and wafers increased rapidly by 94% and 52%, while panel exports grew only by 4%.

          This reflects the growing diversification of solar-supply chains in the face of tariffs and with more countries around the world building out solar panel manufacturing capacity. The nominal value of exports fell 8%, however, due to a fall in average prices and a shift to exporting upstream intermediate products instead of finished panels.

          Hydropower, wind and nuclear were responsible for 15% of the total value of the clean-energy sectors in 2025, adding some 2.2tn yuan ($310bn) to China’s GDP in 2025.

          Nearly two-thirds of this (1.3tn yuan, $180bn) came from the value of power generation from hydropower, wind and nuclear, with investment in new power generation projects contributing the rest.

          Power generation grew 33% from solar, 13% from wind, 3% from hydropower and 8% from nuclear.

          Within power generation investment, solar remained the largest segment by value – as shown in the figure below – but wind-power generation projects were the largest contributor to growth, overtaking solar for the first time since 2020.

          Value of new clean-power generation capacity, billion yuan, by year added.
          Value of new clean-power generation capacity, billion yuan, by year added. Source: CREA analysis for Carbon Brief.

          In particular, offshore wind power capacity investment rebounded as expected, doubling in 2025 after a sharp drop in 2024.

          Investment in nuclear projects continued to grow but remains smaller in total terms, at 17bn yuan. Investment in conventional hydropower continued to decline by 7%.

          Electricity storage and grids

          Electricity transmission and storage were responsible for 6% of the total value of the clean-energy sectors in 2025, accounting for 1.0 tn yuan ($140bn).

          The most valuable sub-segment was investment in power grids, growing 6% in 2025 and reaching $90bn. This was followed by investment in energy storage, including pumped hydropower, grid-connected battery storage and hydrogen production.

          Investment in grid-connected batteries saw the largest year-on-year growth, increasing by 50%, while investments in electrolysers also grew by 30%. The transmission of clean power increased an estimated 13%, due to rapid growth in clean-power generation.

          China’s total electricity storage capacity reached more than 213GW, with battery storage capacity crossing 145GW and pumped hydro storage at 69GW. Some 66GW of battery storage capacity was added in 2025, up 52% year-on-year and accounting for more than 40% of global capacity additions.

          Notably, capacity additions accelerated in the second half of the year, with 43GW added, compared with the first half, which saw 23GW of new capacity.

          The battery storage market initially slowed after the renewable power pricing policy, which banned storage mandates after May, but this was quickly replaced by a “market-driven boom”. Provincial electricity spot markets, time-of-day tariffs and increasing curtailment of solar power all improved the economics of adding storage.

          By the end of 2025, China’s top five solar manufacturers had all entered the battery storage market, making a shift in industry strategy.

          Investment in pumped hydropower continued to increase, with 15GW of new capacity permitted in the first half of 2025 alone and 3GW entering operation.

          Railways

          Rail transportation made up 12% of the GDP contribution of the clean-energy sectors, with revenue from passenger and goods rail transportation the largest source of value. Most growth came from investment in rail infrastructure, which increased 6% year-on-year

          The electrification of transport is not limited to EVs, as rail passenger, freight and investment volumes saw continued growth. The total length of China’s high-speed railway network reached 50,000km in 2025, making up more than 70% of the global high-speed total.

          Energy efficiency

          Investment in energy efficiency rebounded strongly in 2025. Measured by the aggregate turnover of large energy service companies (ESCOs), the market expanded by 17% year-on-year, returning to growth rates last seen during 2016-2020.

          Total industry turnover has also recovered to its previous peak in 2021, signalling a clear turnaround after three years of weakness.

          Industry projections now anticipate annual turnover reaching 1tn yuan in annual turnover by 2030, a target that had previously been expected to be met by 2025.

          China’s ESCO market has evolved into the world’s largest. Investment within China’s ESCO market remains heavily concentrated in the buildings sector, which accounts for around 50% of total activity. Industrial applications make up a further 21%, while energy supply, demand-side flexibility and energy storage together account for approximately 16%.

          Implications of China’s clean-energy bet

          Ongoing investment of hundreds of billions of dollars into clean-energy manufacturing represents a gigantic economic and financial bet on a continuing global energy transition.

          In addition to the domestic investment covered in this article, Chinese firms are making major investments in overseas manufacturing.

          The clean-energy industries have played a crucial role in meeting China’s economic targets during the five-year period ending this year, delivering an estimated 40%, 25% and 37% of all GDP growth in 2023, 2024 and 2025, respectively.

          However, the developments next year and beyond are unclear, particularly for solar power generation, with the new pricing system for renewable power generation leading to a short-term slowdown and creating major uncertainty, while central government targets have been set far below current rates of clean-electricity additions.

          Investment in solar-power generation and solar manufacturing declined in the second half of the year, while investment in generation clocked growth for the full year, showing the risk to the industries under the current power market set-ups that favour coal-fired power.

          The reduction in the prices of clean-energy technology has been so dramatic that when the prices for GDP statistics are updated, the sectors’ contribution to real GDP – adjusted for inflation or, in this case deflation – will be revised down.

          Nevertheless, the key economic role of the industry creates a strong motivation to keep the clean-energy boom going. A slowdown in the domestic market could also undermine efforts to stem overcapacity and inflame trade tensions by increasing pressure on exports to absorb supply.

          A recent CREA survey of experts working on climate and energy issues in China found that the majority believe that economic and geopolitical challenges will make the “dual carbon” goals – and with that, clean-energy industries – only more important.

          Local governments and state-owned enterprises will also influence the outlook for the sector. Their previous five-year plans played a key role in creating the gigantic wind and solar power “bases” that substantially exceeded the central government’s level of ambition.

          Provincial governments also have a lot of leeway in implementing the new electricity markets and contracting systems for renewable power generation. The new five-year plans, to be published this year, will therefore be of major importance.

          About the data

          Reported investment expenditure and sales revenue has been used where available. When this is not available, estimates are based on physical volumes – gigawatts of capacity installed, number of vehicles sold – and unit costs or prices.

          The contribution to real growth is tracked by adjusting for inflation using 2022-2023 prices.

          All calculations and data sources are given in a worksheet.

          Estimates include the contribution of clean-energy technologies to the demand for upstream inputs such as metals and chemicals.

          This approach shows the contribution of the clean-energy sectors to driving economic activity, also outside the sectors themselves, and is appropriate for estimating how much lower economic growth would have been without growth in these sectors.

          Double counting is avoided by only including non-overlapping points in value chains. For example, the value of EV production and investment in battery storage of electricity is included, but not the value of battery production for the domestic market, which is predominantly an input to these activities.

          Similarly, the value of solar panels produced for the domestic market is not included, as it makes up a part of the value of solar power generating capacity installed in China. However, the value of solar panel and battery exports is included.

          In 2025, there was a major divergence between two different measures of investment. The first, fixed asset investment, reportedly fell by 3.8%, the first drop in 35 years. In contrast, gross capital formation saw the slowest growth in that period but still inched up by 2%.

          This analysis uses gross capital formation as the measure of investment, as it is the data point used for GDP accounting. However, the analysis is unable to account for changes in inventories, so the estimate of clean-energy investment is for fixed asset investment in the sectors.

          The analysis does not explicitly account for the small and declining role of imports in producing clean-energy goods and services. This means that the results slightly overstate the contribution to GDP but understate the contribution to growth.

          For example, one of the most important import dependencies that China has is for advanced computing chips for EVs. The value of the chips in a typical EV is $1,000 and China’s import dependency for these chips is 90%, which suggests that imported chips represent less than 3% of the value of EV production.

          The estimates are likely to be conservative in some key respects. For example, Bloomberg New Energy Finance estimates “investment in the energy transition” in China in 2024 at $800bn. This estimate covers a nearly identical list of sectors to ours, but excludes manufacturing – the comparable number from our data is $600bn.

          China’s National Bureau of Statistics says that the total value generated by automobile production and sales in 2023 was 11tn yuan. The estimate in this analysis for the value of EV sales in 2023 is 2.3tn yuan, or 20% of the total value of the industry, when EVs already made up 31% of vehicle production and the average selling prices for EVs was slightly higher than for internal combustion engine vehicles.

          The post Analysis: Clean energy drove more than a third of China’s GDP growth in 2025 appeared first on Carbon Brief.

          Analysis: Clean energy drove more than a third of China’s GDP growth in 2025

          Continue Reading

          Trending

          Copyright © 2022 BreakingClimateChange.com