Disseminated on behalf of Surge Battery Metals Inc.
Electric vehicles (EVs), energy storage systems (BESS), and clean energy technologies depend heavily on lithium. Yet even with fast-rising demand, the United States still produces far less lithium than it needs.
In 2024, U.S. production reached only about 25,000 tonnes of lithium carbonate equivalent (LCE) – roughly 2% of global supply, which totaled around 1.2 million tonnes. That output is enough for only about 158,000 Tesla Model 3 battery packs per year.
The gap between national demand and domestic production keeps widening. Most lithium used in the U.S. comes from imports, mainly from Chile, Australia, and China. This dependency exposes the country to supply disruptions, trade restrictions, and price volatility. If imports are interrupted, the U.S. battery and EV industries could face serious setbacks.
Growing Demand Creates a Structural Deficit
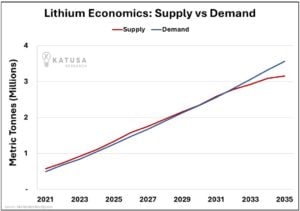
Global demand for lithium is growing quickly. Analysts expect it to quadruple by 2030 as more countries adopt EVs and build large-scale battery storage.
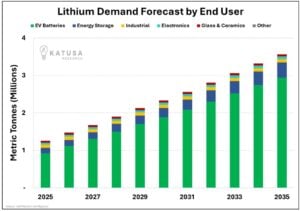
According to Katusa Research (2025), global lithium demand is projected to climb from 1.04 million tonnes in 2024 to 3.56 million tonnes by 2035 — a 3.5× increase. About 83% of that demand will come from EV batteries, while energy storage will account for another 11%.
Source: Katusa Research
Per the International Energy Agency, the U.S. alone may need over 625,000 tonnes of LCE per year by 2030, compared with only a small fraction produced domestically today.
Building new mines takes time – often 10 to 15 years from exploration to commercial production. This long timeline makes it difficult to ramp up supply fast enough to meet demand. Therefore, a lasting shortage is forming. If the U.S. does not accelerate new projects soon, it may depend on imports for decades.
Each EV battery pack uses large amounts of lithium. On average, an EV requires about 60 kilograms of LCE – or 8 to 10 kilograms per kilowatt-hour (kWh) of battery capacity. As automakers build more gigafactories, that adds up quickly.
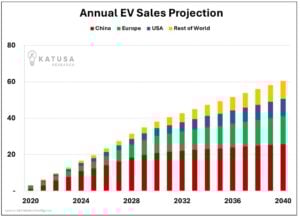
Katusa’s data also shows that global EV sales jumped from 2 million in 2020 to 11 million in 2024, a 450% surge — and could exceed 60 million units per year by 2040, more than half of all cars sold globally.
Source: Katusa Research
The U.S. is expected to have 440 gigawatt-hours (GWh) of battery manufacturing capacity by 2025 and more than 1,000 GWh by 2030. That growth alone could double or triple national lithium demand.
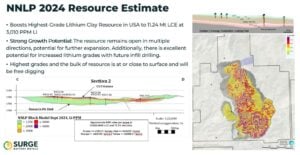
Introducing the Nevada North Lithium Project
One company aiming to help close this gap is Surge Battery Metals. Its flagship asset, the Nevada North Lithium Project (NNLP) in Elko County, Nevada, is one of the few high-grade lithium clay deposits in the United States.
The project has an inferred resource of 11.24 million tonnes of LCE, grading about 3,010 ppm lithium, making it the highest-grade lithium clay resource in the country.
The project benefits from ideal logistics. NNLP is only 13 kilometers from major power lines and close to all-season roads. The Bureau of Land Management (BLM) has issued a Record of Decision and a Finding of No Significant Impact (FONSI), allowing expanded exploration over 250 acres. These factors make NNLP a leading U.S. candidate for large-scale lithium development.
How NNLP Helps Close the Supply Gap
Surge Battery Metals’ Nevada North project has features that position it well to help close America’s lithium gap. Its high grade and large resource size suggest it could deliver significant output once in production. Higher-grade deposits typically allow lower extraction costs and shorter payback periods.
Because NNLP already has key permits and environmental clearance, it may reach production faster than many early-stage peers. That speed is critical as EV demand accelerates and the U.S. targets more domestic battery manufacturing.
Just as important, NNLP supports U.S. policy goals for supply chain security. Producing lithium domestically reduces reliance on imports, helping stabilize supply and pricing for American automakers. It also supports the Inflation Reduction Act, which requires that most EV battery minerals come from North America or allied countries by 2027.
In March 2025, the U.S. government took direct equity stakes in several lithium ventures, including Lithium Americas’ Thacker Pass, signaling a strong federal commitment to reshoring critical mineral production. This policy backdrop reinforces projects like NNLP as part of a national security priority.
Strengthening NNLP Through Strategic Partnership
Moreover, Surge Battery Metals signed a joint venture letter of intent (LOI) with Evolution Mining (ASX: EVN), allowing Evolution to earn up to 32.5% ownership by funding C$10 million toward the Preliminary Feasibility Study (PFS) for the Nevada North Lithium Project (NNLP). Surge retains majority control and project management, keeping its long-term vision and stakeholder priorities front and center.
This partnership delivers big strategic value. By merging Surge’s lithium expertise and mineral rights with Evolution’s 75% stake in 880 acres of private land – and over 21,000 added acres nearby – the deal significantly increases the JV’s land position. The expanded acreage boosts the overall exploration area and brings in mineral rights in key southern zones, possible clay unit extensions to the north, and territory in historic mining districts and key drainage areas.
Importantly, Evolution’s staged funding speeds up completion of the PFS and helps NNLP reach development milestones while lowering capital risk for Surge shareholders. If Evolution completes its full commitment, it will own 32.5% of the JV, but Surge remains the lead partner. This setup means Surge still directs the project, while using Evolution’s operations know-how and resources. With a larger land package and a joint operating committee, NNLP is well on its way to Tier 1 status and is strengthening its spot in North America’s battery metals supply chain – vital for clean energy and EV growth.
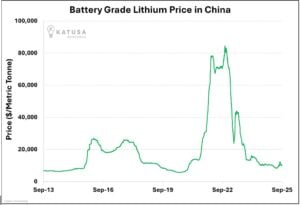
Like any mining venture, NNLP faces challenges. Lithium prices fell nearly 90% from their 2022 peak, but from June to September 2025, they rebounded 24%, showing early signs of recovery.
This cyclical pattern reflects Katusa’s “cost floor” concept — production costs in China and Australia now average around $5,000–6,000 per tonne LCE, while South American and U.S. projects need about $8,000/t to stay profitable. If prices fall near those levels, high-cost mines pause output, tightening supply again and stabilizing prices.
Another factor is resource expansion. NNLP’s current resource is inferred, but the company expects to complete its current drilling program at NNLP by the end of October 2025. Once the results are released, the lithium resource will be upgraded from Inferred to Indicated and Measured categories. This step will strengthen confidence in the deposit’s scale and quality, supporting the upcoming Pre-Feasibility Study (PFS).
Permitting and community engagement also remain important; even in a mining-friendly state like Nevada, water use and land reclamation practices must meet strict environmental standards.
Surge Battery Metals has emphasized sustainable practices, including water recycling and progressive site reclamation, as part of its exploration and development plan.
Competition is growing, too. Lithium projects across South America, Australia, and Canada are advancing quickly. Still, Nevada’s combination of stable governance, established mining laws, and proximity to major battery plants gives U.S. projects like NNLP a strong advantage.
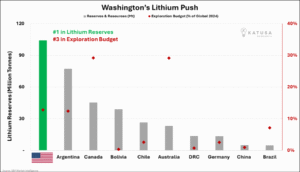
A National View: U.S. Lithium Resources and Reserves
The U.S. is home to some of the world’s largest lithium reserves, but it still underdevelops them. According to the U.S. Geological Survey, global lithium reserves total around 21 million tonnes, with the U.S. holding roughly 12%. Nevada alone hosts the country’s biggest lithium resources, concentrated in the Thacker Pass region and the northern claystone belts – where NNLP is located.
Unlocking these resources is vital. Every new project that moves forward strengthens the domestic supply chain and supports national goals to lead in clean energy technology.
Surge Battery Metals plans to continue advancing NNLP through new drilling campaigns and metallurgical studies in 2025. These programs aim to expand and upgrade resources, optimize extraction processes, and confirm the potential to produce battery-grade lithium carbonate with 99.9% purity. The company is also evaluating potential offtake partnerships with battery and automotive manufacturers.
Analysts and investors will be watching for:
Updated resource estimates and grade expansion
Progress toward pre-feasibility studies
Partnerships or funding deals with strategic investors
Regulatory updates supporting U.S. critical mineral development
Positive results in these areas could accelerate NNLP’s move toward construction and help it become one of the first next-generation lithium clay projects to enter U.S. production.
Powering the U.S. Energy Future
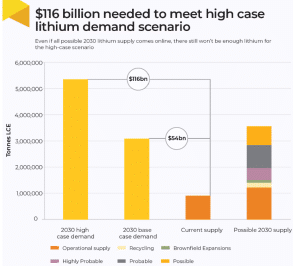
The U.S. faces a widening gap between lithium supply and demand that could slow its clean-energy transition. Katusa Research projects a 400,000-tonne global supply shortfall by 2035, roughly the world’s entire 2020 output – a deficit that could keep prices elevated long term.
Source: Katusa Research
Surge Battery Metals’ Nevada North Lithium Project provides a realistic and timely opportunity to help close that divide. With its high-grade resource, strong economics, strategic location, and environmental focus, NNLP could play a central role in building a stable, self-sufficient lithium supply for the United States.
As the nation races to electrify transportation and decarbonize energy, projects like NNLP will be critical. They are not only about producing lithium – they are about powering the next chapter of American industry and ensuring that the clean-energy future is built on secure, sustainable ground.
New Era Publishing Inc. and/or CarbonCredits.com (“We” or “Us”) are not securities dealers or brokers, investment advisers, or financial advisers, and you should not rely on the information herein as investment advice. Surge Battery Metals Inc. (“Company”) made a one-time payment of $50,000 to provide marketing services for a term of two months. None of the owners, members, directors, or employees of New Era Publishing Inc. and/or CarbonCredits.com currently hold, or have any beneficial ownership in, any shares, stocks, or options of the companies mentioned.
This article is informational only and is solely for use by prospective investors in determining whether to seek additional information. It does not constitute an offer to sell or a solicitation of an offer to buy any securities. Examples that we provide of share price increases pertaining to a particular issuer from one referenced date to another represent arbitrarily chosen time periods and are no indication whatsoever of future stock prices for that issuer and are of no predictive value.
Our stock profiles are intended to highlight certain companies for your further investigation; they are not stock recommendations or an offer or sale of the referenced securities. The securities issued by the companies we profile should be considered high-risk; if you do invest despite these warnings, you may lose your entire investment. Please do your own research before investing, including reviewing the companies’ SEDAR+ and SEC filings, press releases, and risk disclosures.
It is our policy that information contained in this profile was provided by the company, extracted from SEDAR+ and SEC filings, company websites, and other publicly available sources. We believe the sources and information are accurate and reliable but we cannot guarantee them.
CAUTIONARY STATEMENT AND FORWARD-LOOKING INFORMATION
Certain statements contained in this news release may constitute “forward-looking information” within the meaning of applicable securities laws. Forward-looking information generally can be identified by words such as “anticipate,” “expect,” “estimate,” “forecast,” “plan,” and similar expressions suggesting future outcomes or events. Forward-looking information is based on current expectations of management; however, it is subject to known and unknown risks, uncertainties, and other factors that may cause actual results to differ materially from those anticipated.
These factors include, without limitation, statements relating to the Company’s exploration and development plans, the potential of its mineral projects, financing activities, regulatory approvals, market conditions, and future objectives. Forward-looking information involves numerous risks and uncertainties and actual results might differ materially from results suggested in any forward-looking information. These risks and uncertainties include, among other things, market volatility, the state of financial markets for the Company’s securities, fluctuations in commodity prices, operational challenges, and changes in business plans.
Forward-looking information is based on several key expectations and assumptions, including, without limitation, that the Company will continue with its stated business objectives and will be able to raise additional capital as required. Although management of the Company has attempted to identify important factors that could cause actual results to differ materially, there may be other factors that cause results not to be as anticipated, estimated, or intended.
There can be no assurance that such forward-looking information will prove to be accurate, as actual results and future events could differ materially. Accordingly, readers should not place undue reliance on forward-looking information. Additional information about risks and uncertainties is contained in the Company’s management’s discussion and analysis and annual information form for the year ended December 31, 2024, copies of which are available on SEDAR+ at www.sedarplus.ca.
The forward-looking information contained herein is expressly qualified in its entirety by this cautionary statement. Forward-looking information reflects management’s current beliefs and is based on information currently available to the Company. The forward-looking information is made as of the date of this news release, and the Company assumes no obligation to update or revise such information to reflect new events or circumstances except as may be required by applicable law.
For more information on the Company, investors should review the Company’s continuous disclosure filings available on SEDAR+ at www.sedarplus.ca.
Disclosure: Owners, members, directors, and employees of carboncredits.com have/may have stock or option positions in any of the companies mentioned: None.
Carboncredits.com receives compensation for this publication and has a business relationship with any company whose stock(s) is/are mentioned in this article.
Additional disclosure: This communication serves the sole purpose of adding value to the research process and is for information only. Please do your own due diligence. Every investment in securities mentioned in publications of carboncredits.com involves risks that could lead to a total loss of the invested capital.
On 11 June 2026, the Science Based Targets initiative (SBTi) published the most substantial revision of its flagship corporate framework since its introduction. The SBTi Corporate Net-Zero Standard Version 2.0 takes effect on 1 February 2027 and reshapes the way companies approach their net-zero targets.
In a kitchen in rural Kenya, a mother kneels beside a three-stone fire to cook the day’s ugali (a starchy staple food). The flames are open, the smoke is thick, and her youngest child sits close by, breathing it in. This scene plays out in millions of homes every morning, and it is also where a measurable carbon credit can begin.
Since the Industrial Revolution, human activities have left a significant and growing mark on the natural world. Pollution, carbon emissions, and altered land use have degraded ecosystems, contaminated water supplies, and pushed global temperatures to record highs. These are not distant consequences. They affect the air people breathe, the food they eat, and the stability of the climate every community depends on.
Understanding the environmental effects of industry is the first step toward meaningful change. When we grasp the full picture of how industrial practices damage the planet, we can make better decisions at every level, from individual choices to corporate policy to government regulation.
This guide covers the origins of industrial pollution, its specific environmental impacts, which industries carry the heaviest footprint, and the solutions that are already making a difference. We also highlight companies leading by example and explain how businesses of all sizes can take action today.
How Did the Industrial Revolution Cause Environmental Pollution?
The Industrial Revolution began in England in the 18th century before spreading through Europe and across the world. Nations shifted from agrarian economies to industrial ones, and fossil fuels were burned on a massive scale to power that transition. The environmental deterioration that followed has been compounding ever since.
Land use changed dramatically alongside industrial growth. As factories and urban centers expanded, farmland shrank and agriculture itself became industrialized. Industrial farming introduced fossil-fuel-powered machinery, synthetic fertilizers, pesticides, and concentrated livestock operations. The result was soil deterioration, widespread air and water pollution, and a significant rise in greenhouse gas emissions from the agricultural sector alone.
Deforestation and urbanization compounded the damage by eliminating natural carbon sinks. Forests and wetlands that once absorbed carbon dioxide from the atmosphere were cleared for development, removing the land’s natural ability to absorb carbon and leaving more greenhouse gases concentrated in the air.
The numbers tell the story clearly. Atmospheric CO2 was consistently around 280 parts per million before industrialization began. According to the IEA, CO2 concentrations reached approximately 427 parts per million in 2025, more than 50% above pre-industrial levels, with total energy-related emissions hitting a record high of nearly 38.4 billion tonnes. That figure has risen every decade since the Industrial Revolution began.
Industrialization continues today in developing nations, many of which lack the financial infrastructure to adopt clean energy and rely instead on coal, oil, and petroleum to power their growing economies. Even many developed nations remain heavily dependent on polluting industries, continuing to add to global greenhouse gas concentrations.
What Are the Environmental Impacts of Industry?
Industrial pollution creates environmental damage at every scale, from local waterways to the global atmosphere. The consequences affect ecosystems, human health, and the long-term stability of the climate. Below are the three primary categories of environmental impact driven by industry.
Pollution
Industry causes pollution across water, air, and soil, the three foundations of life on Earth. Each type of pollution carries its own chain of consequences.
Water pollution occurs in both freshwater systems and oceans. Water used in industrial processes becomes contaminated when it contacts metals, chemicals, or radioactive waste, and that water is often discharged into rivers and waterways. The result is contaminated drinking water, damaged aquatic ecosystems, and crops irrigated with polluted water that can become harmful to consume. Globally, 80% of wastewater is still released untreated into the environment.
Air pollution is any physical, biological, or chemical change to the atmosphere that reduces air quality. Gas, smoke, and fine particulate matter from burning coal or natural gas cause respiratory and cardiovascular disease in humans and threaten ecosystems globally. Air pollution now contributes to approximately 7.9 million premature deaths per year worldwide, making it one of the leading environmental causes of mortality. Airborne contaminants also cause acid rain, which ruins crops and acidifies freshwater bodies.
Soil pollution occurs when chemical levels in the ground exceed safe thresholds and present a threat to human health or ecosystems. Soil becomes polluted through industrial waste, chemical pesticides and fertilizers, oil spills, and landfills. Heavy metal contamination from industrial waste currently affects an estimated 20% of global agricultural land. Contaminated soil reduces crop yields, harms wildlife, and can lead to serious health problems in humans and animals living in affected areas.
Ecological Consequences
Pollution and altered land use place severe strain on ecosystems in ways that ripple outward for generations. Three interconnected effects stand out.
Habitat destruction results from deforestation, urban expansion, and industrial development. When natural habitats are destroyed or fragmented, plants and animals lose the environments they need to survive. Species are pushed into shrinking territories, forcing greater competition for resources and raising extinction risks. According to current data, 33% of global soils are degraded due to pollution and erosion, compressing the productive land available to both agriculture and wildlife.
Slower environmental recovery is another consequence of the cumulative strain on ecosystems. Natural disasters like wildfires and hurricanes are growing more frequent and severe as the climate shifts, and ecosystems already weakened by pollution and habitat loss take longer to recover from each new event. Industrial accidents, such as oil spills or chemical leaks, add further damage that can persist in an environment for decades.
Biodiversity loss continues to accelerate as species go extinct at rates far above natural baselines. The combination of habitat destruction, pollution, climate change, and resource depletion creates overlapping pressures that many species cannot adapt to quickly enough.
Atmospheric Changes
Industrial practices release large quantities of greenhouse gases into the atmosphere, driving global warming and climate change. These two phenomena are distinct but deeply linked.
Global warming occurs when greenhouse gases like CO2 and methane accumulate in the atmosphere and trap heat that would otherwise radiate into space. Burning fossil fuels is the primary driver of CO2 buildup. Agricultural practices and landfills release significant quantities of methane, a greenhouse gas with more than 80 times the short-term warming power of CO2.
Climate change is the broader set of consequences that follows from global warming. Rising temperatures shift rainfall patterns, intensify storms, accelerate glacial melting, raise sea levels, and make agricultural conditions less predictable. Every fraction of a degree of additional warming increases these risks. The remaining carbon budget for limiting warming to 1.5 degrees Celsius is now projected to be exhausted by 2029 at current emission rates.
What Industries Have the Largest Environmental Impact?
Some industries carry a disproportionately large environmental footprint. Researchers evaluate environmental impact across six key components: greenhouse gas emissions, water use, waste generation, land and water pollutants, air pollutants, and natural resource use. The industries that dominate these categories are as follows.
Energy and electric utilities are the most polluting sector on Earth, generating approximately 15.83 billion tonnes of greenhouse gas emissions annually. The energy sector ranks highest in four of the six environmental impact categories: greenhouse gas emissions, waste, air pollutants, and natural resource use. As long as coal and natural gas remain central to electricity generation, this sector will continue to lead all others in environmental damage.
Transport is the second most polluting industry globally, responsible for around 8.43 billion tonnes of greenhouse gas emissions each year. Road transport accounts for the majority of that figure, while aviation and shipping contribute significantly. The sector is under growing pressure to electrify and adopt cleaner fuels.
Manufacturing and construction generate approximately 6.3 billion tonnes of emissions annually and consume vast quantities of raw materials including metals, sand, and timber. This sector appears across all six environmental impact categories, reflecting its broad footprint across pollution, resource use, and land disruption.
Food production ranks as the highest non-utility industry in water use and land and water pollutants. Industrial agriculture is responsible for the majority of freshwater withdrawals globally and is a leading driver of deforestation, soil degradation, and chemical runoff into waterways.
How Can the Environmental Impact of Industry Be Reduced?
Meaningful solutions to industrial pollution already exist. The challenge is implementing them at speed and scale. Below are the most impactful approaches available to businesses and industries today.
Better Waste Management
Improperly handled industrial waste is one of the most direct and preventable causes of environmental pollution. When waste is not treated and disposed of correctly, it contaminates waterways, soil, and groundwater. Industries that invest in proper waste treatment and disposal systems can eliminate a significant portion of their local environmental impact. This is also an area where regulation has historically produced measurable results.
Improved Recycling and Water Reuse
Unnecessary pollution occurs when recyclable materials and reusable water are instead discarded. Industrial water recycling, for example, keeps contaminated water within closed systems rather than releasing it into rivers and oceans. Expanding recycling programs across manufacturing sectors reduces both raw material extraction and waste generation, addressing two environmental problems at once.
Greenhouse Gas Mitigation and Carbon Offsetting
Reducing greenhouse gas emissions from industrial processes is the single most important lever for slowing climate change. Switching to renewable or clean energy cuts emissions at the source. Gas capture programs reduce methane and other potent greenhouse gases that would otherwise escape from operations like landfills and agricultural sites. For emissions that cannot yet be eliminated, verified carbon offset programs allow businesses to fund reforestation, methane capture, and renewable energy projects that compensate for their remaining footprint. Understanding the social cost of carbon helps businesses make the case internally for these investments.
Smarter Land Use
Industrial site selection and land management have lasting ecological consequences. Businesses should choose locations that minimize habitat disruption and avoid high-risk areas where accidents like fires or spills could cause catastrophic environmental damage. Reducing resource extraction on sensitive lands and funding environmental restoration projects, including reforestation and wetland rehabilitation, helps offset the land-use impact of ongoing operations. Carbon removal credits are one mechanism businesses can use to support these restoration efforts directly.
Advancing Technology
Older industrial technologies are often energy-inefficient and generate disproportionately high levels of pollution. Upgrading to newer equipment and processes allows industries to reduce emissions and resource consumption simultaneously. Switching to renewable energy, adopting AI-driven energy management, and investing in cleaner production technologies are all practical steps that industries can take now. The companies seeing the most progress are those that have embedded sustainability goals into their technology roadmaps rather than treating them as separate initiatives.
Environmental Awareness and Impact Assessment
Education and measurement underpin all other solutions. Industries that conduct regular environmental impact assessments, track their resource consumption and emissions, and train employees on sustainability practices are better positioned to identify problems early and respond effectively. Measuring and managing your carbon footprint is as essential for businesses as financial reporting, and increasingly, regulators and investors are requiring exactly that.
What Companies Are Reducing Their Environmental Impact?
Several major companies have made substantial commitments to reducing their environmental footprint and serve as benchmarks for the rest of the corporate world. Their progress, and in some cases their setbacks, offer useful lessons for any business navigating the transition to more sustainable operations.
Microsoft has been carbon neutral since 2012 and has set more ambitious targets since then. The company’s 2025 Environmental Sustainability Report outlines its goals to become carbon negative, water positive, and zero waste by 2030. Microsoft charges an internal carbon fee to business units and reinvests those funds into carbon reduction and removal initiatives. The company achieved its goal to protect more land than it uses by 2025 and has invested in renewable energy across 16 countries, including its first large-scale nuclear energy agreement.
Intel aims to be net positive on water use and achieve 100% renewable energy for its global operations by 2030. Intel links a percentage of employee compensation to corporate sustainability metrics, recognizing that achieving environmental goals requires company-wide participation rather than top-down mandates alone.
Alphabet (Google) has made significant progress on data center efficiency, reducing data center energy emissions by 12% in 2024 despite a 27% increase in overall electricity consumption, driven largely by AI workloads. Google’s data centers now provide six times more computing capacity per unit of electricity compared to five years ago. In 2024, Google signed agreements for more than 8 gigawatts of clean energy, the highest annual volume in the company’s history. The company has also pioneered AI-driven cooling systems for its data centers that dramatically reduce energy waste. It is worth noting that all three of these companies face the growing challenge of rising energy demand from AI infrastructure, a reminder that sustainability commitments require continuous adaptation as business models evolve.
Changing the Environmental Impact of Industry
More than two centuries of large-scale industrial activity have given us a clear view of the consequences. Pollution, ecological damage, and atmospheric change are not side effects we can manage around. They are the defining environmental challenge of our time, and the window for meaningful action is narrowing.
The good news is that solutions are no longer theoretical. Renewable energy is now cost-competitive with fossil fuels in most markets. Carbon capture and offset programs are funding real-world emissions reductions. Companies across every sector are finding that sustainable practices often improve efficiency and reduce long-term costs alongside their environmental benefits.
Whether you run a business or simply want to understand your own role in this picture, the path forward starts with knowing where you stand. Visit Terrapass to learn how you can measure your carbon footprint, reduce your emissions, and support verified projects that make a difference.