
The United States’ push to lead in green hydrogen, once a centerpiece of its clean energy strategy, is slowing down. Recent policy changes by the Trump administration cut funding for hydrogen hubs. They also reduced tax credits for large-scale projects. Analysts say this slowdown could open the door for China to dominate the emerging market for low-carbon hydrogen technology.
The cuts mark a major shift from the previous administration’s investment-heavy approach. Under the Biden-era Inflation Reduction Act (IRA), the U.S. planned to spend billions to make hydrogen from renewable electricity. The goal was to decarbonize industries such as steel, cement, and chemicals, which are hard to electrify.
Now, with federal incentives being reduced or delayed, several projects are being reassessed. Developers worry that without consistent support, production costs will remain too high to compete globally.
Funding Cuts Stall the Hydrogen Hub Dream
In mid-2025, the U.S. Department of Energy began reviewing funding for several regional hydrogen hubs. These hubs were meant to create networks linking producers, users, and transport systems. Seven hubs were approved in 2023, backed by more than $7 billion in federal funding, but four are now facing cuts or slowdowns.
Industry groups warn that this could affect projects worth tens of billions of dollars. “Policy certainty is crucial for investors,” said one energy analyst cited in the Bloomberg report. “Every delay or rollback increases the cost of capital and slows deployment.”
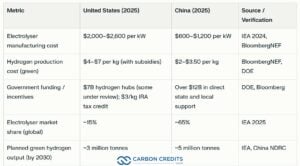
The U.S. also faces uncertainty about the Section 45V hydrogen tax credit. This credit offers up to $3 per kilogram for hydrogen produced with near-zero emissions. The credit helped close the gap between costly green hydrogen and cheaper fossil-based hydrogen. Without it, the cost of producing green hydrogen in the U.S. could rise from $3 to $5 per kilogram to over $7, according to BloombergNEF estimates.
China Powers Ahead in the Hydrogen Race
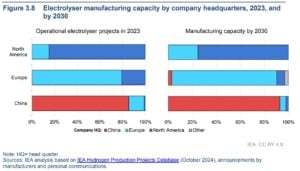
While U.S. funding stalls, China is moving fast. The country already leads the world in electrolyzer manufacturing — the core technology used to make hydrogen from water. In 2024, Chinese companies supplied more than 65% of global electrolyzer capacity, up from just 40% in 2022.
China’s domestic market is also growing. The government has set a goal to produce 200,000 tonnes of green hydrogen per year by 2025 and up to 5 million tonnes by 2030. To support this, provinces such as Inner Mongolia and Hebei have started big solar-powered hydrogen plants.
China’s advantage lies in scale and cost. Electrolyser units made in China cost $600–$1,200 per kilowatt, far lower than the $2,000–$2,600 range typical in the U.S. and Europe. If current trends continue, the price difference might make Chinese-made equipment the top choice for global projects.
Rising Costs and Shrinking Margins
Hydrogen production costs remain the biggest obstacle to global growth. The International Energy Agency (IEA) estimates that low-carbon hydrogen made with renewables costs two to four times more than conventional hydrogen from natural gas.
Producing one kilogram of green hydrogen costs between $4 and $12. This varies based on electricity prices and how efficient the electrolyzer is. Grey hydrogen, made from natural gas, costs $1–3 per kilogram. Analysts say costs must fall below $2 per kilogram to compete in most industries.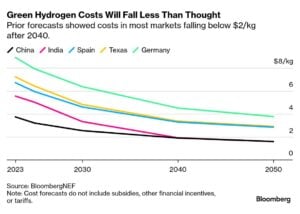
Scaling up manufacturing and securing cheap renewable power are key. The IEA projects that with large-scale deployment, electrolyzer costs could fall by 60% by 2030. But this requires steady investment and policy support — something the U.S. may now struggle to sustain.
According to BloombergNEF, global investment in hydrogen production and infrastructure reached $24 billion in 2024, up 50% from 2023. China accounted for nearly half of that total, while U.S. spending slowed after federal policy reviews.
Companies Pivot Amid Uncertainty
Despite the funding cuts, some U.S. companies are pressing ahead. Plug Power, a leading hydrogen firm, recently secured a $1.7 billion loan guarantee to expand production. The company plans to build several U.S. facilities that will supply green hydrogen to logistics and industrial customers.
Meanwhile, developers are adjusting strategies to reduce costs. Some plan to co-locate hydrogen plants near wind or solar farms to secure cheap power. Others are exploring blending hydrogen with natural gas in pipelines to reduce emissions without full conversion.
Industry leaders also call for cooperation with allies. The European Union, for example, continues to fund green hydrogen projects through its Hydrogen Bank initiative. They argue that closer cooperation across the Atlantic could help Western producers compete with China’s growing supply chain.
The Global Hydrogen Race
The race for leadership in green hydrogen is as much about geopolitics as it is about technology. Countries view hydrogen as a way to cut oil imports, boost industry, and ensure energy independence.
In 2024, global hydrogen demand reached about 97 million tonnes, according to the IEA. Only a small share — less than 1% — came from low-carbon production. To meet the world’s climate targets, that share must grow to at least 20% by 2030.
BloombergNEF expects the global hydrogen market to surpass $500 billion each year by 2050. This includes production, storage, and transport. But success depends on which countries can bring down costs first and scale up faster.
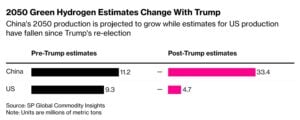
If the U.S. loses momentum now, analysts warn, it may have to rely on imported technology later — particularly from China. The following table compares the costs, market share, and 2030 planned output between the two nations.
Can America Catch Up?
Green hydrogen is central to decarbonizing heavy industry and transport. It also supports renewable integration by storing excess power from wind and solar. Without continued investment, the U.S. risks missing key climate targets.
According to the Department of Energy’s earlier projections, hydrogen could cut up to 10% of U.S. greenhouse gas emissions by 2050 if widely adopted. That potential could shrink if projects slow or shift overseas.
At the same time, China’s expansion means more global supply, which could help reduce costs worldwide. Some analysts see this as an opportunity for global cooperation — if the U.S. can focus on innovation, efficiency, and regulation rather than pure scale.
The chart from Bloomberg below shows the potential changes under Trump’s current policy moves.
Experts say the U.S. can still recover its position with the right mix of policy and private investment. Restoring tax credits, simplifying permits, and investing in electrolyzer manufacturing can help create a fairer market.
For now, China appears to have the upper hand. Its rapid manufacturing growth and strong state support have created momentum that the U.S. may struggle to match. However, as clean energy technologies mature, global demand will likely outstrip any single country’s supply.
The coming years will decide whether the U.S. remains a key player or becomes a buyer in the green hydrogen market it once hoped to lead.
- FURTHER READING: Element Resources to Build America’s Largest $1.85B Green Hydrogen Plant in California
The post U.S. Green Hydrogen Cuts Give China an Edge in the Clean Energy Race appeared first on Carbon Credits.
Every business carbon footprint report ends with a number, the amount of carbon emissions produced by the business, less the amount of carbon reduced and offset, given in tonnes of CO₂. Many of the people who sign off on that number, including those who paid for it, cannot picture what it represents on the ground. A tonne is a unit of mass. CO₂ is invisible. The link between the amount offset in the report and a real piece of restored forest somewhere in the world is almost never indicated.
![]()
Americans are paying more for insurance, electricity, taxes, and home repairs every year. What many people may not realize is that climate change is already one of the drivers behind those rising costs.
For many households, climate change is no longer just an environmental issue. It is becoming a cost-of-living issue. While climate impacts like melting glaciers and shrinking polar ice can feel distant from everyday life, the financial effects are already showing up in monthly budgets across the country.
Today, a larger share of household income is consumed by fixed costs such as housing, insurance, utilities, and healthcare. (3) Climate change and climate inaction are adding pressure to many of those expenses through higher disaster recovery costs, rising energy demand, infrastructure repairs, and increased insurance risk.
The goal of this article is to help connect climate change to the everyday financial realities people already experience. Regardless of where someone stands on climate policy, it is important to recognize that climate change is already increasing costs for households, businesses, and taxpayers across the United States.
More conservative estimates indicate that the average household has experienced an increase of about $400 per year from observed climate change, while less conservative estimates suggest an increase of $900.(1) Those in more disaster-prone regions of the country face disproportionate costs, with some households experiencing climate-related costs averaging $1,300 per year.(1) Another study found that climate adaptation costs driven by climate change have already consumed over 3% of personal income in the U.S. since 2015.(9) By the end of the century, housing units could spend an additional $5,600 on adaptation costs.(1)
Whether we realize it or not, Americans are already paying for climate change through higher insurance premiums, energy costs, taxes, and infrastructure repairs. These growing expenses are often referred to as climate adaptation costs.
Without meaningful climate action, these costs are expected to continue rising. Choosing not to invest in climate action is also choosing to spend more on climate adaptation.
Here are a few ways climate change is already increasing the cost of living:
- Higher insurance costs from more frequent and severe storms
- Higher energy use during longer and hotter summers
- Higher electricity rates tied to storm recovery and grid upgrades
- Higher government spending and taxpayer-funded disaster recovery costs
The real debate is not whether climate change costs money. Americans are already paying for it. The question is where we want those costs to go. Should we invest more in climate action to help reduce future climate adaptation costs, or continue paying growing recovery and adaptation expenses in everyday life?
How Climate Change Is Increasing Insurance Costs
There is one industry that closely tracks the financial impact of natural disasters: insurance. Insurance companies are focused on assessing risk, estimating damages, and collecting enough revenue to cover losses and remain financially stable.
Comparing the 20-year periods 1980–1999 and 2000–2019, climate-related disasters increased 83% globally from 3,656 events to 6,681 events. The average time between billion-dollar disasters dropped from 82 days during the 1980s to 16 days during the last 10 years, and in 2025 the average time between disasters fell to just 10 days. (6)
According to the reinsurance firm Munich Re, total economic losses from natural disasters in 2024 exceeded $320 billion globally, nearly 40% higher than the decade-long annual average. Average annual inflation-adjusted costs more than quadrupled from $22.6 billion per year in the 1980s to $102 billion per year in the 2010s. Costs increased further to an average of $153.2 billion annually during 2020–2024, representing another 50% increase over the 2010s. (6)
In the United States, billion-dollar weather and climate disasters have also increased significantly. The average number of billion-dollar disasters per year has grown from roughly three annually during the 1980s to 19 annually over the last decade. In 2023 and 2024, the U.S. recorded 28 and 27 billion-dollar disasters respectively, both setting new records. (6)
The growing impact of climate change is one reason insurance costs continue to rise. “There are two things that drive insurance loss costs, which is the frequency of events and how much they cost,” said Robert Passmore, assistant vice president of personal lines at the Property Casualty Insurers Association of America. “So, as these events become more frequent, that’s definitely going to have an impact.” (8)
After adjusting for inflation, insurance costs have steadily increased over time. From 2000 to 2020, insurance costs consistently grew faster than the Consumer Price Index due to rising rebuilding costs and weather-related losses.(3) Between 2020 and 2023 alone, the average home insurance premium increased from $75 to $360 due to climate change impacts, with disaster-prone regions experiencing especially steep increases.(1) Since 2015, homeowners in some regions affected by more extreme weather have seen home insurance costs increased by nearly 57%.(1) Some insurers have also limited or stopped offering coverage in high-risk areas.(7)
For many families, rising insurance costs are no longer occasional financial burdens. They are becoming recurring monthly expenses tied directly to growing climate risk.
How Rising Temperatures Increase Household Energy Costs

The financial impacts of climate change extend beyond insurance. Rising temperatures are also changing how much energy Americans use and how utilities plan for future electricity demand.
Between 1950 and 2010, per capita electricity use increased 10-fold, though usage has flattened or slightly declined since 2012 due to more efficient appliances and LED lighting. (3) A significant share of increased energy demand comes from cooling needs associated with higher temperatures.
Over the last 20 years, the United States has experienced increasing Cooling Degree Days (CDD) and decreasing Heating Degree Days (HDD). Nearly all counties have become warmer over the past three decades, with some areas experiencing several hundred additional cooling degree days, equivalent to roughly one additional degree of warmth on most days. (1) This trend reflects a warming climate where air conditioning demand is increasing while heating demand generally declines. (4)
As temperatures continue rising, households are expected to spend more on cooling than they save on heating. The U.S. Energy Information Administration (EIA) projects that by 2050, national Heating Degree Days will be 11% lower while Cooling Degree Days will be 28% higher than 2021 levels. Cooling demand is projected to rise 2.5 times faster than heating demand declines. (5)
These projections come from energy and infrastructure experts planning for future electricity demand and grid capacity needs. Utilities and grid operators are already preparing for higher peak summer electricity loads caused by rising temperatures. (5)
Longer and hotter summers also affect how homes and buildings are designed. Buildings constructed for past climate conditions may require upgrades such as larger air conditioning systems, stronger insulation, and improved ventilation to remain comfortable and energy efficient in the future. (10)
For many households, this means higher monthly utility bills and potentially higher long-term home improvement costs as temperatures continue to rise.
How Climate Change Affects Electricity Rates
On an inflation-adjusted basis, average U.S. residential electricity rates are slightly lower today than they were 50 years ago. (2) However, climate-related damage to utility infrastructure is creating new upward pressure on electricity costs.
Electric utilities rely heavily on above-ground poles, wires, transformers, and substations that can be damaged by hurricanes, storms, floods, and wildfires. Repairing and upgrading this infrastructure often requires substantial investment.
As a result, utilities are increasing electricity rates in response to wildfire and hurricane events to fund infrastructure repairs and future mitigation efforts. (1) The average cumulative increase in per-household electricity expenditures due to climate-related price changes is approximately $30. (1)
While this increase may appear modest today, utility costs are expected to rise further as climate-related infrastructure damage becomes more frequent and severe.
How Climate Disasters Increase Government Spending and Taxes
Extreme weather events also damage public infrastructure, including roads, schools, bridges, airports, water systems, and emergency services infrastructure. Recovery and rebuilding costs are often funded through taxpayer dollars at the federal, state, and local levels.
The average annual government cost tied to climate-related disaster recovery is estimated at nearly $142 per household. (1) States that frequently experience hurricanes, wildfires, tornadoes, or flooding can face even higher public recovery costs.
These expenses affect taxpayers whether they personally experience a disaster or not. Climate-related recovery spending can increase pressure on public budgets, emergency management systems, and infrastructure funding nationwide.
Reducing Climate Costs Through Climate Action
While this article focuses on the growing financial costs associated with climate change, the issue is not only about money for many people. It is also about recognizing our environmental impact and taking responsibility for reducing it in order to help preserve a healthy planet for future generations.
While individuals alone cannot solve climate change, collective action can help reduce future climate adaptation costs over time.
For those interested in taking action, there are three important steps:
- Estimate your carbon footprint to better understand the emissions connected to your lifestyle and activities.
- Create a plan to gradually reduce emissions through energy efficiency, cleaner technologies, and more sustainable choices.
- Address remaining emissions by supporting verified carbon reduction projects through carbon credits.
Carbon credits are one of the most cost-effective tools available for climate action because they help fund projects that generate verified emission reductions at scale. Supporting global emission reduction efforts can help reduce the long-term impacts and costs associated with climate change.
Visit Terrapass to learn more about carbon footprints, carbon credits, and climate action solutions.
The post How Climate Change Is Raising the Cost of Living appeared first on Terrapass.


-
Climate Change10 months ago
Guest post: Why China is still building new coal – and when it might stop
-
Greenhouse Gases10 months ago
Guest post: Why China is still building new coal – and when it might stop
-

 Greenhouse Gases2 years ago
嘉宾来稿:满足中国增长的用电需求 光伏加储能“比新建煤电更实惠”
-

 Climate Change2 years ago
嘉宾来稿:满足中国增长的用电需求 光伏加储能“比新建煤电更实惠”
-
Climate Change2 years ago
Bill Discounting Climate Change in Florida’s Energy Policy Awaits DeSantis’ Approval
-

 Renewable Energy7 months ago
Sending Progressive Philanthropist George Soros to Prison?
-

 Carbon Footprint2 years ago
US SEC’s Climate Disclosure Rules Spur Renewed Interest in Carbon Credits
-
Greenhouse Gases11 months ago
嘉宾来稿:探究火山喷发如何影响气候预测