

Nike released its earnings for the period ending August 31, 2025. The report showed stronger results than expected, giving investors insight into both its business recovery and its ongoing environmental commitments.
The sportswear company is making financial gains while focusing on its long-term goal: reaching net zero emissions. It aims to cut greenhouse gases (GHG) as part of this effort. Let’s look at Nike’s latest earnings, its climate goals, and its most recent progress on emissions.
Profits Under Pressure, but Revenue Holds Strong
Nike reported revenue of $11.72 billion in its fiscal first quarter of 2025. This represented a small increase of about 1% from the previous year and was stronger than analysts had expected.
Net income for the quarter was $727 million, down roughly 31% compared with the same period last year. While profit margins declined, mainly due to tariffs, higher discounts, and shifts in sales channels, the company still beat Wall Street forecasts.
Gross margin fell to just over 42%, showing that Nike continues to face cost pressures across its operations. Still, the earnings results reflected resilience in consumer demand and Nike’s ability to manage challenges in the global retail market.
After the earnings release, Nike’s stock responded positively. Shares rose 1.5%, reflecting investor confidence in the company’s results. The stronger-than-expected revenue, improved profit margins, and lower inventories reassured markets about Nike’s recovery strategy.

This performance marked one of Nike’s best single-day jumps in 2025, showing how financial momentum and clear progress on operations can quickly influence investor sentiment.
Nike’s “Move to Zero” Playbook
Nike’s sustainability strategy is known as “Move to Zero”, which represents its long-term vision of achieving both net-zero carbon emissions and zero waste. The company has set several science-based targets to guide its environmental goals.
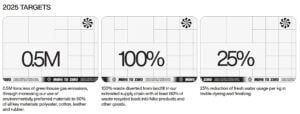
- It has also set a 2030 target to cut absolute Scope 1 and 2 emissions by 65% and Scope 3 emissions by 30% compared to 2015 levels.
Scope 1 emissions are from Nike’s own operations. Scope 2 comes from purchased energy, and Scope 3 includes the larger supply chain, like materials, manufacturing, and shipping. Since most of Nike’s carbon footprint comes from its supply chain, Scope 3 reduction is one of the company’s biggest challenges.
Nike also aligns its goals with the Science Based Targets initiative (SBTi), which ensures climate targets match global pathways to limit warming to 1.5°C.
Cutting Carbon: Wins and Stumbles
Nike’s most recent sustainability report shows mixed progress on its emissions. Here are the major ones:
- Scope 1 and 2 emissions:
Nike has cut its Scope 1 and 2 greenhouse gas emissions by 69-73% as of 2023-2024. This is compared to the 2015 baseline. They surpassed their goal of a 65% reduction by 2030. These reductions come from energy efficiency efforts and switching to 100% renewable electricity. This shift is happening in owned and operated facilities in places like North America and Europe.

- Scope 3 emissions:
Nike’s value chain emissions remain the largest part of its carbon footprint, accounting for over 90% of total emissions. Total Scope 3 emissions for 2024 were about 8.2 million metric tons of CO₂e. This marks a 29% reduction since 2020. However, it shows only a small drop from the 2022 and 2023 levels. The company emphasizes material innovation and the use of renewable energy in its supply chain. This is especially true for its Supplier Climate Action Program (SCAP).
- Renewable energy use:
The company uses 100% renewable electricity in its North American and European facilities. Globally, it aims for about 78-80% renewable electricity by 2023-2024. This is achieved through power purchase agreements, onsite solar and wind, and green energy options.
- Transportation:
Nike has reduced air freight by 80% since 2020. This aligns production with shipping schedules. They are increasing ocean freight usage and aim to ship 50% of products by ocean freight by 2025. This change could cut shipping emissions by around 40%. Pilot projects in Europe are testing hydrogen-fueled barges to support this effort.
These figures show that while Nike is reducing emissions from its direct operations, tackling supply chain emissions remains difficult.
Sneakers Go Green: From Waste to Wear
Beyond emissions, Nike is also working on materials and product design. The company has pledged to cut the environmental impact of its shoes and apparel through innovation.
Nike now uses recycled polyester and organic cotton in many products through its “Move to Zero” program, which includes a focus on zero carbon and zero waste. In 2023, almost 40% of Nike’s polyester came from recycled sources, helping reduce reliance on fossil fuels.
The company also reuses waste from manufacturing. More than 90% of Nike’s footwear manufacturing waste is either recycled or reused. The popular “Nike Grind” program turns scrap materials into new products, like shoe soles or sports surfaces.
Nike has also tested circular design models, such as recycling old shoes into new ones. Its refurbishment program extends the life of products by repairing and reselling lightly worn footwear.
Scope 3: Nike’s Toughest Opponent Yet
Nike has made real progress, but challenges remain. Scope 3 emissions are still the largest part of its footprint, and reducing them will require deeper changes in supply chain practices. This includes encouraging suppliers to use renewable energy and improving manufacturing efficiency.
Nike also faces growing consumer and regulatory pressure. Governments in Europe and North America are pushing for stricter climate reporting and accountability. Meeting these standards will test Nike’s ability to deliver on its promises.
Still, Nike has shown commitment by tying executive pay to sustainability goals. The company has also joined global climate coalitions, such as RE100, which aims for 100% renewable electricity.
Bridging the Gap: Offsets for Shipping and Beyond
The company offsets 100% of emissions from U.S. and European e-commerce orders, covering shipping from warehouses to customers. In Oregon, it partners with Ecotrust Forest Management on 28,000 acres of forests that capture about 30% more carbon than standard practices. In Europe, it supports reforestation projects that remove carbon through tree planting.
Nike stresses that carbon credit offsets are only a “bridge” and focuses on using projects verified by independent standards to ensure real and lasting results.
Looking ahead, Nike’s financial growth and climate commitments will remain closely linked. Investors are now paying attention to both quarterly earnings and ESG performance. The company’s ability to reduce emissions while maintaining strong revenue will be key to its long-term success.
Where Performance Meets Purpose
Nike’s latest earnings report shows solid financial momentum, with rising revenue, higher profit, and lower inventory levels. At the same time, the company continues to advance its net-zero journey, with major progress on Scope 1 and 2 emissions and renewable energy adoption.
However, its large Scope 3 footprint remains a challenge, making supply chain transformation essential. With strong climate targets, sustainable material use, and innovation in circular design, Nike is positioning itself as both a sportswear leader and a company working toward climate responsibility.
The post Nike (NKE Stock) Scores Big: Earnings Surprise and Climate Goals in Focus appeared first on Carbon Credits.
Every business carbon footprint report ends with a number, the amount of carbon emissions produced by the business, less the amount of carbon reduced and offset, given in tonnes of CO₂. Many of the people who sign off on that number, including those who paid for it, cannot picture what it represents on the ground. A tonne is a unit of mass. CO₂ is invisible. The link between the amount offset in the report and a real piece of restored forest somewhere in the world is almost never indicated.
![]()
Americans are paying more for insurance, electricity, taxes, and home repairs every year. What many people may not realize is that climate change is already one of the drivers behind those rising costs.
For many households, climate change is no longer just an environmental issue. It is becoming a cost-of-living issue. While climate impacts like melting glaciers and shrinking polar ice can feel distant from everyday life, the financial effects are already showing up in monthly budgets across the country.
Today, a larger share of household income is consumed by fixed costs such as housing, insurance, utilities, and healthcare. (3) Climate change and climate inaction are adding pressure to many of those expenses through higher disaster recovery costs, rising energy demand, infrastructure repairs, and increased insurance risk.
The goal of this article is to help connect climate change to the everyday financial realities people already experience. Regardless of where someone stands on climate policy, it is important to recognize that climate change is already increasing costs for households, businesses, and taxpayers across the United States.
More conservative estimates indicate that the average household has experienced an increase of about $400 per year from observed climate change, while less conservative estimates suggest an increase of $900.(1) Those in more disaster-prone regions of the country face disproportionate costs, with some households experiencing climate-related costs averaging $1,300 per year.(1) Another study found that climate adaptation costs driven by climate change have already consumed over 3% of personal income in the U.S. since 2015.(9) By the end of the century, housing units could spend an additional $5,600 on adaptation costs.(1)
Whether we realize it or not, Americans are already paying for climate change through higher insurance premiums, energy costs, taxes, and infrastructure repairs. These growing expenses are often referred to as climate adaptation costs.
Without meaningful climate action, these costs are expected to continue rising. Choosing not to invest in climate action is also choosing to spend more on climate adaptation.
Here are a few ways climate change is already increasing the cost of living:
- Higher insurance costs from more frequent and severe storms
- Higher energy use during longer and hotter summers
- Higher electricity rates tied to storm recovery and grid upgrades
- Higher government spending and taxpayer-funded disaster recovery costs
The real debate is not whether climate change costs money. Americans are already paying for it. The question is where we want those costs to go. Should we invest more in climate action to help reduce future climate adaptation costs, or continue paying growing recovery and adaptation expenses in everyday life?
How Climate Change Is Increasing Insurance Costs
There is one industry that closely tracks the financial impact of natural disasters: insurance. Insurance companies are focused on assessing risk, estimating damages, and collecting enough revenue to cover losses and remain financially stable.
Comparing the 20-year periods 1980–1999 and 2000–2019, climate-related disasters increased 83% globally from 3,656 events to 6,681 events. The average time between billion-dollar disasters dropped from 82 days during the 1980s to 16 days during the last 10 years, and in 2025 the average time between disasters fell to just 10 days. (6)
According to the reinsurance firm Munich Re, total economic losses from natural disasters in 2024 exceeded $320 billion globally, nearly 40% higher than the decade-long annual average. Average annual inflation-adjusted costs more than quadrupled from $22.6 billion per year in the 1980s to $102 billion per year in the 2010s. Costs increased further to an average of $153.2 billion annually during 2020–2024, representing another 50% increase over the 2010s. (6)
In the United States, billion-dollar weather and climate disasters have also increased significantly. The average number of billion-dollar disasters per year has grown from roughly three annually during the 1980s to 19 annually over the last decade. In 2023 and 2024, the U.S. recorded 28 and 27 billion-dollar disasters respectively, both setting new records. (6)
The growing impact of climate change is one reason insurance costs continue to rise. “There are two things that drive insurance loss costs, which is the frequency of events and how much they cost,” said Robert Passmore, assistant vice president of personal lines at the Property Casualty Insurers Association of America. “So, as these events become more frequent, that’s definitely going to have an impact.” (8)
After adjusting for inflation, insurance costs have steadily increased over time. From 2000 to 2020, insurance costs consistently grew faster than the Consumer Price Index due to rising rebuilding costs and weather-related losses.(3) Between 2020 and 2023 alone, the average home insurance premium increased from $75 to $360 due to climate change impacts, with disaster-prone regions experiencing especially steep increases.(1) Since 2015, homeowners in some regions affected by more extreme weather have seen home insurance costs increased by nearly 57%.(1) Some insurers have also limited or stopped offering coverage in high-risk areas.(7)
For many families, rising insurance costs are no longer occasional financial burdens. They are becoming recurring monthly expenses tied directly to growing climate risk.
How Rising Temperatures Increase Household Energy Costs

The financial impacts of climate change extend beyond insurance. Rising temperatures are also changing how much energy Americans use and how utilities plan for future electricity demand.
Between 1950 and 2010, per capita electricity use increased 10-fold, though usage has flattened or slightly declined since 2012 due to more efficient appliances and LED lighting. (3) A significant share of increased energy demand comes from cooling needs associated with higher temperatures.
Over the last 20 years, the United States has experienced increasing Cooling Degree Days (CDD) and decreasing Heating Degree Days (HDD). Nearly all counties have become warmer over the past three decades, with some areas experiencing several hundred additional cooling degree days, equivalent to roughly one additional degree of warmth on most days. (1) This trend reflects a warming climate where air conditioning demand is increasing while heating demand generally declines. (4)
As temperatures continue rising, households are expected to spend more on cooling than they save on heating. The U.S. Energy Information Administration (EIA) projects that by 2050, national Heating Degree Days will be 11% lower while Cooling Degree Days will be 28% higher than 2021 levels. Cooling demand is projected to rise 2.5 times faster than heating demand declines. (5)
These projections come from energy and infrastructure experts planning for future electricity demand and grid capacity needs. Utilities and grid operators are already preparing for higher peak summer electricity loads caused by rising temperatures. (5)
Longer and hotter summers also affect how homes and buildings are designed. Buildings constructed for past climate conditions may require upgrades such as larger air conditioning systems, stronger insulation, and improved ventilation to remain comfortable and energy efficient in the future. (10)
For many households, this means higher monthly utility bills and potentially higher long-term home improvement costs as temperatures continue to rise.
How Climate Change Affects Electricity Rates
On an inflation-adjusted basis, average U.S. residential electricity rates are slightly lower today than they were 50 years ago. (2) However, climate-related damage to utility infrastructure is creating new upward pressure on electricity costs.
Electric utilities rely heavily on above-ground poles, wires, transformers, and substations that can be damaged by hurricanes, storms, floods, and wildfires. Repairing and upgrading this infrastructure often requires substantial investment.
As a result, utilities are increasing electricity rates in response to wildfire and hurricane events to fund infrastructure repairs and future mitigation efforts. (1) The average cumulative increase in per-household electricity expenditures due to climate-related price changes is approximately $30. (1)
While this increase may appear modest today, utility costs are expected to rise further as climate-related infrastructure damage becomes more frequent and severe.
How Climate Disasters Increase Government Spending and Taxes
Extreme weather events also damage public infrastructure, including roads, schools, bridges, airports, water systems, and emergency services infrastructure. Recovery and rebuilding costs are often funded through taxpayer dollars at the federal, state, and local levels.
The average annual government cost tied to climate-related disaster recovery is estimated at nearly $142 per household. (1) States that frequently experience hurricanes, wildfires, tornadoes, or flooding can face even higher public recovery costs.
These expenses affect taxpayers whether they personally experience a disaster or not. Climate-related recovery spending can increase pressure on public budgets, emergency management systems, and infrastructure funding nationwide.
Reducing Climate Costs Through Climate Action
While this article focuses on the growing financial costs associated with climate change, the issue is not only about money for many people. It is also about recognizing our environmental impact and taking responsibility for reducing it in order to help preserve a healthy planet for future generations.
While individuals alone cannot solve climate change, collective action can help reduce future climate adaptation costs over time.
For those interested in taking action, there are three important steps:
- Estimate your carbon footprint to better understand the emissions connected to your lifestyle and activities.
- Create a plan to gradually reduce emissions through energy efficiency, cleaner technologies, and more sustainable choices.
- Address remaining emissions by supporting verified carbon reduction projects through carbon credits.
Carbon credits are one of the most cost-effective tools available for climate action because they help fund projects that generate verified emission reductions at scale. Supporting global emission reduction efforts can help reduce the long-term impacts and costs associated with climate change.
Visit Terrapass to learn more about carbon footprints, carbon credits, and climate action solutions.
The post How Climate Change Is Raising the Cost of Living appeared first on Terrapass.


-
Climate Change10 months ago
Guest post: Why China is still building new coal – and when it might stop
-
Greenhouse Gases10 months ago
Guest post: Why China is still building new coal – and when it might stop
-

 Greenhouse Gases2 years ago
嘉宾来稿:满足中国增长的用电需求 光伏加储能“比新建煤电更实惠”
-

 Climate Change2 years ago
嘉宾来稿:满足中国增长的用电需求 光伏加储能“比新建煤电更实惠”
-
Climate Change2 years ago
Bill Discounting Climate Change in Florida’s Energy Policy Awaits DeSantis’ Approval
-

 Renewable Energy7 months ago
Sending Progressive Philanthropist George Soros to Prison?
-

 Carbon Footprint2 years ago
US SEC’s Climate Disclosure Rules Spur Renewed Interest in Carbon Credits
-
Greenhouse Gases11 months ago
嘉宾来稿:探究火山喷发如何影响气候预测