
Welcome to Carbon Brief’s DeBriefed.
An essential guide to the week’s key developments relating to climate change.
This week
China’s new climate pledge
GUTERRES DEMANDS: UN secretary general António Guterres hosted a special climate action summit in New York on Wednesday, the Associated Press reported, alongside the closing day of the UN general assembly. It added that at the “marathon session”, where 121 world leaders were scheduled to speak, Guterres said: “The science demands action. The law commands it. The economics compel it. And people are calling for it.”
CHINA CUTS: First billing went to President Xi Jinping, who unexpectedly appeared via video to announce a target of cutting emissions – from all greenhouse gases and across China’s entire economy – to 7-10% below peak levels by 2035, according to Bloomberg. This is a significant moment for global climate efforts, noted BBC News, as it is the first time that China has pledged to reduce its emissions in absolute terms.
CAUTIOUS RESPONSE: However, the pledge fell short of the “at least 30%” cut observers had said was needed, BBC News added. Carbon Brief has published a detailed Q&A on China’s new climate pledge and will host a free webinar on the topic. Sign up for free.
PLEDGE CONFUSION: The Guardian said “120 countries and the EU announced new goals” at the summit. However, Carbon Brief analysis of the speeches and official submissions found that only 11 countries offered new targets. Following the summit, countries representing half of global emissions have now announced or submitted their 2035 climate pledges, according to analysis just published by Carbon Brief.
Trump’s new climate sledge
‘CLIMATE CON’: The day before the Guterres summit, Donald Trump had used a nearly hour-long speech to the UN general assembly to deliver what the Bloomberg Green newsletter called a “blizzard” of “climate misinformation”. He attracted blanket coverage – and multiple factchecks – for false claims including that climate change was the “greatest con job ever” and that warming predictions were “wrong”.
FACTCHECK: Contrary to Trump’s claims, human-induced warming is an “established fact”, according to the IPCC, as is an increase in the strength and frequency of extreme weather events. Regarding climate models, Carbon Brief climate science contributor Dr Zeke Hausfather noted on Bluesky that projections of warming have been “pretty spot on”.
Around the world
- RENEWABLE RECORD: Global investment in renewable energy grew 10% year-on-year to a record $386bn in the first half of 2025, the Guardian said.
- CARBON CLUB: COP30 host Brazil is “trying to build a coalition of countries, including the EU and China, to unify carbon markets”, Bloomberg reported.
- FOSSILS OUT?: Colombia will host the first-ever international conference on phasing out fossil fuels in 2026, according to Climate Home News. Meanwhile, E&E News covered the latest UN “production gap” report saying, despite a COP28 pledge to transition away from fossil fuels, “many are planning for even more production”.
- SUPER TYPHOON: Ragasa, a category 5 “super typhoon” and the world’s most powerful tropical cyclone this year, killed 17 people in Taiwan, BBC News said. The storm, which was “intensified” by climate change according to the Hong Kong Free Press, caused nearly two million residents to be evacuated in China, added Xinhua,
- DEFORESTATION DELAY: The EU has delayed the start of its anti-deforestation law “by another year”, Reuters said, blaming “IT system concerns”.
- AIRPORT APPROVAL: The UK government approved a second runway at London’s Gatwick airport, said BBC News. The Sunday Times reported that it was also “poised to soften” its ban on new drilling in the North Sea.
62,700
The number of deaths in Europe linked to heat-related causes in 2024, the continent’s hottest year on record, according to new research covered by Reuters.
Latest climate research
- Extreme and “unprecedented” global water-scarcity events – or “day-zero droughts” – could happen in the 2020s and 2030s | Nature Communications
- The drying of the Ganga river, of great economic and cultural importance to millions of people in India, Nepal and Bangladesh, is “unprecedented in the last 1,300 years” | Proceedings of the National Academy of Sciences
- The likelihood of “severe bushfires danger” in Australia driven by a positive Indian Ocean Dipole has increased by 16-32% due to climate change | Journal of Geophysical Research: Atmospheres
(For more, see Carbon Brief’s in-depth daily summaries of the top climate news stories on Monday, Tuesday, Wednesday, Thursday and Friday.)
Captured
China’s new climate pledge, outlined by President Xi Jinping, includes a target to reduce “economy-wide net greenhouse gas emissions” to 7-10% below peak levels by 2035. But, as Carbon Brief explained in a detailed Q&A, this falls short of what would have been needed to contribute to limiting warming to 1.5C, according to experts.
Spotlight
Can COP30 respond to the 1.5C challenge?
With hopes fading of keeping global warming below 1.5C, despite new pledges at a UN summit in New York, this spotlight looks at the road to COP30 in Brazil and how the climate talks might respond.
After 2024 marked the hottest year on record and the first above 1.5C, 2025 was supposed to offer a chance to “course correct” through new, more ambitious national climate plans.
Instead, many countries have missed repeated deadlines for updated “nationally determined contributions” (NDCs) under the Paris Agreement, setting out their plans to 2035.
Despite some new pledges in New York this week – including from China – collective efforts still “fall short” of limiting warming to the Paris goals of “well-below” 2C while “pursuing efforts” towards 1.5C.
Drumbeat of ‘disappointment’
This message is likely to be reinforced by a UN “synthesis report”, compiling the impact of new NDCs and due to be published on 24 October.
It will likely be reiterated in early November by the UN’s annual “emissions gap” report. Last year’s report had called for a “quantum leap” in ambition, which has yet to materialise.
This is all despite an advisory opinion from the International Court of Justice in July, which said that 1.5C should be considered the “primary temperature goal” of global climate efforts – and that countries should make “adequate contributions” towards meeting it.
Meanwhile, amid oil and gas advocacy from the Trump administration, debate is raging over whether fossil fuels have peaked – and whether climate efforts need a “pragmatic” reset.
This is set to culminate with a battle to control the narrative around the International Energy Agency (IEA) World Energy Outlook for 2025, also due in early November.
Avantika Goswami, programme manager for climate change at India’s Centre for Science and Environment, told Carbon Brief that the global climate regime was at a “turning point”, where agreements had been signed and targets set, but action was “stalling”. She said:
“Implementation is weak, finance is undelivered and trust in the UN system is eroding, amid trade wars, militarism, debt crises and fractured multilateralism.”
Can COP30 respond?
Just days after the raft of new reports, on 6-7 November, heads of state and government will gather in the Brazilian city of Belém for a leaders summit ahead of the COP30 climate talks.
Views differ on how COP30 should respond to the current challenges.
The Brazilian presidency is pushing for a formal COP decision on any “disappoint[ment]” over NDCs falling short, collectively, of what is needed to avoid dangerous global warming.
During initial consultations, the EU said it wanted climate ambition to be added to the COP agenda, while the groups of least developed countries (LDCs), small island states and Latin American countries supported a formal COP decision on the matter. Others pushed back.
Catherine Abreu, director of the International Climate Politics Hub, told Carbon Brief that COP30 would need to respond in some way. She said:
“It’s clear that credibility at COP30 will require a response to the fact that countries’ climate pledges don’t add up to the level of ambition needed to tackle the crisis. The question after this week is, how will the COP outcomes enrich our definition of ambition beyond a headline emissions reduction goal?”
Abreu added that COP30 would need to address barriers, including “the equitable finance needed to implement goals and a lagging transition away from fossil fuels”.
Amid frustration over slow progress, calls for reform of the COP process are getting louder.
Goswami concluded: “The needs and ambitions of the global south must now shape the climate narrative – and COP30 must reckon with this new balance of power.”
Watch, read, listen
GAME OVER?: A feature in the Wall Street Journal said that, as Trump “doubles down on fossil fuels”, the US is “forfeiting the clean-energy race to China”.
POPULIST PUSHBACK: The Drilled podcast talked to a sociologist and a political scientist about “the intersection between the rise of rightwing populism and increasing resistance to acting on climate”.
ADULTS ONLY: For the New York Times, the Asia Society Policy Institute’s Li Shuo wrote that China was “the adult in the room on climate now”, despite its “modest” new pledge.
Coming up
- 22-26 September: Fifth world congress of biosphere reserves, Hangzhou, China
- 27 September: Seychelles elections
- 28 September: Moldova elections
- 30 September-1 October: 42nd UN water meeting, Geneva, Switzerland
Pick of the jobs
- Indigenous Climate Action, research coordinator | Salary: $55,000-$68,000. Location: Remote
- Greater London Authority, head of climate change | Salary: £91,268. Location: London
- Stockholm Environment Institute, research fellow: climate impact and climate finance | Salary: Unknown. Location: Nairobi, Kenya
DeBriefed is edited by Daisy Dunne. Please send any tips or feedback to debriefed@carbonbrief.org.
This is an online version of Carbon Brief’s weekly DeBriefed email newsletter. Subscribe for free here.
The post DeBriefed 26 September 2025: China leads new climate pledges; Trump calls warming a ‘con job’; What comes next appeared first on Carbon Brief.
The head of the United Nations has launched an initiative aimed at holding artificial intelligence companies accountable for their exploding environmental impacts, including their carbon emissions, the amount of water and land used for data centres, and the energy they consume.
During a speech at London Climate Action Week on Tuesday, António Guterres noted that AI can accelerate climate solutions, among other key challenges, and said its potential must be harnessed.
“But AI is also hungry for land, water and power,” he emphasised, adding that the data centres needed to run AI models already consume more electricity than most countries.
The UN Secretary-General repeated a call he first made in July 2025 for all big AI companies to commit to power every data centre with renewable energy by 2030.
Some tech firms have announced they are sourcing or building out clean energy to run their hubs, but growing power demand is also contributing to gas-fired generation in the US, according to data from Global Energy Monitor.
The International Energy Agency (IEA) estimates that data centres are set to more than double the emissions from the electricity they use between 2024 and 2030 in a high-growth scenario. But AI’s use could lead to far larger reductions in the energy sector through efficiency gains if adopted widely.
-
UN chief says fossil fuel industry must cut methane for warming “relief”
The UN Secretary-General urges drastic reductions in methane emissions, starting with the energy sector, to limit an expected overshoot of global warming beyond 1.5C -
China’s coal-chemicals boom risks repeating the mistakes of the past
By reviving the problematic industry in the name of energy security, China runs the risk of higher emissions, stranded assets and setting back its ambitions as a clean energy leader -
Mombasa ocean summit drives progress on marine protection, but threats persist
At the 11th Our Ocean conference in Kenya, its founder John Kerry says the ocean must become central to climate solutions and needs to be looked after


‘No more hidden costs’
Proposing the new “AI Environmental Transparency Initiative” on Tuesday, Guterres also urged big AI firms companies to measure and publicly disclose the full environmental impact of their systems, including their carbon, water, and land footprints.
“No more hidden costs. No more shifting the burden onto those least able to bear it. It is time to come clean,” he said in a major speech on responding to the world’s twin climate and energy crises. “If AI is to help build a better future, it must be honest about what it costs us now.”
A report issued earlier this month by the UN University Institute for Water, Environment and Health noted that most current assessments of AI’s environmental cost focus on carbon emissions from training models. But, it added, this misses a substantial part of the picture.
Every kilowatt-hour of electricity for AI also carries a water footprint, from cooling and generation, and a land footprint, from infrastructure and supply chains, it said.
Explainer: Will AI data centres make or break the energy transition?
The report estimated that AI data centres globally could consume 945 terawatt-hours of electricity annually by 2030 – more power than all but five countries and roughly twice France’s 2025 consumption.
Offsetting this carbon footprint by 2030 would require growing some 6.7 billion trees over 10 years, it calculated. Producing power for the data centres would consume water equal to the basic needs of 1.3 billion people in sub-Saharan Africa for a year and take up land of more than 14,500 square kilometers, roughly twice the Jakarta metropolitan area.
The European Union said earlier this month it will develop minimum energy-efficiency standards for both new and existing data centres, with a “needs assessment” due by 2027, Reuters reported. It’s also planning a sustainability label for data centres, covering criteria including water use and clean energy supply – but that has been delayed.
US community push-back
Asked after his speech what the response had been, the UN chief said “we’ll see”, without giving more details.
But, he argued that, in his view, the push for transparency “is perfectly reasonable and even positive for the AI industry, because eventually some people will say that they consume much more than they really do”. “I think the truth is essential,” he added.
Concerns about the environmental impacts of AI and the infrastructure needed to run the technology have led to growing opposition in some communities, especially in the US.
This month, Monterey Park in Los Angeles County was the first city in the United States to enact a citywide prohibition on data centres through a voter-approved ballot measure. The developers behind a proposed centre in the area had already pulled the project in April amid an increasingly hostile local environment and regulatory uncertainty.
The vote that stopped a data center: US communities query resource-hungry AI
According to nonprofit Data Center Watch, around $64 billion-worth of data centre projects nationwide were delayed or blocked between May 2024 and March 2025 as communities pushed back against them.
Industry lobby groups argue that data centres can provide economic benefits in their host communities. According to the US-based Data Center Coalition, which represents big operators and developers, data centres generate tax revenue, support construction and technical jobs, and provide infrastructure needed for cloud computing, scientific research and AI development.
The industry has also challenged claims that data centers necessarily raise electricity costs for households.
Force for good?
The UN chief said benefits can be few in the places that are home to the data centre, while “communities are often left in the dark about the environmental impact of the infrastructure rising around them”.
Guterres said companies have an “obligation” to be clear and open about the services they are offering but also the level of resources they require.
“Transparency is essential for the decisions that communities must make – and transparency is essential even for the future of artificial intelligence, and to make sure that artificial intelligence is essentially a force for good,” he told an audience of climate professionals in London
A senior UN official told journalists ahead of Tuesday’s announcement that the AI industry has started to talk about and disclose some of their impacts, but those efforts are not yet comprehensive enough.
The hope is that the new initiative will “encourage the industry to come together and take further action on it”, the official said.
The post UN asks AI companies to reveal full environmental impacts appeared first on Climate Home News.
Phillipe Ciais has spent almost four decades researching the planet’s carbon cycle – and the ways in which humans have been impacting its balance.
Based at the Laboratoire des Sciences du Climat et de l’Environnement (LSCE) on the outskirts of Paris, Ciais (pronounced “see-es”) has been listed as an author on more than 1,300 peer-reviewed studies.
In fact, analysis of Carbon Brief’s Cosmos database reveals that – by some distance – he is the most highly cited climate scientist in the world.
In a wide-ranging interview, he discusses:
The post Prof Philippe Ciais: The world’s most highly cited climate scientist appeared first on Carbon Brief.
https://www.carbonbrief.org/prof-philippe-ciais-the-worlds-most-highly-cited-climate-scientist/
Climate Change
Cited 23 June 2026: Project Cosmos launch | Science ‘under attack’ at Bonn | Emissions inequality
Welcome to Cited, your essential guide to new climate research.
In the news
SCIENCE ‘UNDER ATTACK’: Climate Home News reported that “dozens” of countries called out “coordinated attacks” aimed at “undermining the role of climate science” at UN climate talks in Bonn, Germany, last week. According to the outlet, the countries said that UN decision-making had to remain based on the “best available science”, including the reports of the Intergovernmental Panel on Climate Change. One negotiator said that India and Saudi Arabia “opposed calls in draft texts to encourage scientific work on scenarios that would minimise the magnitude and duration of any overshoot of 1.5C”, the article noted. For more, read Carbon Brief’s summary of the negotiations.
REPORT OPPOSITION: “Oil industry allies” in the US are targeting a report on extreme weather attribution, due to be published by the National Academies of Sciences, Engineering and Medicine, according to Politico. The outlet reported that the “heightened scrutiny – which involves a secretive opposition research group scouring scientists’ emails – has prompted two people to leave the 15-person panel tasked with producing the report”. Separately, the Guardian reported that the Trump administration has “reversed its decision” to dismantle the Ocean Observatories Initiative, a $368m deep-sea observation system.
SUPER EL NIÑO: BBC News reported that the US National Oceanic and Atmospheric Administration announced that El Niño had “officially begun”. Forecasts suggest the event could be among the “strongest ever recorded”, it added. Meanwhile, a “vigorous debate” is taking place about whether climate change is making the El Niño phenomenon more intense, according to the New York Times. The outlet explained that some scientists see the run of “comparatively strong” El Niño events in recent decades as an indication that “climate change is supercharging El Niño”. However, it added that “others say there is no clear evidence to support that theory”.
Research picks
Water
- Global sea level rise has nearly tripled the number of days since the 1970s when coastal water levels have surpassed average tide gauge readings | Science Advances
- As the Arctic warms, increased iceberg activity could “reshape” deep-sea habitats and “elevate” navigational hazards as maritime traffic expands | Nature
- Sea level rise has quadrupled the frequency of extreme coastal sea-level events since the year 1900 | Nature Climate Change
Inequality
- The top 10% of consumers are responsible for $1.7-5.7tn of environmental damage each year, surpassing international climate and biodiversity financing gaps | Communications Sustainability
- Calculating an individual’s emissions based on their asset ownership suggests that wealthier people are responsible for an even higher share of global greenhouse gas emissions than indicated by past studies | Nature Climate Change
- A plan that places equity at the “centre” of climate adaptation efforts in cities is needed to address the “stark disparities” between “affluent” and “disadvantaged” urban communities’ ability to prepare for extreme heat | PLOS Climate
Extremes
- In the western US, 42% of burned area over 2001-24 occurred during, and immediately following, heatwaves | Science Advances
- “Hot-to-wet” whiplash events have become more frequent across Australia over the past century, with south-eastern Australia emerging as a hotspot | Journal of Climate
- Rapid urbanisation, combined with more intense rainfall from tropical cyclones, have increased people’s exposure to “extreme” rainfall from tropical cyclones across China | Journal of Hydrometeorology
Captured
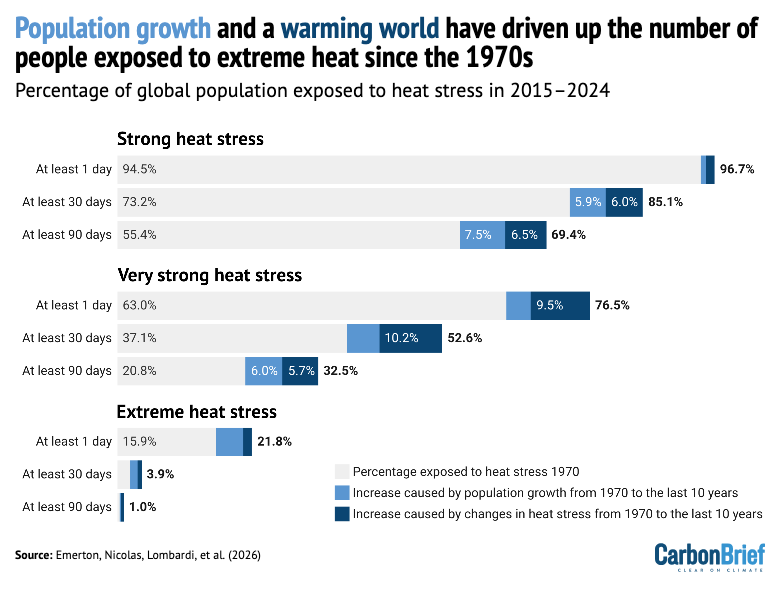
One billion additional people face at least one day of “extreme heat stress” every year compared to the 1970s, according to research published in Nature Climate Change.
The chart shows changes in “strong” (top), “very strong” (middle) and “extreme” (bottom) heat stress, defined as a “universal thermal climate index” above 32C, 38C and 46C, respectively. The grey bar shows the percentage of the global population exposed to at least one, 30 or 90 days of heat stress in 1970. The light and dark blue bars show the number of additional people experiencing heat stress over 2015-24 due to population growth and rising global temperatures, respectively.
10%
Equivalent damage to the UK’s GDP caused by climate change if global warming reaches 4C by 2100, according to new research in Nature Climate Change. The study estimates a range of 2-20%.
Spotlight
Introducing: Project Cosmos
Carbon Brief explains how it built a major new database of climate science research and unveils a new ranking of the 500 most highly cited publications, authors and institutions in climate science.
This week, Carbon Brief launched Project Cosmos – the world’s largest and most complete database of climate change research.
The database features more than 1.8m academic papers, books and reports, capturing the vast body of human knowledge about climate change that has accumulated over more than a century of academic study.
The climate science “universe” is based on reports from the Intergovernmental Panel on Climate Change (IPCC), which are recognised as the world’s most authoritative summaries of the latest climate science.
Since its first report was published in 1990, humanity’s knowledge about human-caused climate change has ballooned. The IPCC has published six sets of reports in total – each one longer than the last.
In total, IPCC reports reference more than 100,000 other papers, books and reports. This is the core of our climate science universe. Carbon Brief then built on this core, by looking at four other sources of data. Read more about how the Cosmos database was created here.

Every single publication in the Cosmos database is linked to at least one other through references. Visualising these links reveals a “galaxy” of references. In the image above, each colour and cluster reveals different topics and densities of research. Explore the galaxy in an interactive map here.
Cosmos 500
As part of an initial wave of preliminary analysis to demonstrate the scope of the Project Cosmos database, Carbon Brief has ranked the 500 most highly cited publications, authors and institutions in the database.
The most highly cited climate scientist is Prof Philippe Ciais, who has spent almost four decades researching the planet’s carbon cycle – and the ways in which humans have been impacting its balance. Carbon Brief recently interviewed Ciais in Paris.
The US tops the tables for the most highly-cited authors and institutions. Almost half of the 500 most highly-cited authors are from US institutions. This raises particular concerns for the future of climate science, as American climate scientists and institutions are coming under attack under the Trump administration.
Experts from global south countries account for only 4% of all authors in the Cosmos 500. China stands out as the most highly-cited global south country. Meanwhile, only 10% of authors in the Cosmos 500 are women.
There are many possibilities for future avenues of research using the Cosmos database. Over time, the database could be used to reveal, for example, how interest in different areas of climate science has changed over time, plus identify potential knowledge gaps and, thus, opportunities for future research.
Carbon Brief invites researchers – including academics, journalists and analysts – to submit their own proposals for co-authored studies, literature reviews and analytical projects.
Preprints to watch
Carbon Brief’s pick of new papers still going through peer review
- Regional reductions in aerosol emissions can “temporarily amplify” the likelihood of record-breaking heat events | Environmental Research: Climate
- Analysis of Reddit posts suggests the Fridays for Future movement has created “wider awareness” of global warming by drawing attention to climate change and “climate actions” | npj climate action
- Periods of simultaneous low wind and solar power generation, known as “renewable energy droughts”, will “intensify progressively” as the planet warms | Nature portfolio
Noticeboard
- 28-30 June: Seventh global conference on climate and sustainable development goal synergies, Bangkok, Thailand
- 29 June-1 July: Exeter climate conference, Exeter, UK
- 29 June-1 July: National Academy of Sciences hybrid workshop on seabed critical mineral resources, Irvine, US
- 30 June: Submission deadline for abstracts for MedCLIVAR conference, scheduled for 21-25 September in Limassol, Cyprus
- 30 June: Application deadline for postdoctoral position in ice-ocean interactions at the Physics Laboratory of Ecole Normale Supérieure de Lyon | Salary: €3,071-4,714 per month. Location: Lyon, France
- 30 June: Submissions open for abstracts for the pan-African conference on environment, climate change and health, scheduled for 21-24 October in Nairobi, Kenya
- 8 July: Application deadline for position as research officer in climate science and law at the Grantham Research Institute | Salary: £43,277-51,714. Location: London, UK
- 10 July: Application deadline for position as associate or senior editor at Nature Water | Salary: Unknown. Location: Shanghai, Beijing or Milan
Cited is researched and written by Cecilia Keating, Robert McSweeney, Ayesha Tandon, Daisy Dunne and Dr Giuliana Viglione.
Please send tips, feedback and upcoming climate research to cited@carbonbrief.org
This is an online version of Carbon Brief’s fortnightly Cited email newsletter. Subscribe for free here.
The post Cited 23 June 2026: Project Cosmos launch | Science ‘under attack’ at Bonn | Emissions inequality appeared first on Carbon Brief.
Cited 23 June 2026: Project Cosmos launch | Science ‘under attack’ at Bonn | Emissions inequality


-
Greenhouse Gases11 months ago
Guest post: Why China is still building new coal – and when it might stop
-
Climate Change11 months ago
Guest post: Why China is still building new coal – and when it might stop
-

 Greenhouse Gases2 years ago
嘉宾来稿:满足中国增长的用电需求 光伏加储能“比新建煤电更实惠”
-

 Climate Change2 years ago
嘉宾来稿:满足中国增长的用电需求 光伏加储能“比新建煤电更实惠”
-
Climate Change2 years ago
Bill Discounting Climate Change in Florida’s Energy Policy Awaits DeSantis’ Approval
-

 Renewable Energy8 months ago
Sending Progressive Philanthropist George Soros to Prison?
-

 Carbon Footprint2 years ago
US SEC’s Climate Disclosure Rules Spur Renewed Interest in Carbon Credits
-
Greenhouse Gases11 months ago
嘉宾来稿:探究火山喷发如何影响气候预测