
Financial firms dropped terms like “ESG” (Environmental, Social and Governance) and “sustainable” from the names of hundreds of their funds in the year before new European Union rules to clamp down on greenwashing came into force in late May, new analysis shows.
The rules from the European Securities and Markets Authority (ESMA) say that funds with certain sustainability or environmental-related terms in their names cannot invest in companies that get more than a certain share of their revenue from coal, oil, gas or particularly polluting electricity generation.
Those funds now also have to show that 80% of their investments meet the ESG objectives referred to in their titles.
Before the new regulation was introduced, the fund managers that dropped environmental and other sustainability terms from the highest percentage of their fund names were State Street, UBS and Northern Trust, the analysis said. It estimates that around 674 funds have done this overall.
Alison Schultz, an analyst at the German campaign group Finanzwende who conducted the research, said fund managers had earlier betrayed investors’ trust by labelling their funds wrongly and misdirecting money that should have helped to advance the green transition towards supporting business as usual.
“Consumers bought the funds because they wanted to invest sustainably,” she said, adding that “renaming [them] instead of divesting undermines the credibility of a market that depends on financial products being what they claim to be”.
Many fund managers have replaced ESG terminology in the titles of their funds with alternative words like “screened”, “selection” or “committed”, according to research by Finanzwende, Urgewald and Facing Finance and a separate analysis from Morningstar Analytics, which sells research and information to investors.
For example, Invesco changed its “Sustainable Eurozone Equity Fund” into the “Transition Eurozone Equity Fund” in March. Fund documents show that in April 2025 it had investments in Italy’s Enel and Germany’s E.ON, two utilities that sell gas and fossil-fuel electricity.
“Screened” and “transition” funds
Funds with words like “screened” or “transition” in their name can continue to invest as much as they want in oil, gas and coal businesses under the new EU regulations. Hortense Bioy, head of sustainable investing research at Morningstar, told Climate Home the use of words like this suggests fund managers “are still keen to offer products that signal ESG characteristics in the name”.
According to earlier research on the same topic released in March by Urgewald and Facing Finance, more than half of the funds that have dropped environmental-related terms from their names held shares in large fossil fuel companies – with the investments worth around €14bn ($16bn). The name changes mean that they can keep those investments.
While some have gone down this path, Morningstar analysis suggests others have done the opposite – ditching fossil fuels investments and keeping their green names. Leading global fund managers like US-based BlackRock, the world’s largest asset manager, have taken a varied approach across their portfolios.
An email BlackRock sent to clients on March 18, which it shared with Climate Home, said it had responded to the ESMA naming guidelines by changing the names of 56 funds worth $51bn to drop sustainability terms. An example it gave was dropping “ESG” from the BSF Systematic ESG World Equity Fund.
On the other hand, the email said it had kept the ESG names of another 60 funds worth $92bn, “enhancing the sustainable characteristics”.
Funds drop Total, Galp and Eni
Morningstar found that ESG funds which did not rebrand themselves as less green were investing less in fossil fuel companies like TotalEnergies, Galp and Eni in March this year compared to May 2024.
“It is fair to assume that part of the decline can be attributed to stock divestments made to comply with the ESMA guidelines,” their analysis said.
While State Street renamed the highest percentage of these funds, other firms – like BlackRock and Amundi – have lots of sustainability-related funds that were grouped under broad EU green financial disclosure categories but never had these now-regulated terms in their names.
Cobalt and nickel-free electric car batteries boom in “good news” for rainforests
Last July, Climate Home revealed that EU-based funds like Blackrock’s, which claimed to be environmentally friendly, held shares worth at least $65 million in major coal companies. Under the new rules, they can continue as long as they don’t have “environmental” or “sustainable” terms in their name.
While funds with what the ESMA calls environmental, impact or sustainability related terms cannot invest in companies with fossil fuel revenues above a certain threshold (see chart above), funds with transition-related terms still can. These words include “transition”, “improve”, “progress”, “evolution”, “transformation” and “net zero”.
BlackRock also said it had either changed the names or investment methodologies of 18 funds worth $42bn for a “clearer alignment to transition” in response to the new rules.
Investors notified
Fund managers are required to notify investors of the name changes, usually in prospectuses sent to professional investment managers.
Bioy of Morningstar said she had seen many of these notifications and, in some of them, fund managers told investors they were lowering their sustainable investment allocations. “Some of them are not as ESG as they used to be,” she said. “They’ve become almost like traditional funds.”
But she said that firms that have renamed their funds cannot necessarily be accused of greenwashing before because there were “no rules” over what terms like ESG and sustainable meant. Investors now need to be educated on what these terms legally mean according to the new rules, she added.
The rules only affect funds marketed in EU countries but, according to Bioy, that is the vast majority of the world’s funds that make green claims, even though they make up a small proportion of the total.
Asked to comment, a BlackRock spokesperson told Climate Home the investment objectives of its funds “are clearly disclosed in each fund’s prospectus and on BlackRock’s website”.
Funds “are managed in line with applicable regulations governing sustainable investing”, they said, adding that “for investors that have decarbonization investment objectives we offer a range of products that provide such exposure”.
At the time of publication, State Street, UBS, Northern Trust and Invesco had not responded to requests for comment.
The post As EU acts to stop greenwash, funds drop climate claims from their names appeared first on Climate Home News.
As EU acts to stop greenwash, funds drop climate claims from their names
In this rural Alabama community, some residents can’t flush their toilets. Developers want to build a state-of-the-art data center next door.
HAYNEVILLE, Ala.—When Alabamians marched from Selma to Montgomery in 1965 to demand voting rights for African Americans, Highway 80 became their path toward freedom.
On the Historic Route From Selma to Montgomery, an AI Cloud Looms
The planet is heating up more quickly than ever before.
For decades, greenhouse gas emissions caused by human activity have been building up in the atmosphere and trapping ever-higher levels of heat.
The resulting asymmetry between incoming solar energy and energy radiated back out into space – known as “Earth’s energy imbalance” – provides a direct measure of the extent to which humans are disrupting the Earth’s climate system.
This imbalance is growing and in 2025 its 10-year average reached a record high, indicating that global temperatures could increase at even higher rates in the future.
This is among the headline findings of the latest “indicators of global climate change” (IGCC) report, published in the journal Earth System Science Data, which tracks changes in the climate system on an annual basis.
The report, now in its fourth iteration, has been produced by dozens of scientists from around the world.
Its findings are designed to fill the gap between Intergovernmental Panel on Climate Change (IPCC) science reports, which are published every 5-7 years.
In this article, we unpack the IGCC report, which explores how human activity is driving a growing energy imbalance and why monitoring systems to track global climate are so crucial.
(For more on previous IGCC reports, see Carbon Brief’s coverage in 2023, 2024 and 2025.)
Greenhouse gas emissions remain at an all-time high
Global greenhouse gas emissions are continuing to increase, mostly as a result of the use of fossil fuels. However, deforestation, agriculture and industrial processes also play an important role.
Over the most recent decade (2015-24), emissions stood at the equivalent of 54.6bn tonnes of carbon dioxide equivalent (GtCO2e) per year. In 2024, the most recent year for which we have complete data, emissions reached 56.8GtCO2e.
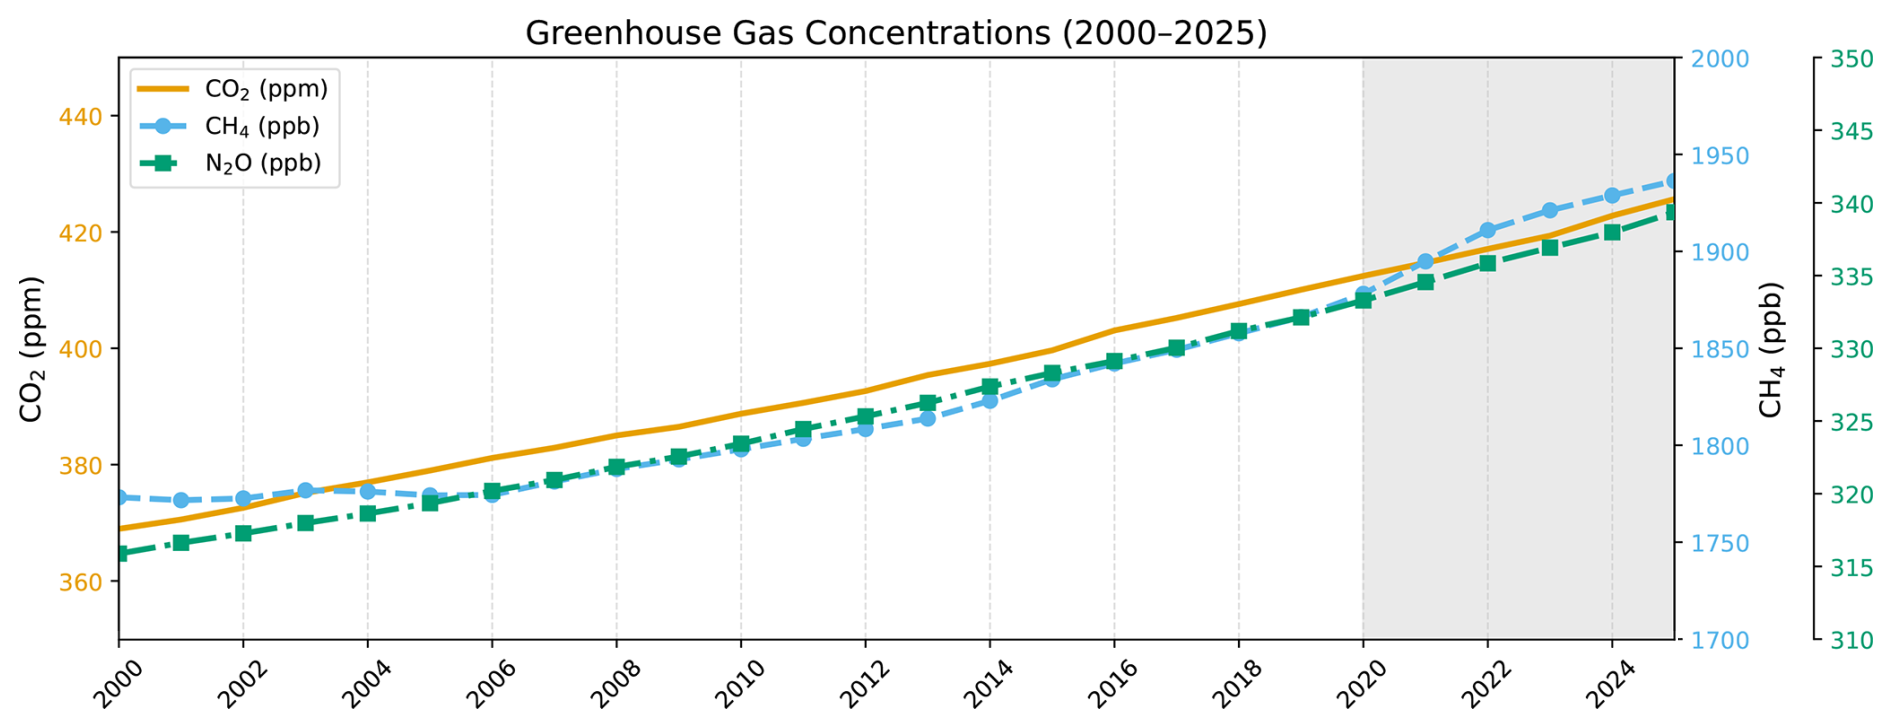
As the chart below shows, these emissions have pushed up atmospheric levels of CO2, methane and nitrous oxide. In 2025, concentrations of these gases reached 425.6 parts per million (ppm), 1936.3 parts per billion (ppb) and 339.4ppb, respectively.
This represents a rise of 3.8%, 3.8% and 2.2%, respectively, since the 2019 levels reported in the IPCC’s sixth assessment report (AR6).
At the same time, declines in emissions of aerosols such as sulphur dioxide, partly as a result of efforts to tackle air pollution, are increasing the Earth’s energy imbalance. This is because aerosols have a cooling effect on the Earth’s climate, counteracting warming from CO2 and other greenhouse gas emissions.
(Tackling sulphur dioxide, alongside other particulate emissions, remains critical because the immediate health and environmental damage they cause far outweighs their short-term cooling effect on the climate.)
The Earth’s energy imbalance is rising rapidly
The Earth’s energy imbalance has long been recognised as a key indicator of how the climate is being affected by human activities.
However, it is only in the last few decades that scientists have been able to record temperature changes deep enough in the ocean to accurately quantify it.
Earth’s energy imbalance measures how quickly excess heat is accumulating in every part of the Earth system, primarily in the ocean, but also in land, ice and atmosphere.
Through this accumulation of heat, the energy imbalance influences the rate of sea level rise and ice melt across the world, as well as increasing the frequency and intensity of extreme weather events, such as storms, floods and droughts.
Without human influence, the Earth’s energy imbalance would be close to zero.
But, as greenhouse gas emissions have built up in the atmosphere, the imbalance has been growing since the 1970s. Recent increases to Earth’s energy imbalance have outpaced those projections made by climate models — indicating the planet could see more warming than expected in the future.
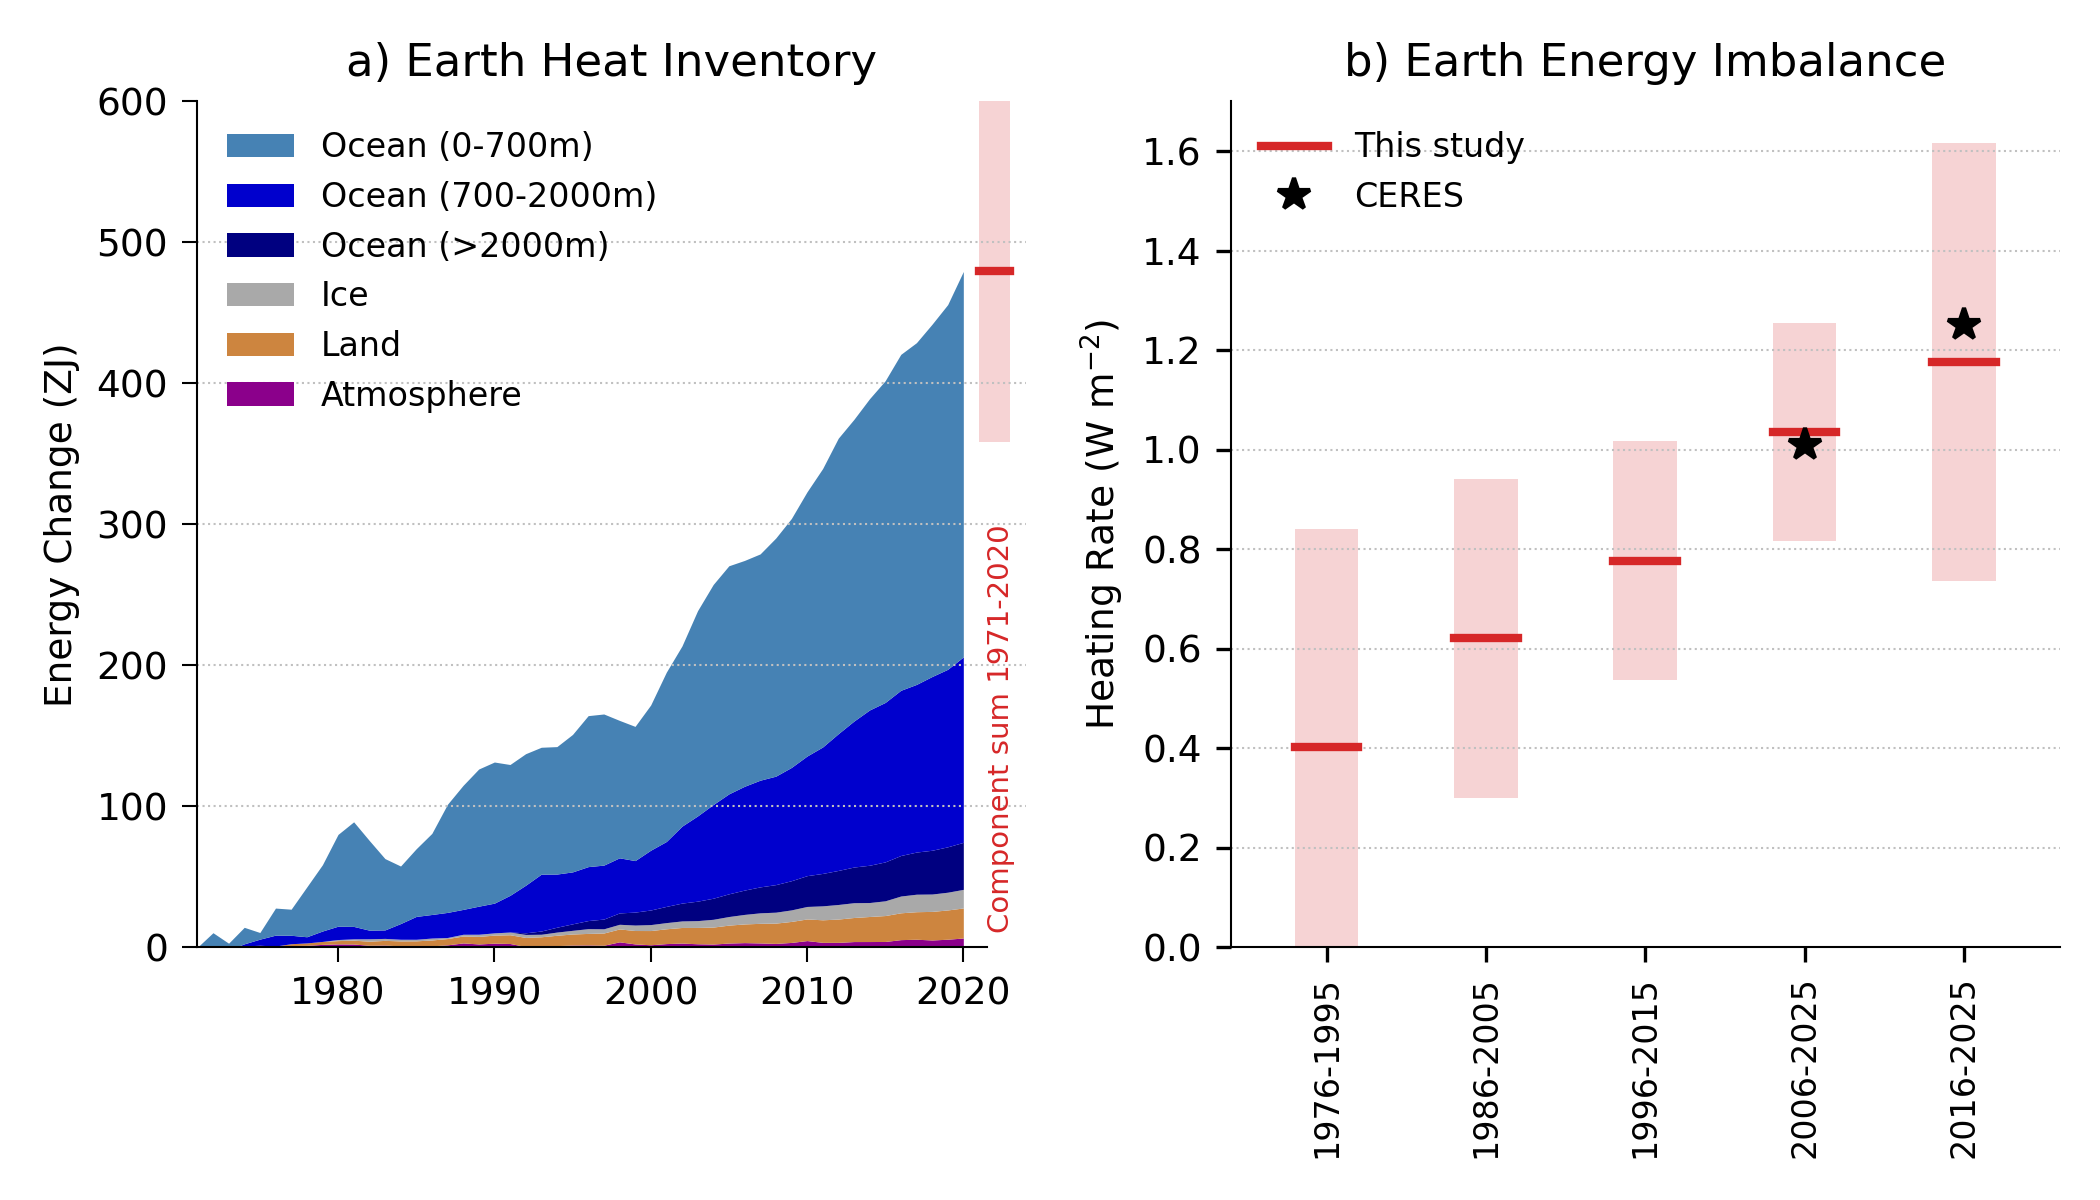
As the right-hand chart below shows, the imbalance is now at a record high, having more than doubled over the past two decades.
It has increased by around 40% since 2019, from an average 0.79 watts per square metre (Wm2) over 2006-18, according to IPCC AR6, to 1.12Wm2 over 2013-25.
The left-hand chart shows how heat is accumulating in the ocean (blues), ice (grey), land (orange) and atmosphere (purple).
Global temperature rise
The excess heat building up in the climate system from the energy imbalance is pushing up global temperatures at a record rate of 0.27C per decade.
We estimate that human-induced warming – the amount of observed global surface
temperature increase attributable to both the direct and indirect effects of human activities – reached 1.37C in 2025. This has risen from 1.0C in 2017, as reported in IPCC AR6.
While natural variability in the climate system – such as El Niño or La Niña events – can also influence temperatures year-to-year, the upward temperature trend we are seeing is being driven by the persistent imbalance in energy.
We now expect global temperatures to exceed the Paris Agreement limit of 1.5C above pre-industrial levels around the year 2030.
This is significant because 1.5C has been identified as the critical dividing line between manageable climate risks and catastrophic, potentially irreversible damage to global ecosystems and human societies.
Heat accumulating throughout the Earth system
While heat is accumulating throughout the Earth system, it is not being distributed evenly around the globe.
Since the 1970s, around 90% of this heat has been taken up by the ocean, affecting marine ecosystems, ocean circulation patterns, sea level rise and climate extremes.
For example, the number of marine heatwave days – periods of unusually high sea surface temperatures – has more than tripled globally since the early 1990s. The year 2025 alone saw 65 days of marine heatwaves – meaning they occurred, on average, more than one day a week.
Meanwhile, the cryosphere – the portion of the Earth made up of frozen water, including glaciers, ice sheets and permafrost – is experiencing widespread ice loss and thawing in response to the growing energy imbalance. This affects ecosystems, sea level rise and infrastructure in polar and high-latitude regions.
Rapid warming has also resulted in record extreme temperatures over land, with average maximum temperatures for any single day over 2016-25 around 1.92C above pre-industrial levels). This is an increase of almost half a degree compared to the previous decade (2006-15).
Sea level rise and the energy imbalance
Sea level rise provides one of the clearest long-term signals of a changing planet.
It is closely linked to Earth’s energy imbalance. As heat accumulates in the ocean, water expands, raising sea levels. Meanwhile, a warming land and atmosphere means addition of water to the oceans through melting of glaciers and ice sheets, also adding to sea level rise.
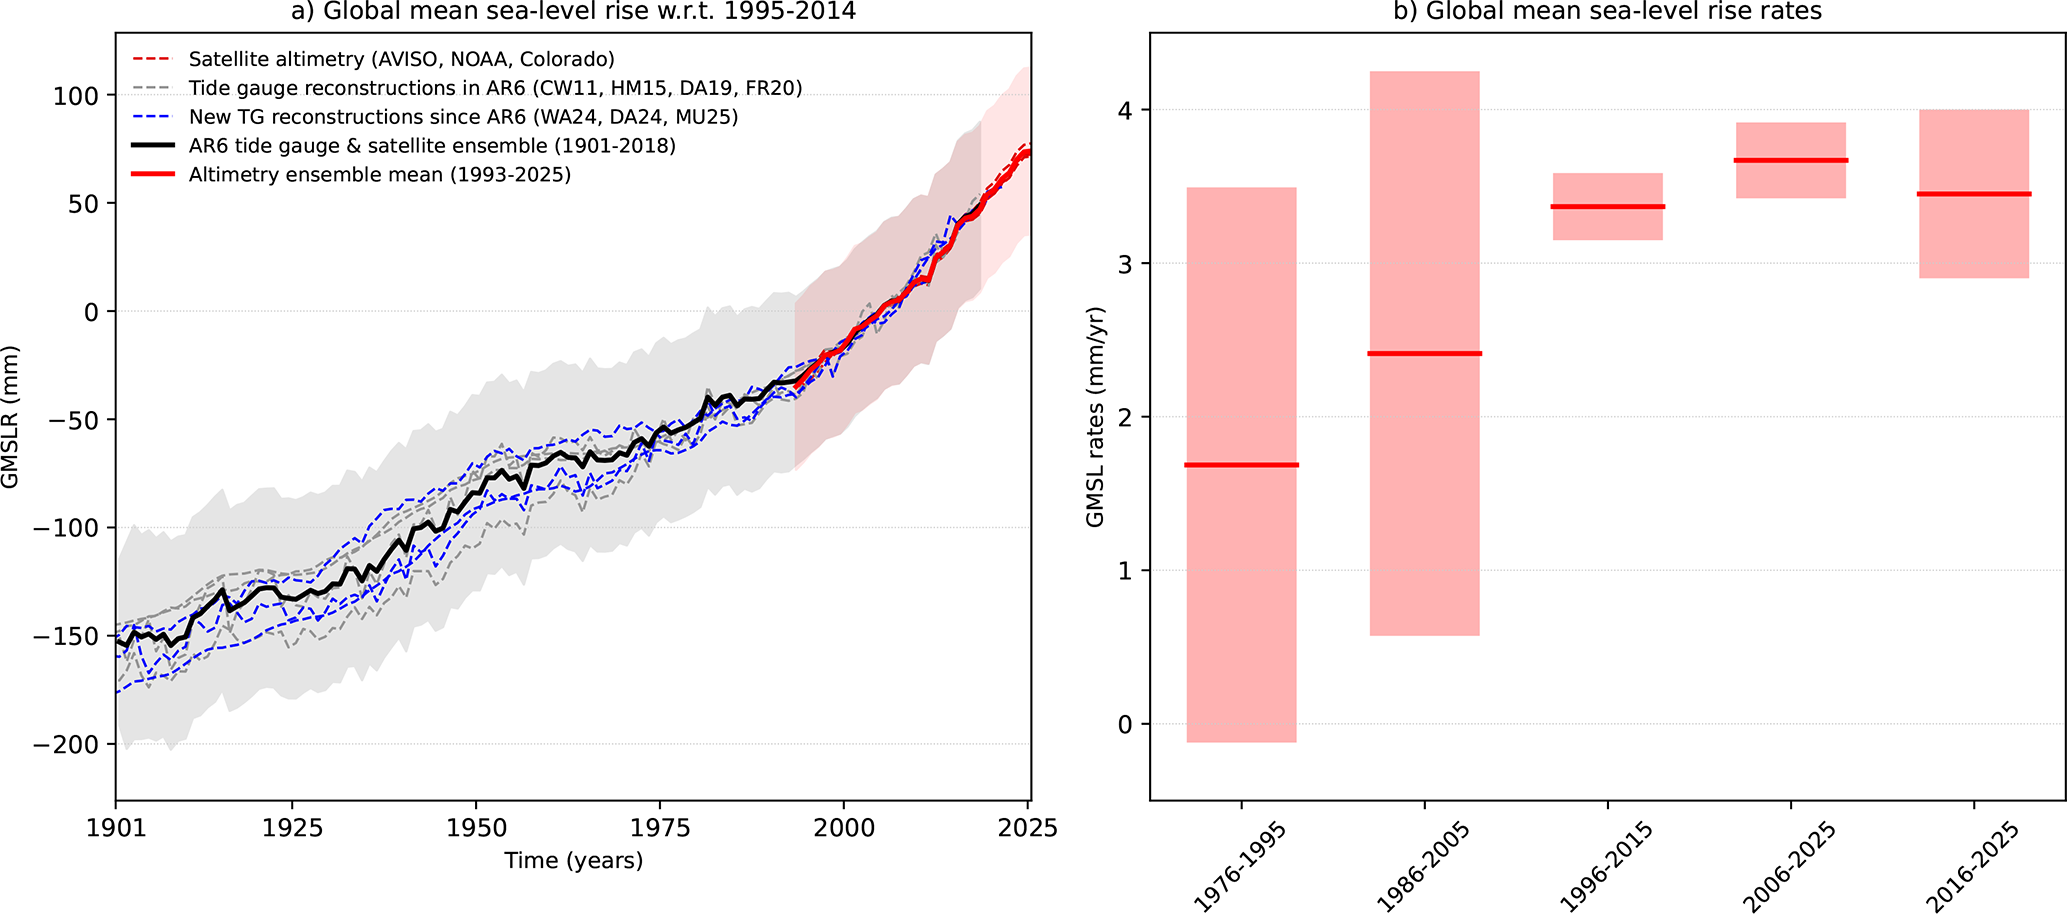
Over the long-term, sea levels have been rising, on average, at a rate of around 1.8mm per year since 1901, totalling a record 23cm in 2025. This is increasing the risk of coastal flooding, erosion and habitat loss in many low-lying areas around the world.
This rise can be seen in the left-hand chart below, which shows observed global sea level changes from tide gauges (grey and blue dashed lines) and satellites (red dashed lines) since 1901. The solid lines indicate the average across multiple datasets.
Sea level rise is accelerating consistent with the observed increase in Earth’s energy imbalance. Over 2006-25, sea levels have risen at a rate of 3.67mm per year – more than double the rate of 1.69mm per year seen over 1976-95.
This increasing rate is shown in the right-hand figure below, which shows four successive overlapping 20-year periods and the most-recent decade.
(Last year’s transition from El Niño to weak La Niña conditions affected global rainfall patterns and led to a small and temporary fall in global average sea level in 2025. This explains the slight decrease in rate of sea level rise for the most recent decade, which is affected more than the 20-year period 2006-25.)
The bigger picture
Despite greenhouse gas emissions not increasing as rapidly as in the 2000s, this year’s IGCC findings continue to show how far and how fast the climate is changing due to human activity.
A significant increase in decarbonisation efforts in the second half of this decade is required to slow down the rate of human-caused warming and limit the escalation of climate risks and impacts.
These findings, like many others produced by scientists across the globe, rely on international expertise, partnership and the maintenance and availability of global climate datasets and the global observing programmes that underpin them.
This year’s edition of IGCC used more than 40 global datasets produced by research teams around the world, including the NASA satellite record of the Earth’s energy imbalance and the ARGO deep ocean float network.
However, a number of long-term monitoring programmes could be threatened by funding decisions made by governments around the world, most notably the Trump administration in the US.
Local meteorological data and weather balloon measurement programmes in many countries have declined in recent years, especially in Africa, the west Pacific and South America. This reduces scientists’ ability to monitor and understand key indicators of climate change.
This is not just an issue for climate science. Many of these observations are key to weather forecasts and systems that provide early warning for extreme weather. For example, media reports have suggested that recent reductions in weather balloon measurements in Alaska led to a lack of warnings for a recent winter storm.
The continuity and integrity of the climate observations that scientists use to understand how the climate is changing depends on effective and sustained coordination by international organisations, such as the Global Climate Observing System, the World Meteorological Organization and World Climate Research Programme.
Without this data and its coordination, future assessments will be much more difficult at a time when urgent climate action is needed.


The post Guest post: How a record-high ‘energy imbalance’ is driving global warming appeared first on Carbon Brief.
Guest post: How a record-high ‘energy imbalance’ is driving global warming
A new paper found that the remnants of “foundation species” strongly influenced the fate of survivors.
Death casts a shadow over life, not only for people but also other animals, plants and entire ecosystems.
Across Ecosystems, Dead Organisms Help Shape the Living World


-
Climate Change10 months ago
Guest post: Why China is still building new coal – and when it might stop
-
Greenhouse Gases10 months ago
Guest post: Why China is still building new coal – and when it might stop
-

 Greenhouse Gases2 years ago
嘉宾来稿:满足中国增长的用电需求 光伏加储能“比新建煤电更实惠”
-

 Climate Change2 years ago
嘉宾来稿:满足中国增长的用电需求 光伏加储能“比新建煤电更实惠”
-
Climate Change2 years ago
Bill Discounting Climate Change in Florida’s Energy Policy Awaits DeSantis’ Approval
-

 Renewable Energy8 months ago
Sending Progressive Philanthropist George Soros to Prison?
-

 Carbon Footprint2 years ago
US SEC’s Climate Disclosure Rules Spur Renewed Interest in Carbon Credits
-
Greenhouse Gases11 months ago
嘉宾来稿:探究火山喷发如何影响气候预测