

Visa and Mastercard, processing billions of payment transactions yearly, reported strong financial growth in 2025, driven by rising payment volumes and cross-border transactions. However, their massive operations generate significant carbon emissions, pushing them to adopt sustainability and net zero strategies.
Strong Numbers, Stronger Strategy: Visa’s Q1 2025 Performance
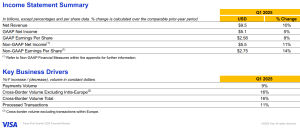
Visa reported strong Q1 2025 results, with net revenue rising 10% year-over-year (YoY) to $9.5 billion. Net income also increased 5% to $5.1 billion, while GAAP earnings per share (EPS) grew 8% to $2.58 and non-GAAP EPS stood at $2.75. Visa’s board declared a quarterly cash dividend of $0.59 per share.
The company attributed its growth to strong consumer spending, a rise in payment volume, and an increase in cross-border transactions. CEO Ryan McInerney highlighted three major growth drivers:
- Consumer payments,
- New payment flows, and
- Value-added services.
These areas continue to expand as Visa strengthens its global network.
A key move during the quarter was Visa’s acquisition of Featurespace, an artificial intelligence-powered fraud protection firm. This acquisition aligns with Visa’s long-term goal of enhancing transaction security.
While Visa continues to grow, its expenses are also increasing, particularly in research and development. However, its strong revenue growth has helped maintain profitability and reinforce its position as a leader in the payments industry.
Mastering Growth: How Mastercard Outpaced Expectations
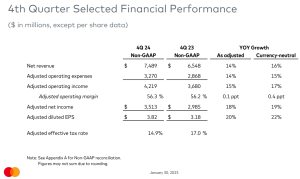
Mastercard posted strong 2024 results, with net revenue increasing 12% YoY to $28.2 billion, beating market expectations. Adjusted EPS grew 19% to $14.60, exceeding analyst estimates. Its adjusted operating margin improved slightly to 58.4%.
In Q4 2024, Mastercard’s gross dollar volume reached $2.6 trillion, up 12% YoY. Cross-border volumes, a key revenue driver, rose 20%, while switched transactions increased 11% to 42.2 billion. The company’s value-added services generated $3.1 billion in revenue, up 16%.
Mastercard’s value-added services and solutions business also played a critical role in its financial performance. Net revenue from these services reached $3.1 billion, a 16% YoY increase, driven by demand for security, digital authentication, and market insights.
Unlike Visa, Mastercard experienced a sharper increase in operating expenses, which climbed by 14% YoY to $3.3 billion. The rise was mainly due to higher general and administrative costs. However, adjusted operating income still grew by 15% YoY to $4.22 billion.
Both Visa and Mastercard reported strong financial growth, but Mastercard outpaced Visa in revenue, EPS growth, and transaction volume. Visa focused on operational efficiency and security investments, while Mastercard’s cross-border transactions and value-added services drove its growth.
A Green Rivalry: Who’s Leading the Sustainability and Net Zero Race?
Despite rising expenses, both companies remain leaders in the global payments industry. However, their massive operations with billions of transactions processed annually generate carbon emissions, prompting them to reduce their environmental footprint. While they share common goals, their sustainability and net zero approaches differ.
Swiping Towards Sustainability: Visa’s Carbon Goals and Green Investments
Visa aims to reach net-zero emissions by 2040, aligning with the Paris Agreement’s 1.5°C pathway. It has been carbon neutral in its operations since 2020, achieving this by reducing direct greenhouse gas (GHG) emissions and purchasing carbon offsets. The company sources 100% renewable electricity for its offices and data centers, significantly cutting GHG emissions.
Visa has made notable strides in reducing its operational emissions, particularly in Scope 1 and 2 emissions, which saw a downward trend from 2009 to 2022. However, in 2023, Scope 1 and 2 emissions increased from 6,400 to 10,600 metric tons of CO2 equivalent, primarily due to a slight uptick in Scope 2 emissions, rising from zero in 2022 to 300 metric tons.
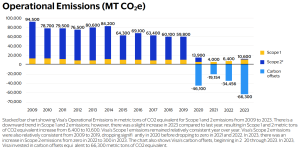
Despite this, Visa continues to offset its emissions significantly toward net zero. The payment processor has invested in carbon offsets equivalent to 66,300 metric tons of CO2 in 2023.
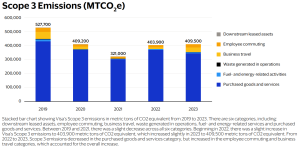
In terms of Scope 3 emissions, Visa experienced a slight rise in 2023, reaching 409,500 metric tons of CO2 equivalent. This is driven mainly by increases in employee commuting and business travel, while emissions from purchased goods and services saw a small decrease.
Carbon Offsets, Green Finance, and Climate Tech Solutions
Visa invests in renewable energy projects and high-quality carbon offset programs. The company supports global reforestation initiatives and clean energy transition projects.
In 2023, Visa’s environmental investments helped mitigate the equivalent of 400,000 metric tons of CO2 emissions.
The payment processor’s sustainability efforts extend to financial products. Visa has partnered with fintech firms to introduce carbon footprint tracking tools for consumers.
Through the Visa Eco Benefits program, banks can offer sustainability-focused rewards and carbon offset options. Additionally, Visa has worked with financial institutions to issue over 20 million eco-friendly payment cards made from recycled materials or biodegradable alternatives.
Furthermore, Visa is integrating sustainability into mobility and payment solutions. The company supports contactless payments for public transit to reduce reliance on cash and has collaborated with EV charging networks to streamline payments.
The company is also investing in climate-focused fintech startups that develop solutions for carbon tracking and sustainable finance. However, compared to its competitor, its indirect emissions strategy is less aggressive.
Priceless Progress: Mastercard’s Commitment to a Net-Zero Future
Mastercard has been carbon neutral in its operations since 2021 and aims to reach net-zero emissions by 2040. Like Visa, it sources 100% renewable electricity for its offices and data centers.
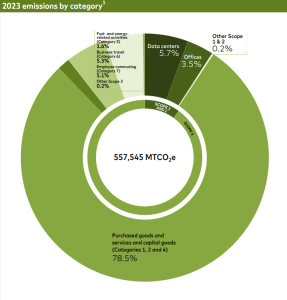
Mastercard has made significant progress in reducing its GHG emissions as part of its commitment to environmental sustainability. In 2023, the company achieved a 1% reduction in total emissions, totaling 557,545 metric tons of CO2 equivalent across Scope 1, 2, and 3.
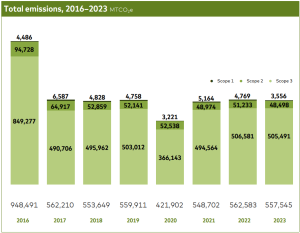
Notably, its Scope 1 and 2 emissions, which account for 9% of total GHG emissions, decreased by 7%, producing 52,054 metric tons of CO2 equivalent. These emissions have declined significantly, 48%, from its 2016 baseline.
For Scope 3 emissions, which make up 78% of the company’s total emissions, Mastercard saw a 3% reduction in its supply chain emissions in 2023, totaling 437,588 metric tons of CO2 equivalent.
The payment processor remains on track to meet its 2025 targets of reducing Scope 1 and 2 emissions by 38% and Scope 3 emissions by 20% compared to 2016 levels.
Mastercard‘s Scope 3 emissions came from indirect sources, primarily from its financial partners and supply chain. To address this, the company has integrated sustainability criteria into its vendor selection process and encourages its banking partners to reduce their own carbon footprints.
Mastercard’s Green Finance and Reforestation Efforts
Mastercard takes a different approach to carbon offsets and net zero from Visa. The company launched the Priceless Planet Coalition, a global reforestation initiative aiming to restore 100 million trees by 2025.
Through this initiative, Mastercard has already funded the planting of 60 million trees across 20 countries, aiming to remove approximately 10 million metric tons of CO2 from the atmosphere by 2030.

Mastercard has also taken the lead in sustainable financial tools. The Mastercard Carbon Calculator, developed with Doconomy, allows consumers to track the carbon footprint of their purchases directly within their banking apps. Over 50 banks worldwide have integrated this tool, helping millions of users make informed spending decisions.
Additionally, Mastercard has expanded its ESG-linked financial products, including green bonds and sustainability-focused credit cards. In 2023, the company supported the issuance of $500 million in ESG-linked financial products, reinforcing its commitment to sustainable finance.
Mastercard is also investing in climate technology and EV infrastructure. It has partnered with global EV charging networks to streamline payment processes and promote wider EV adoption. The company is also funding fintech startups that focus on climate risk management and sustainable investment platforms.
Visa vs. Mastercard: Who Leads in Sustainability?
Both Visa and Mastercard are making significant strides in financials and net zero. They both have achieved carbon neutrality in their operations, but Mastercard appears to have a more comprehensive and aggressive approach.
By integrating sustainability into financial products, investing in large-scale reforestation, and actively reducing indirect emissions, Mastercard sets a higher standard in climate action. Visa, on the other hand, excels in operational efficiency and renewable energy adoption but may need to expand its influence over its financial network to achieve a more substantial impact.
The post Visa vs. Mastercard: Who’s Leading the Charge in Finance, Sustainability, and Net Zero? appeared first on Carbon Credits.
Key takeaways
- SBTi is the default reference point for corporate climate action: 51% of Fortune Global 500 companies now hold net-zero targets, up from 8% in 2020, and over 11,000 organizations worldwide have SBTi-validated targets.
- Net Zero Standard V2 redefines climate leadership as reducing emissions and mitigating ongoing emissions, not reduction alone.
- The new standard adds flexibility through five-year cycles, a “best efforts” standard, and an Asset Transition Method for companies whose path to net-zero doesn’t fit a straight-line trajectory.
- Voluntary carbon credits are formally recognized for the first time, with reduction and removal credits accepted from 2027, and removals required from 2035.
- Companies with 2030 targets keep using V1 for their current cycle and move to V2 in 2028; companies without targets can start using V2 on February 1, 2027.
Why every business needs to understand the SBTi Net-Zero Standard revision
The Science Based Targets initiative (SBTi) has become the default reference point for credible corporate climate action. Net-zero targets are now held by 51% of Fortune Global 500 (FG500) companies, up dramatically from just 8% in 2020, and more than 11,000 organizations worldwide have set SBTi-validated targets.
However, SBTi’s influence extends well beyond the companies formally participating in the program. Every business in the value chain of an SBTi participant will have to reduce its own carbon emissions, and businesses that aren’t SBTi participants themselves still look to the program for guidance on climate action.
In short, SBTi gives every business a credible blueprint for climate action, and companies that follow its principles can pursue climate action with confidence, whether or not they’re formally part of the program.
How will the Net Zero Standard revision affect business climate action?
SBTi participation is expected to grow. Despite strong target-setting participation among the F500, only 17% of companies use the SBTi Net Zero Standard V1 beyond target setting, largely because its rules have been seen as too rigid to apply in practice. Much of the Net Zero Standard revision has focused on creating more flexibility to enable higher participation. Medium and small businesses will also increasingly feel pressure for climate action, since SBTi mandates that its participants reduce carbon emissions across their value chains.
Net Zero Standard V2 also redefines climate leadership: leading climate action now means reducing emissions and mitigating ongoing emissions. Reducing your own emissions while ignoring the emissions you continue to release along the way is no longer considered leadership. Supporting voluntary carbon projects with high-integrity carbon credits is now backed by the leading authority on corporate climate action.
What lessons shaped the Net Zero Standard V2 revision?
The revision reflects a few learnings about what actually drives climate progress, and how SBTi built those lessons into the new standard.
| Net Zero Standard V1 Learnings | Net Zero Standard V2 Implementation |
|---|---|
| Making real short-term progress is more important and more difficult than making big long-term promises | Focus on short-term climate progress |
| Every company has a different path to net zero that doesn’t always fit generalized net-zero rules | Create asset transition plans based on each company’s unique asset lifecycles and capital planning |
| We need to mitigate our ongoing emissions to keep global carbon emissions in check | Reduce global carbon emissions by financing voluntary carbon projects with high-integrity carbon credits |
What are the key changes between the old and new Net Zero Standard?
Both versions of the standard are grounded in net-zero by 2050. However, the old standard treated climate leadership as simply reducing emissions, expected a long-term commitment to net zero, based emission reduction targets on generalized net-zero goals, revoked status from companies that fell behind on targets, and ignored voluntary carbon projects entirely.
The new standard treats climate leadership as reducing emissions and mitigating ongoing emissions. It shifts the focus to short-term progress through five-year cycles, and it bases emission reduction targets on both the net-zero goal and a company’s own asset decarbonization plan. A new Asset Transition Method lets companies set decarbonization targets through asset plans with committed, verifiable steps; an ambitious but achievable path based on a company’s starting point, financial resources, and technology, with multiple pathways to reflect the unique opportunities and constraints of different industries and companies.
Crucially, the new standard moves to a “best efforts” basis that creates real flexibility on progress against targets. Businesses that miss their targets can keep their status if they’ve used “every lever” within their control, and minimum progress rules will be set out in the SBTi Assurance Manual.
Finally, the new standard formally uses voluntary carbon projects to mitigate ongoing emissions. From 2027 through 2034, this mitigation is recognized, and both carbon reduction and removal credits are accepted. From 2035 forward, mitigation with carbon removal credits becomes required, with durability matching between the removal and the emission it offsets.
| Old Net Zero Standard | New Net Zero Standard |
|---|---|
| Grounded in net-zero by 2050 | Grounded in net-zero by 2050 |
| Climate leadership is reducing emissions | Climate leadership is reducing emissions and mitigating ongoing emissions |
| Make a long-term commitment to net-zero | Focus on short-term progress in 5-year cycles |
| Emission reduction targets are based on net-zero goal |
|
| Businesses who fall behind targets lose status |
|
| Ignores voluntary carbon projects |
|
When does the new Net Zero Standard take effect?
Companies with existing 2030 targets should continue using the old Net Zero Standard for their current cycle, and start using the new Net Zero Standard in 2028 to set targets for the next cycle (2030–2035).
Companies that don’t yet have targets can use the new Net Zero Standard starting February 1, 2027.
What are SBTi’s Category A and Category B companies?
The new Net Zero Standard splits companies into two categories, with different requirements attached to each.
Category A covers large companies from all countries and medium-sized companies from high-income countries. A company from any country qualifies if it meets at least one of: net turnover of €450 million or more, or 1,000 or more full-time employees. A company from a high-income country qualifies if its Scope 1 and 2 emissions are 10,000 tCO2e or more, or if it meets at least two of: balance sheet of €25 million or more, net turnover of €50 million or more, or 250 or more full-time employees.
Category B covers small companies from all countries and medium-sized companies from lower-income countries.
How do Scope 1 targets work under Net Zero Standard V2?
Scope 1 targets aim to transition companies to net-zero direct emissions by 2050 or sooner, and companies can choose from three approaches.
- Absolute emissions reduction follows a straight-line emissions trajectory from the target base year to the net-zero year.
- Emissions intensity reduction lets companies follow sector-specific pathways designed to reflect the reduction opportunities available in sectors like steel, cement, or chemicals.
- Asset transition is designed for companies whose capital stock turnover doesn’t follow a linear or sector pathway. These companies design a transition plan to operate existing assets efficiently and replace them with low-carbon assets, using predetermined milestones.
How do Scope 2 targets work under Net Zero Standard V2?
Scope 2 targets address emissions from purchased electricity through three pathways:
- Reducing electricity consumption,
- Reducing grid consumption by installing onsite or direct-line offsite clean energy generation, and
- Cleaning up the regional grid using market-based tools like PPAs, RECs, and GOs that drive clean energy development.
V2 introduces a dual Scope 2 framework requiring two separate targets, with an overall goal of 100% low-carbon electricity by 2040.
The location-based target addresses the carbon intensity of a company’s physical power use, and requires companies to show that their grid consumption is falling and/or that their physical grid use is getting cleaner; in other words, that their market-based solutions are actually making the grid cleaner.
The market-based (or zero-carbon electricity) target tracks a company’s use of low-carbon power generation contracts and Energy Attribute Certificates. It requires geographical matching of these certificates with electricity consumption based on deliverability regions (grid regions); annual matching is allowed, though hourly matching is encouraged. Category A companies with large electricity loads must report the percentage of their Scope 2 electricity consumption matched with low-carbon attributes on an hourly basis, and there’s an optional recognition framework for companies that meet hourly matching thresholds.
How do Scope 3 targets work under Net Zero Standard V2?
Scope 3 targets share the same 2050-or-sooner net-zero goal, but companies set near-term targets only for material emissions sources in their value chain and areas where they have real influence. Long-term Scope 3 targets are generally not required.
Limited, justified exclusions are allowed for near-term targets, including categories that individually account for less than 5% of total Scope 3 emissions, and activities where a company lacks practical influence, like leased assets it doesn’t operationally control, or the processing of sold products. Optional exclusions are also available in specific categories.
Companies can choose from three approaches to near-term Scope 3 targets:
- An overarching emissions reduction target, which follows a linear contraction of emissions from the base year to residual emissions of 10% or less by 2050 or sooner;
- An overarching supplier/customer alignment target, benchmarked against a growing share of tier 1 suppliers and customers reaching net-zero by 2050 or sooner; or
- A category- or activity-specific target, tailored for companies with concentrated emissions in particular Scope 3 categories or high-emitting activities.
What is “ongoing emissions mitigation” under the new SBTi standard?
This is one of the most significant additions in Net Zero Standard V2. Accelerated climate contributions are needed to help the world achieve climate objectives, limit temperature overshoot, mitigate transition risks, and support the scale-up of climate solutions, and V2 formally recognizes that. Ongoing emissions mitigation runs as a parallel track to companies also reducing their own emissions.
The framework is initially voluntary, with recognition available at three contribution levels to encourage early action.
- Engaged companies address more than 1% of total Scope 1, 2, and 3 emissions.
- Advanced companies address more than 10% of total Scope 1, 2, and 3 emissions, including 100% of Scope 1 and 2 emissions.
- Leadership companies address 100% of total Scope 1, 2, and 3 emissions with a contribution budget of $80/tCO2e.
Carbon credits used for this purpose have to meet certain quality standards. They must be ex-post (issued after the mitigation has actually occurred), independently third-party-assured, emissions reductions or removals, measured in tCO2e, that occur within five years prior to the reporting year. They must be sourced from outside the company’s own value chain. Further minimum criteria will be set to align with high-integrity frameworks, with additional details on the recognition program expected in the second half of 2026.
Starting in 2035, carbon removals become mandatory for Category A companies. From that point, the carbon removal coverage requirement rises linearly from 1% of Scope 1–3 emissions to 100% by a company’s net-zero year. Within that, 10% of long-lived GHG emissions must specifically be covered by durable removals, also rising linearly to 100% by the net-zero year.
How must companies neutralize residual emissions?
At a company’s net-zero target year and thereafter, it must reduce its Scope 1, 2, and 3 emissions to zero or to residual levels, and neutralize all residual emissions using eligible carbon removals. Those removals have to meet two conditions: they must occur within the same reporting period as the residual emissions they’re neutralizing, and long-lived GHGs must be neutralized with long-lived removals, matching the durability of the removal to the atmospheric lifetime of the emission being addressed.
What is the SBTi implementation hierarchy?
Net Zero Standard V2 also lays out how companies should prioritize their actions for credible target delivery, in three tiers.
- Direct actions, at the activity level, are actions that reduce emissions at the source within a company’s own operations and value chain; things like efficiency improvements, fuel switching, and engaging suppliers and customers to reduce their emissions.
- Actions within shared systems, or activity pools that reduce the emissions of shared systems like electricity or gas grids. This includes market instruments that convey low-carbon attributes, such as PPAs, RECs, and GOs, all of which must meet minimum integrity criteria that SBTi will elaborate on in future guidance.
- Sector-level actions relate to the same type of activity occurring in a relevant geography or system, in a way that meaningfully reduces the emissions a company is responsible for.
How Terrapass helps businesses meet the new SBTi standard
As the rules around carbon credits become more rigorous, the quality of the credits behind them matters more than ever. Terrapass has expanded our global network of carbon projects: more project types, locations, prices, ICVCM CCPs, and UN SDGs, spanning super-pollutant destruction, nature-based solutions, and durable removals. We offer Green-e® Climate Certification and we only source from third-party-verified projects on ICVCM-Eligible registries.
We also help clients with impact beyond carbon: EACs, RECs, and GOs including Green-e® Certified credits that support leading renewable energy projects; water credits that support water restoration projects; and custom environmental product needs like RNG and SAF. Wherever your organization is on its sustainability journey, we help clients around the world address climate risk, advance their environmental and social goals, and get the most out of their sustainability budgets.
FAQ: SBTi Net-Zero Standard revision
What is the SBTi Net-Zero Standard?
It’s the framework the Science Based Targets initiative publishes for companies that want validated, credible net-zero targets tied to limiting global warming.
What is changing in the SBTi Net Zero Standard V2 revision?
The biggest changes are more flexibility (five-year cycles and a “best efforts” standard), a new Asset Transition Method for companies whose emissions don’t follow a straight-line path, and formal recognition of voluntary carbon credits for mitigating ongoing emissions.
When do companies need to switch to the new SBTi standard?
If your company already has 2030 targets, you keep using V1 for your current cycle and move to V2 in 2028. If you don’t have targets yet, you can start using V2 as of February 1, 2027.
Can companies use carbon credits to meet SBTi targets?
They can. Under V2, high-integrity carbon reduction and removal credits count toward mitigating ongoing emissions from 2027 through 2034. Starting in 2035, only removal credits count, and they need to be durability-matched to the emissions they offset.
What’s the difference between Category A and Category B companies under SBTi?
Category A is large companies everywhere plus medium-sized companies in high-income countries, based on thresholds like revenue, headcount, or emissions. Category B is small companies everywhere and medium-sized companies in lower-income countries.
What happens if a company misses its SBTi target?
Under the old standard, falling behind could cost a company its SBTi status. Under V2’s “best efforts” approach, a company can hold onto its status as long as it’s used every lever within its control, with minimum progress rules coming in the SBTi Assurance Manual.
Sources: This post is based on Terrapass’s internal analysis of the SBTi Corporate Net-Zero Standard V2.0. Facts and figures were checked against SBTi’s official V2.0 announcement, SBTi’s Corporate Net-Zero Standard V2.0 — Chapter 6: Ongoing Emissions Responsibility, Trellis’s coverage of the standard, Trellis’s reporting on Ongoing Emissions Recognition costs, Sylvera’s analysis of what comes next, Anthesis Group’s Fortune 500 net-zero commitments research, and Climate Impact Partners’ seventh annual FG500 analysis, as reported by CarbonUnits.com.
The post SBTi Net-Zero Standard V2: What the Revision Means for Every Business appeared first on Terrapass.
For most businesses, the emissions that matter most sit outside their own walls. Scope 3 emissions, everything generated across your value chain, from the suppliers who make your inputs to the customers who use your products, typically make up the majority of a company’s total carbon footprint. Under the Corporate Sustainability Reporting Directive (CSRD), those value-chain emissions now have to be measured and disclosed with a rigour that spend-based estimates alone struggle to satisfy. This guide sets out how to improve Scope 3 data accuracy for CSRD: the calculation methods open to you, how to move from estimates to verified supplier data, and how to govern that data so it holds up to audit.
![]()
A carbon credit is a commitment that extends well into the future. The tonne of CO₂ compensated for today from a nature-based carbon project must remain out of the atmosphere for good, which means the forest behind the credit has to remain standing long after the transaction is complete. For any buyer, this raises a defining question: What ensures that the forest endures?
![]()


-
Greenhouse Gases12 months ago
Guest post: Why China is still building new coal – and when it might stop
-
Climate Change12 months ago
Guest post: Why China is still building new coal – and when it might stop
-

 Greenhouse Gases2 years ago
嘉宾来稿:满足中国增长的用电需求 光伏加储能“比新建煤电更实惠”
-

 Climate Change2 years ago
嘉宾来稿:满足中国增长的用电需求 光伏加储能“比新建煤电更实惠”
-
Climate Change2 years ago
Bill Discounting Climate Change in Florida’s Energy Policy Awaits DeSantis’ Approval
-

 Renewable Energy9 months ago
Sending Progressive Philanthropist George Soros to Prison?
-

 Carbon Footprint2 years ago
US SEC’s Climate Disclosure Rules Spur Renewed Interest in Carbon Credits
-
Greenhouse Gases1 year ago
嘉宾来稿:探究火山喷发如何影响气候预测