
Geht man auf eine Wanderung in den Bergen, so schaut man sich meistens als ersten Schritt eine Karte an. Genauso ist es auch auf dem Ozean wichtig eine Karte zu haben. Nicht nur eine Karte, in der die Küsten und Inseln verzeichnet sind, sondern vor allem eine detaillierte Karte der Topografie des Meeresbodens. Während Mitte des 19. Jahrhunderts bis Anfang des 20. Jahrhunderts Tiefenmessung noch mit einem Gewicht am Ende eines langen Seils durchgeführt wurde, wird heute in den meisten Fällen das vom Kieler Dr. Alexander Behm 1913 patentierte Echolot genutzt.
Die beste und auch wissenschaftlich anerkannte bathymetrische Daten-Zusammenstellung erstellt GEBCO (englisch: General Bathymetric Chart of the Oceans). Der Datensatz basiert auf zusammengetragenen Daten aus Schiffs-Tiefenmessungen und wurde erstmals vor 120 Jahren der Öffentlichkeit vorgestellt. Heutzutage besteht dieser Datensatz weitestgehend aus so genannter prädizierter Bathymetrie. Das bedeutet, dass Satellitenmessungen gemacht werden, die im Anschluss mit von Schiffen gemessener Bathymetrie verifiziert und ergänzt werden können. Die Satelliten können über verschiedene physikalische Zusammenhänge aus der gemessenen Meeresspiegelhöhe ableiten, ob sich unter Wasser ein Seamount befindet. Dieses Verfahren ermöglicht zwar den gesamten Ozean abzubilden, ist aber sehr ungenau. Seamounts mit einer Größe unter 2 km können zum Beispiel nicht gemessen werden. Der GEBCO Datensatz wird mittlerweile jedes Jahr erneuert. Der einzige Nachteil ist, dass es ihn an detaillierten Metadaten mangelt. Metadaten sind Hintergrundinformationen, die zum Beispiel angeben, von welchem Institut oder auf welchem Schiff die zur Verfügung gestellten Daten gemessen wurden.
Da der Datensatz in großen Teilen auf Schiffsmessungen basiert, ist er stark abhängig von Schiffsrouten, zwischen denen sich teilweise sehr große Lücken befinden. Es sind erst circa 20% des Meeresbodens auf diese Weise vermessen (Mayer et. al 2018). Auf dieser Reise wollen wir einige dieser Lücken kartieren. Genauer gesagt, wollen wir sogenannte Seamounts kartieren.
Seamounts sind unter Wasser liegende Berge meist vulkanischen Ursprungs. Sie sind typischerweise kegelförmig, haben oft Krater, lineare Kämme oder flache Gipfel. Die Form ist häufig abhängig von der Entstehung des Seamounts. Geformt werden sie an Orten, an denen es tektonische Aktivitäten gibt, so zum Beispiel in der Nähe von ozeanischen Rücken, Inselbögen oder an Stellen, wo unter der tektonischen Platte heißes Material aus dem Erdmantel aufsteigt. Seamounts, die in der Nähe von Plattengrenzen entstehen, also dort, wo die Lithosphäre (die Erdkruste und der äußerste Teil des Erdmantels) noch frisch entstanden und dünn ist, sind meistens eher klein. Klein heißt in diesem Fall weniger als 2.5 km Höhe. Größere Seamounts mit 3-10 km Höhe entstehen häufig an Stellen, wo die Lithosphäre schon älter und dicker ist. Obwohl nicht genau bekannt ist, wie viele Seamounts es gibt, ist eines sicher: es sind sehr viele!
Aufgrund ihres vulkanischen Ursprungs sind Seamounts aus geologischer Sicht sehr interessant, da sie einen Einblick in die Zusammensetzung und die Temperatur des Erdmantels geben können. Auch für ozeanographische Betrachtungen sind Seamounts wichtig, da die Bathymetrie Einfluss auf Strömungen und Vermischungsprozesse hat. So können Seamounts als Barrieren fungieren, die verhindern, dass kaltes Tiefenwasser sich mit dem warmen Oberflächenwasser mischen kann. Zu guter Letzt sind sie auch Mittelpunkt eines diversen Ökosystems. Das liegt daran, dass nährstoffreiches Tiefenwasser an ihnen aufsteigt (diesen Prozess nennt man Upwelling) und somit die perfekte Grundlage für Fische und eine vielfältige Flora und Fauna bildet.
Jetzt wissen wir also, warum wir uns für Seamounts interessieren sollten, dass es unglaublich viele von ihnen gibt und, dass viele noch nicht kartiert sind.
Auf unserer geplanten Reiseroute kommen wir an einigen Stellen vorbei, wo Seamounts vermutet werden. Durch nur leichte Kursänderung ist es möglich über einige dieser Seamounts hinweg zu fahren und sie so mit dem Schiffsecholot zu vermessen. Dabei wird ein akustisches Signal zum Meeresboden gesendet, das am Boden reflektiert und dann bei Rückkehr zum Schiff wieder empfangen wird. So kann man durch die gemessene Zeit zwischen Senden und Empfangen den Abstand zwischen Schiff und Meeresboden messen. Dieses Prinzip wird auch hier auf der Maria S. Merian genutzt, mit dem Unterschied, dass nicht nur ein Signal, sondern ein ganzer Fächer von Signalen ausgesendet wird. Damit kann ein Streifen mit einer Breite sechs Mal so groß wie die Wassertiefe vermessen werden. In unserem derzeitigen Messgebiet beträgt die Wassertiefe 2500-3000 m was einem kartierten Streifen von 15 bis 18 km Breite entspricht.
Wir befinden uns im Moment in der Nähe des Mittelozeanischen Rückens, also an einem Ort, wo neue Lithosphäre entsteht. Wie wir bereits gelernt haben, werden die hier zu findenden Seamounts eher kleiner sein. In diesem Gebiet ist auch die Anzahl und Dichte der vorhergesagten Seamounts deutlich größer. Unser erster „überfahrende“ kleine Seamount, noch weit entfernt von dem Mittelozeanischen Rückens, zeigte einen flachen Gipfel mit einer ungefähren Höhe von 450 m. Mit 7.5 km breite sowie 8 km Länge war er fast rund und äußerst sehenswert. In wie weit dieser Seamount in Zukunft weiter erforscht wird, wird sich zeigen.

Auf dieser Fahrt kümmert sich Daniel und Marianne vom „Unterwegs“-Forschungsdaten Projektes der Deutschen Allianz Meeresforschung (DAM) um alles, was mit den Seamounts und dem Fächerecholot zu tun hat. Häufig werden Fächerecholot Daten auch nebenbei erhoben, wenn der Schwerpunkt der Ausfahrt nicht in der Vermessung des Meeresbodens liegt. Im Rahmen des Projekts arbeiteten beide daran, dass diese Daten erhoben und nach der Forschungsfahrt für die Wissenschaft verfügbar gemacht werden. Beide arbeiten für PANGAEA einem Datenrepositorium für Erd- und Umweltdaten.
English version:
If you go on a hike in the mountains, you usually look at a map as the first step. It is also important to have a map being on the ocean. Not only a map listing the coasts and islands, but above all a detailed map of the topography of the seabed. During the middle of the 19th century to the beginning of the 20th century, depth measurement was still carried out with a weight at the end of a long rope, but today the echo sounder patented by Dr. Alexander Behm from Kiel in 1913 is used in most cases.
The most accurate and scientifically recognized bathymetric data collection is produced by GEBCO (General Bathymetric Chart of the Oceans). The dataset is based on collected data from vessel depth measurements and was first presented to the public 120 years ago. Today, this data set consists largely of so-called predicated bathymetry. This means that satellite measurements are made, which can then be verified and supplemented with bathymetry measured by ships. The satellites can derive from the measured sea level via various physical relationships whether a seamount is underwater. This method allows us to map the entire ocean, but it is very inaccurate. Seamounts less than 2 km in size, for example, cannot be measured. The GEBCO dataset is now renewed every year. The only drawback is that it lacks detailed metadata. Metadata are background information indicating, for example, by which institute or on which vessel the data provided were measured.
Since the data set is largely based on ship measurements, it is highly dependent on ship routes, some of which have very large gaps. Only about 20% of the seabed have been measured in this way (Mayer et. al 2018). On this journey we want to map some of these gaps. More specifically, we want to map so-called seamounts.
Seamounts are submerged mountains of volcanic origin. They are typically conical, often with craters, linear ridges or shallow peaks. The shape often depends on the origin of the seamount. They are formed in places where tectonic activity occurs, such as near oceanic ridges, arch islands, or at places where hot material rises from the Earth’s mantle beneath the tectonic plate. Seamounts that form near plate boundaries, i. e. where the lithosphere (the Earth’s crust and the outer part of the Earth’s mantle) is still fresh and thin, tend to be rather small. Small in this case means less than 2. 5 km altitude. Larger seamounts with a height of 3-10 km often form in places where the lithosphere is older and thicker. Although it is not known exactly how many seamounts there are, one thing is certain: there are many!
Due to their volcanic origin, seamounts are very interesting from a geological point of view, as they can provide insight into the composition and temperature of the Earth’s mantle. Seamounts are also important for oceanographic observations, as bathymetry influences currents and mixing processes. Seamounts can act as barriers that prevent cold deep water from mixing with warm surface water. Finally, they are also the centre of a diverse ecosystem. This is because nutrient-rich deep water rises at their flanks (a process called upwelling) and thus forms the perfect basis for fish and a diverse flora and fauna.
So now we know why we should be interested in seamounts, that there are many of them out there, and that a lot of them have not yet been mapped.

On our planned itinerary we pass some places where seamounts are suspected. By only slight course changes it is possible to drive over some of these seamounts and to measure them with the ship echo sounder. An acoustic signal is sent to the seabed, which is reflected on the ground and then received when returning to the ship. Thus, the measured time between sending and receiving can be used to measure the distance between the ship and the seabed. This principle is also used here on the Maria S. Merian, with the difference that not only one signal, but a whole range of signals is emitted. This allows a strip with a width of six times as large as the water depth to be measured. In our current measuring area the water depth is 2500-3000 m which corresponds to a mapped strip of 15 to 18 km wide.
We are at the moment near the Mid-Oceanic Ridge, a place where new lithosphere is forming. As we have already learned, the seamounts to be found here will tend to be smaller. In this area, the number and density of predicted seamounts is also significantly higher. Our first mapped small seamount, still far from the Mid-Oceanic Ridge, showed a shallow peak with an approximate height of 450 m. With 7. 5 km wide and 8 km long, it was almost round and extremely worth seeing.
On this trip, Daniel and Marianne from the “Underway” research data project of the German Marine Research Alliance (DAM) will take care of everything that has to do with the seamounts and the Multibeam Echo Sounder. Frequently, Multibeam data is collected even if the focus of the research is not in the measurement of the seabed. As part of the project, Daniel and Marianne worked to collect these data and make them available to scientists after the research trip. Both are part of PANGAEA, a data repository for earth and environmental data.
Quellen/Sources:
- Gevorgian, J., Sandwell, D. T., Yu, Y., Kim, S.-S., & Wessel, P. (2023). Global distribution and morphology of small seamounts. Earth and Space Science, 10, e2022EA002331. https://doi.org/10.1029/2022EA002331
- Mayer, L.; Jakobsson, M.; Allen, G.; Dorschel, B.; Falconer, R.; Ferrini, V.; Lamarche, G.; Snaith, H.; Weatherall, P. The Nippon Foundation—GEBCO Seabed 2030 Project: The Quest to See the World’s Oceans Completely Mapped by 2030. Geosciences 2018, 8, 63. https://doi.org/10.3390/geosciences8020063
- Damaske, D. (2013): Bathymetry and short term changes of submarine seafloor structures in the area of the former Larsen ice shelf, north west Weddel Sea, Master thesis, http://hdl.handle.net/10013/epic.67a7bbd6-5ada-4764-a961-519e334d5c56
- https://oceanexplorer.noaa.gov/facts/seamounts.html


Color Theory
Look at this core below (figure 1) and describe the colors and values you see.
Fig. 1) A small section of core: 401-U1611B-41R-2W from expedition 401
Some dark gray stripes, some light gray stripes, maybe some yellowish tones in the lightest stripes. Congratulations! You are applying color theory. Color theory is about describing the behavior of colors, such as mixing, color contrast, and color harmony. How colors look together and how they’re made is the basics of color theory application. It is often used by painters, but color theory is not just applicable for artists. It is necessary for the scientific world, including analysis of the ocean floor. Color theory is used as an aid for the functional applications of color as a science. To practice color science we need to first understand the international standards and practices for imaging.
In color science, we use CIELAB which stands for Commission International de l’Eclairage, or the International Commission on Illumination. They provide the recommendations for lighting, vision, color, and imaging. L*a*b* (pronounced “L star”, “a star”, and “b star”) stands for the coordinates that define a color numerically. The a* and b* signals relate to color, or chromaticity. A is related to redness or greenness. This means that a positive “a*” value (+a*) is more red, and a negative “a*” value (-a*) is more green. B is related to yellowness or blueness, so +b* is more yellow, and -b* is more blue. The values of a* and b* range from -128 to 128. The L* is the lightness channel and represents a value (black to white). L* is on a scale from 0-100, 0 being the whitest white we perceive, and 100 being the blackest black. The color of something can be found in this represented 3-axis model (figure 2).
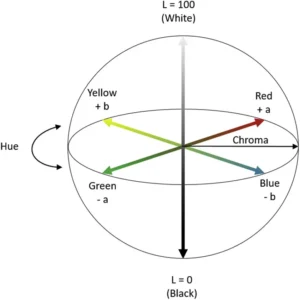
Fig. 2) model of the CIELAB color space using 3-axis
CIELAB is designed to approximate human vision and is great for perceiving small differences in color. Unlike RGB or CMYK, the colors CIELAB defines are not defined by a monitor or printer, but instead relate to the CIE standard observer. The standard observer is an averaging of the results of color matching experiments under that particular laboratory’s conditions to create a set base value for future reflectance recordings. For ocean coring, machines like the Section Half Multisensor Logger (SHMSL) use the CIELAB system for imaging cores.
The SHMSL

Fig 3.) photo of the Section Half Multisensor Logger on the JOIDES Resolution scanning an ocean core.
The SHMSL measures two things, spectral reflectance and magnetic susceptibility. These are used to create core descriptions. Since the SHMSL uses CIELAB, it requires a standard observer to set the “base” values. To set the standard observer, the SHMSL has a color reflectance control set (figure 4). The reflectance control set is similar to the ColorChecker used in professional photography (figure 5). These color patches have a known spectral reflectance value and are designed to mimic the values of natural objects, or in this case potential sediment and hard rock colors. The SHMSL is calibrated using this control set and a white standard. It then uses this recorded reflectance value to adjust future values.
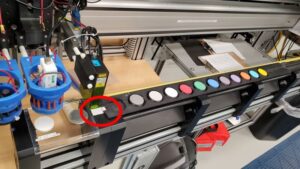
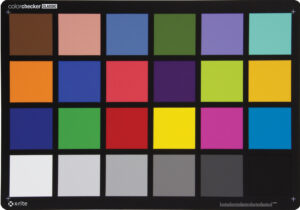
Fig. 4) A photo of the SHMSL color reflectance control set (left). Fig. 5) A photo of the Macbeth ColorChecker commonly used in photography (right).
Once calibrated and properly set up, the SHMSL is ready to read a core! Below is a finished reading of a core (figure 6). The three graphs at the bottom show the L*, a*, and b* values along the length of the core.
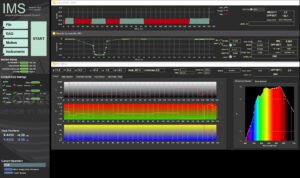
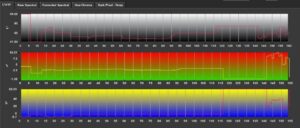
Fig. 6.1) Main IMS- SHMSL Data Acquisition Display (top). Fig 6.2) A zoomed in photo of the Main IMS- SHMSL Data Acquisition Display focusing only on the L*a*b* graph (bottom).
The numbers at the bottom of each L*, a*, and b* graphs match with the length of the core in cm. For example, at 20cm this reading shows that the core had a L* value above 80, an a* value around -30, and a b* value of around 47. This means the color was lighter in value, more green than red and more yellow than blue. A color with these values looks roughly like this (figure 7):
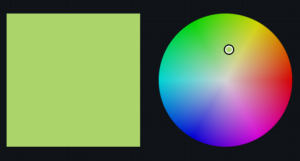
Fig. 7) A photo of a pale, yellow-greenish color.
Machines like the SHMSL are important for identifying colors on ocean cores. As we humans age, the differences in color vision grow wider due to the yellowing of our lens over time. A person in their 50s will see colors in a more yellow tint than someone in their teens due to aging. The SHMSL sets a standard for the lighting and imaging in the laboratory, narrowing the divide to provide the most accurate reading of color on the core possible.
Applying to the core
So now we know how to read the machine, but what does the color of an ocean core actually tell us? Color differences are used to quantify how an object’s color can change over time from light exposure, heat, and humidity. In the case of ocean cores, “spectral data can be used to estimate the abundances of certain compounds,” (TAMU). This means, the light values of a core may tell us about potential organic content. For example, green cores may be an indication of glauconite (depending on location and geological time) which could indicate an ancient shallow marine environment. Look back at figure one. Based on what we know of this area of the ocean floor, this type of color contrast and coloration is a clear example of a dolomotisation sequence (the formation of dolomite). Colors are powerful tools used for studying our oceans, and our oceans are full of colorful knowledge waiting for those with eyes to see it.
Sources:
- Berns, R. S. (2016). Color science and the visual arts a guide for conservators, curators, and the curious. Los Angeles Getty Conservation Institute.
- TAMU. (2026). GCR Section Half Multisensor Core Logger (SHMSL) User Guide. Atlassian.net; Texas A&M University. https://tamu-eas.atlassian.net/wiki/spaces/LMUG/pages/7341017839/SHMSL+User+Guide. Updated 06 March 2026
- Erick Bravo, Imaging Specialist for X401 aboard the JOIDES Resolution. Accessed 28 June 2026.
- Ly, Bao & Dyer, Ethan & Feig, Jessica & Chien, Anna & Bino, Sandra. (2020). Research Techniques Made Simple: Cutaneous Colorimetry: A Reliable Technique for Objective Skin Color Measurement. The Journal of investigative dermatology. 140. 3-12.e1. 10.1016/j.jid.2019.11.003.
- Macbeth ColorChecker. (2026). Imatest.com. https://www.imatest.com/wp-content/uploads/2022/01/msccc_colorchecker_classic_front.jpg
- Banaś, W. (2024). Convert LAB to RGB – colordesigner.io. Colordesigner.io. https://colordesigner.io/convert/labtorgb
Image sources:
Figure 1: Source 3
Figure 2: Source 4
Figure 3-4,6: Source 2
Figure 5: Source 5
Figure 7: Source 6
Written by OCA 2026 Mentor, Kellan Moss
By Naomi Krauzig (GEOMAR)
As the research vessel METEOR heads north toward Germany, the CTD Lab has become quiet.
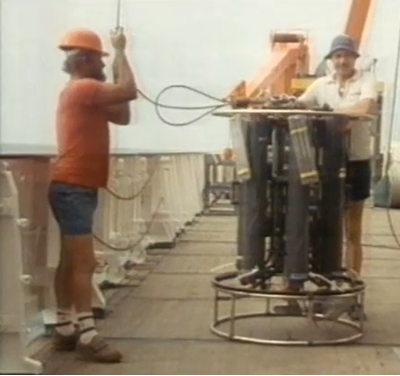
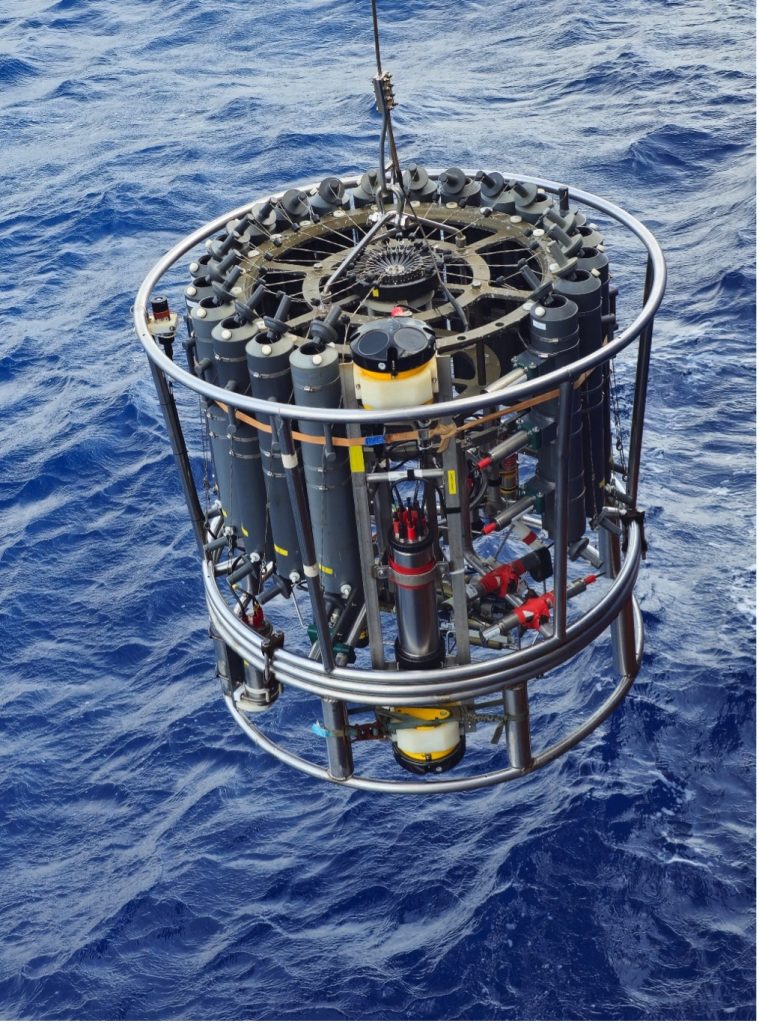
For the past four weeks, the CTD rosette (named after the three core variables it measures: conductivity, temperature, and depth) has been one of the busiest instruments on board. Day and night, it disappeared beneath the waves and returned with information about the entire water column.
Now the final station has been completed and the CTD rosette has been stored away for the last time. It feels like the right moment to reflect on a tool that has accompanied generations of oceanographers -and on a ship that has done the same.
Introduced in the 1970s, Conductivity-Temperature-Depth (CTD) systems revolutionized ocean observation by providing continuous measurements throughout the water column. When METEOR III entered service in 1986, the CTD was already the workhorse of physical oceanography. In the 1990s, it gained a trusted companion: the Lowered Acoustic Doppler Current Profiler (LADCP), capable of measuring ocean currents from the surface to the seafloor.
Aboard METEOR, the CTD rosette now also carries a suite of additional sensors measuring oxygen, chlorophyll, turbidity, photosynthetically active radiation, nitrate, and even particles and plankton through an Underwater Vision Profiler. At the same time, its Niskin bottles collect seawater samples for analyses of oxygen, nutrients, salinity, and other properties, providing a detailed picture of the water column.
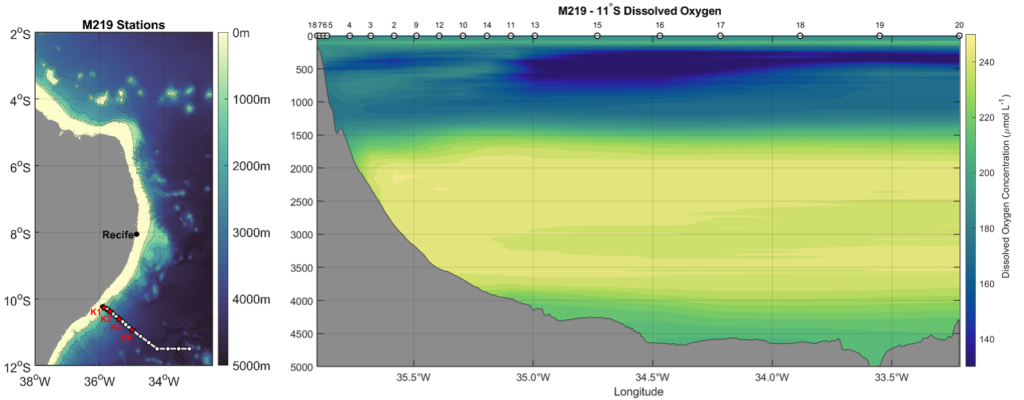
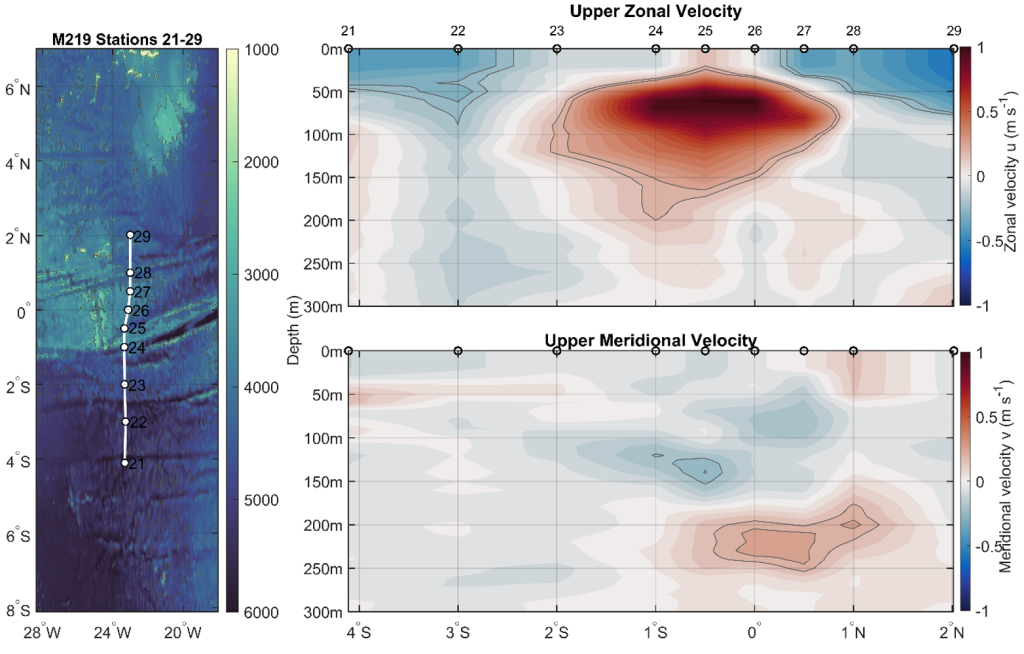
During M219, this classic CTD/LADCP system helped us reveal some of the hidden “highways” of the tropical Atlantic. Along the 11°S section off Brazil, a key location for monitoring the Atlantic Meridional Overturning Circulation, CTD measurements identified distinct water masses through their temperature, salinity, and oxygen signatures. At the same time, the LADCPs captured the currents carrying them: the warm, northward-flowing North Brazil Undercurrent in the upper ocean and the colder, southward-flowing Deep Western Boundary Current nearly two kilometers below.
Further north, along 23°W, we crossed the equator and encountered one of the strongest subsurface currents in the world ocean: the Equatorial Undercurrent. Hidden just beneath the surface, this powerful eastward-flowing jet transports enormous amounts of water, heat, oxygen, nutrients, and carbon across the Atlantic: roughly one hundred times the discharge of the Amazon River!
While these observations allow us to investigate water masses, currents, and the circulation of the tropical Atlantic, they also carried an additional meaning for many on board.
For four decades, CTD rosettes have been lowered from the deck of METEOR III in every ocean of the world, helping scientists understand complex ocean processes, monitor changes, and train generations of oceanographers. During more than 11,940 days at sea, thousands of stations have been completed from her deck. Countless students, technicians, crew members, and scientists have contributed to these observations, and many have built their careers around the data collected aboard this vessel.
To take part in the final cruise -and the final CTD cast- of METEOR III was a privilege. Over the course of this voyage, it became impossible not to notice the connection many people have with this vessel. For some, METEOR has been a second home for years. Colleagues became lifelong friends, sometimes even family, and countless memories were made during deployments, watches, and transits at sea. The research vessel, the discoveries, and even the familiar CTD rosette hold a special place in many hearts.
As we pack the last equipment and the laboratories become emptier, it is difficult not to wonder what comes next. METEOR IV will soon continue the tradition, equipped with new capabilities and ready to tackle the scientific questions of the coming decades. New technologies will undoubtedly expand how we observe the ocean, yet some traditions are likely to endure.
https://www.oceanblogs.org/m219/2026/06/27/no-cruise-without-a-ctd/
By Joelle Habib (Laboratoire d’Océanographie Villefranche)
When I was a kid, I wanted to be a photographer. I still do, actually. But somewhere along the way, science intervened, and it gave me something I never expected: the chance to be an underwater photographer. Not the National Geographic kind who chases polar bears or waits weeks for a penguin to do something interesting. My subjects are smaller. Much, much smaller. I get to photograph the invisible life of the deep ocean, the tiny animals and sinking particles that most people never know exist. And the camera I use to do it descends to 6000 meters below the surface.
This instrument is called the UVP, or Underwater Vision Profiler. On this cruise, we deployed a UVP6 attached to the CTD rosette, profiling down to 4000 meters depth. The instrument activates automatically once its pressure sensor detects it is moving downward, takes up to 20 pictures per second all the way to the bottom of the cast. But before we talk about what the UVP gives us and why it matters, we need to talk about what it actually photographs: zooplankton and particles.
If you have ever watched SpongeBob SquarePants, you already know a zooplankton. Sheldon J. Plankton, the tiny villain who is perpetually trying to steal the Krabby Patty formula, is one. And funnily enough, the most abundant zooplankton across all the world’s oceans, is indeed this small crustacean: the copepod.
Here is the basic idea: a plankton is any organism that drifts with the ocean currents rather than swimming against them. If it photosynthesizes like a plant and contains chlorophyll pigments, it is a phytoplankton. If it is an animal, it is a zooplankton. A jellyfish is a zooplankton, just a very large one. Zooplankton graze on phytoplankton, on each other, and on anything small enough to eat. Now for the process that connects all of this to climate, to carbon, and to why we are out here on a research vessel in the middle of the equatorial Atlantic: the biological pump.
The biological pump is the ocean’s mechanism for pulling carbon out of the atmosphere and locking it away in the deep sea. Here is how it works: phytoplankton at the surface absorb CO₂ from the atmosphere and convert it into organic matter through photosynthesis. When they die, or when zooplankton eat them, defecate, excrete, and die themselves, all of that organic carbon does not simply disappear. It becomes marine snow! Yes, it snows in the ocean!!! Marine snow consists of a continuous rain of particles, aggregates, fecal pellets, shed exoskeletons, … Every flake of marine snow is a fragment of life that once existed at the surface, now on a one-way journey into the deep. This is the gravitational pump, one of the most important carbon sinks on Earth, and it is one of the pumps that the UVP was built to observe.
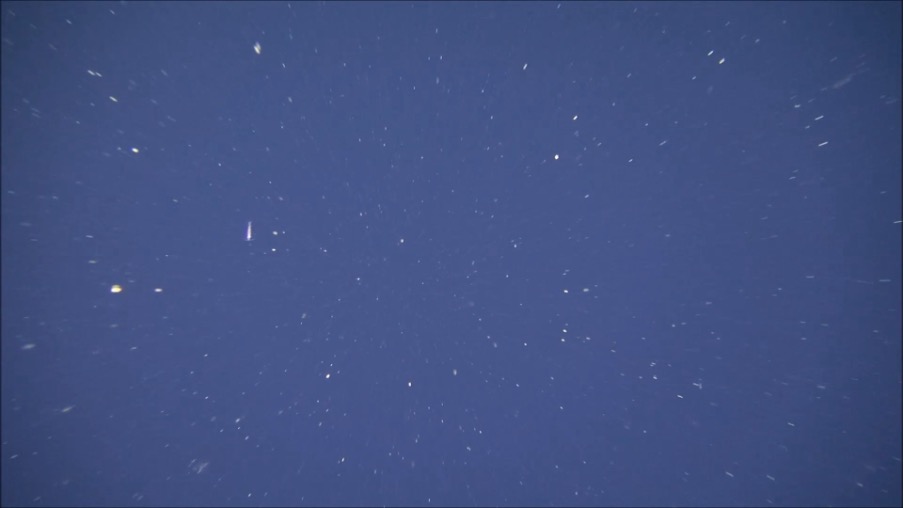
Marine snow seen by PELAGIOS (Pelagic In situ Observation System) in the Tropical Atlantic; 23°W; 100 m depth. Photo Credit: Henk-Jan Hoving
So why image and count particles rather than simply collecting water samples or relying on sediment traps? Because the abundance and size distribution of marine particles are two of the major factors controlling biological carbon sequestration in the ocean, and traditional methods cannot capture them at high resolution throughout the water column. Vertical profiles of particle images can reveal the processes that determine particle size, type, and distribution, and combined with information on carbon content and sinking velocity, they provide high-resolution information on how the biological pump operates at depth. The UVP allows for the remote collection of large datasets on particle abundances and their size distributions, enabling much higher spatial and temporal resolution than traditional methods. But particles are only one part of the story, the UVP also tracks zooplankton and their daily migrations: every night, zooplankton rise from the deep to feed near the surface, then sink back down before dawn, actively carrying carbon into the deep ocean in their own bodies. Without imaging tools like the UVP, this active carbon flux is nearly impossible to quantify.
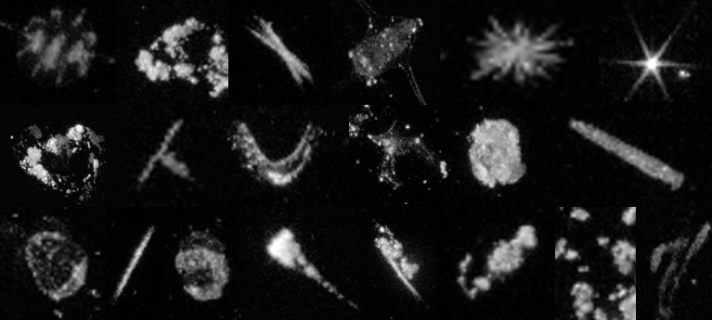
Each image you see here was taken in complete darkness, somewhere between the ocean surface and 4000 meters below. The UVP6 illuminates a tiny volume of water, with a single red flashing light, capturing only the particles and organisms that happen to drift through that small window at that exact moment.
The instrument captures everything larger than 100 micrometers, roughly the width of a human hair. In the images you will see two types of things: fuzzy, irregular blobs of varying sizes: Marine snow aggregates. And more defined, structured shapes, sometimes with appendages, antennae, or transparent shells. Those are the zooplankton.
Every image is a small portrait of a world that already existed long before we had the tools to see it. I am so lucky I am able to see parts of that hidden life in this lifetime.


-
Climate Change11 months ago
Guest post: Why China is still building new coal – and when it might stop
-
Greenhouse Gases11 months ago
Guest post: Why China is still building new coal – and when it might stop
-

 Greenhouse Gases2 years ago
嘉宾来稿:满足中国增长的用电需求 光伏加储能“比新建煤电更实惠”
-

 Climate Change2 years ago
嘉宾来稿:满足中国增长的用电需求 光伏加储能“比新建煤电更实惠”
-

 Renewable Energy8 months ago
Sending Progressive Philanthropist George Soros to Prison?
-
Climate Change2 years ago
Bill Discounting Climate Change in Florida’s Energy Policy Awaits DeSantis’ Approval
-

 Carbon Footprint2 years ago
US SEC’s Climate Disclosure Rules Spur Renewed Interest in Carbon Credits
-
Greenhouse Gases12 months ago
嘉宾来稿:探究火山喷发如何影响气候预测