

Limiting warming to 2C above pre-industrial temperatures may not be enough to prevent “extreme global climate outcomes”, according to research published in Nature.
The authors simulate climate extremes – such as drought in breadbasket regions and flooding in populated areas – under a 2C warming scenario using a range of different global climate models.
They find that the “worst-case” model projections in a 2C warmer world are often more severe than the “average” scenarios in a 3C or 4C warmer world.
An author on the study tells Carbon Brief that, for policymakers planning around risk, it is “really important” to account for these potential extremes at 2C.
The findings are “sobering” and “demonstrate that the risks at 2C of global warming may be significantly higher than previously thought”, according to one scientist who was not involved in the study.
He adds that the methods used in the research would “offer a very useful contribution” to any future “global assessment of avoidable climate-change risks”.
High-risk scenarios
As the planet warms, climate extremes such as floods and droughts are becoming more intense and frequent. For policymakers to effectively plan and adapt to upcoming changes, they need to understand how severe these events could become.
Scientists routinely use global climate models to simulate how extremes may change over the coming decades. One well-established way to present these results is to run simulations using multiple models, then take the average of these results.
This average is known as the “multimodel mean”. Model results typically cluster around the mean, giving scientists more confidence in these results, but there are often also individual projections that sit notably higher or lower.
Prof Erich Fischer is a lecturer in environmental systems science at ETH Zurich and an author on the paper. He tells Carbon Brief that focusing on the multimodel mean is a “very valuable” communication tool for climate scientists, providing a “simpler” message than showing the full range of results.
For example, he tells Carbon Brief that the Intergovernmental Panel on Climate Change (IPCC) – the world’s most authoritative source on climate change – uses the multimodel mean to produce many of its maps.
However, Fischer warns that from a “risk perspective”, focusing solely on the multimodel mean could give a “misleading picture”. For example, he adds, the changes that specific regions may see could be “much, much higher” than the global average.
He tells Carbon Brief that for policymakers planning around risk, it is “really important” to account for more extreme cases too.
To demonstrate this, the study authors select 42 models from the Coupled Model Intercomparison Project 6 (CMIP6). These are the models that are used most widely in the latest set of IPCC reports.
Their approach is illustrated in the diagram below. Note that this illustration is not based on real model runs, but is intended to give an example of what a set of results could look like.
The beige strip on the right shows the spread of results, where each horizontal bar indicates a different model. The models simulating the “worst-case” outcomes (red lines) are at the top and those showing the “best-case” climate outcomes (blue lines) are at the bottom. The majority of models are clustered towards the centre of the bar, close to the multimodel mean (thick black line).
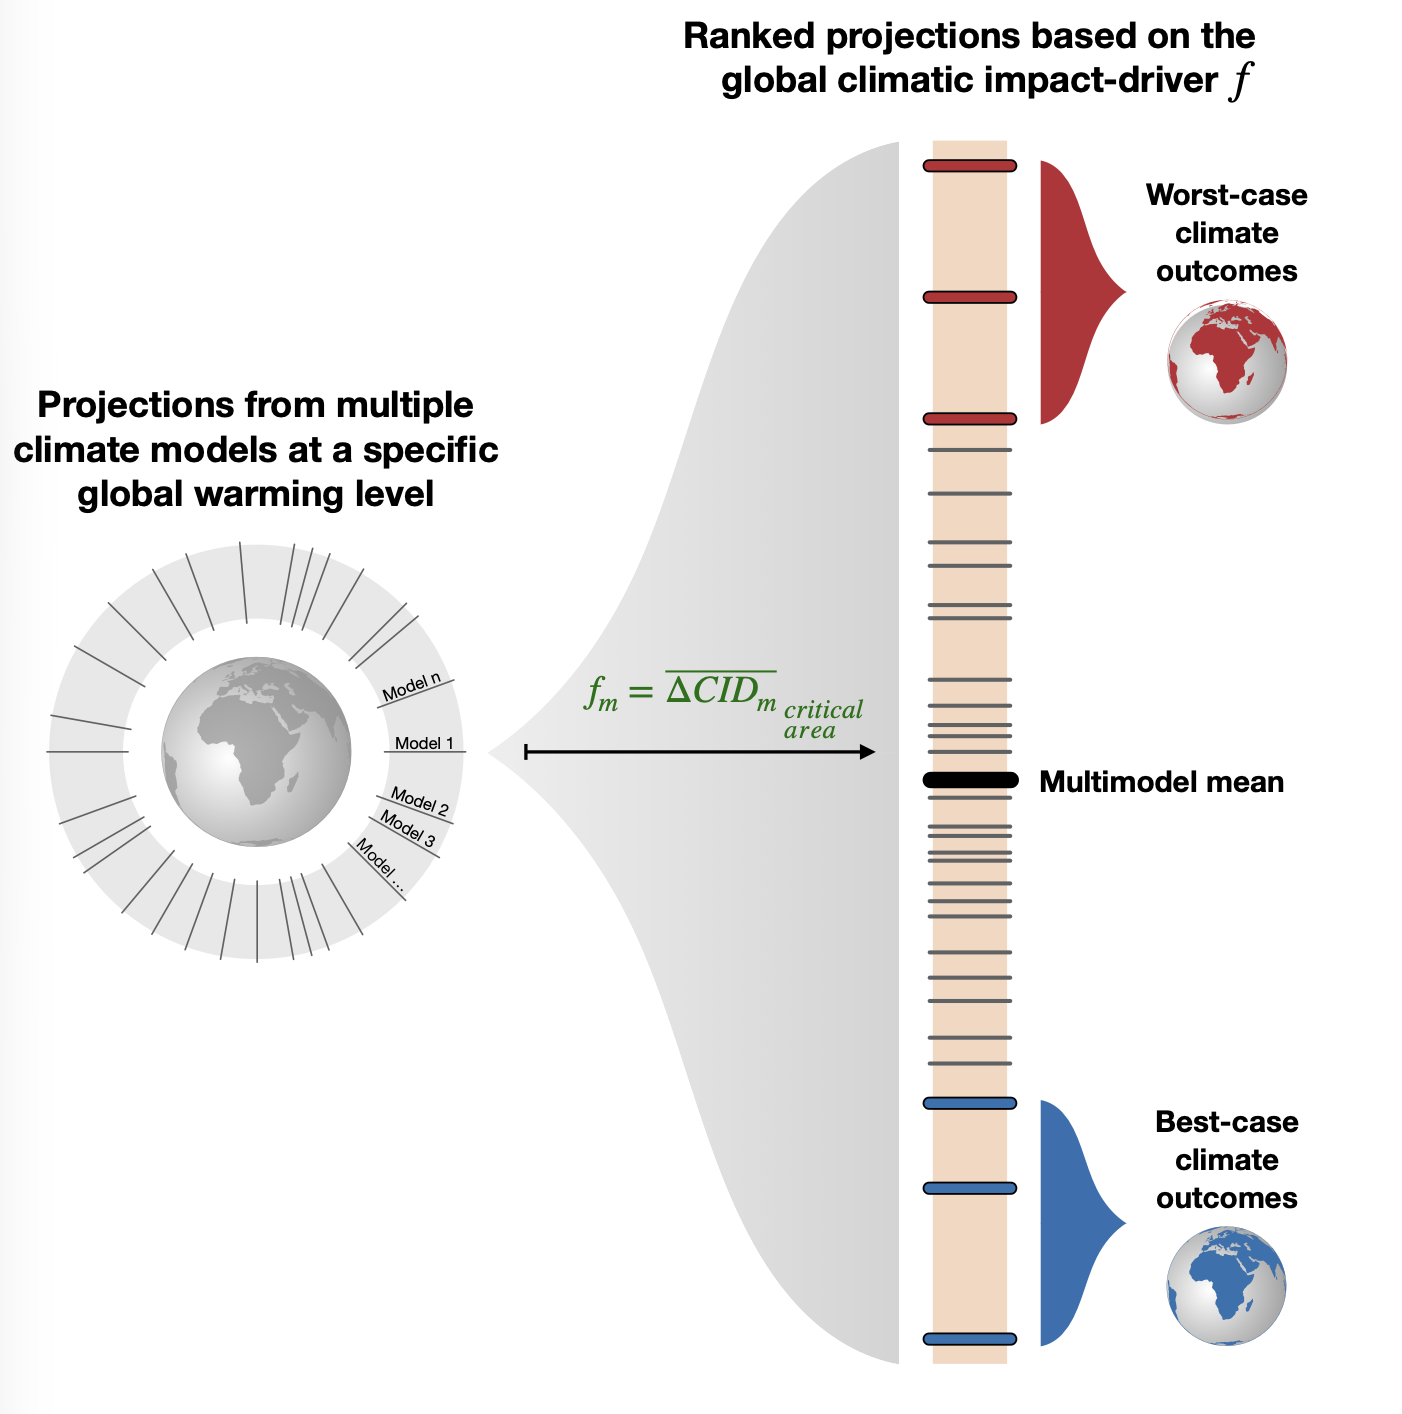
The authors selected three types of events to analyse:
- Rainfall extremes in highly populated areas, which may induce flooding
- Concurrent droughts in global breadbaskets, which threaten food security
- Fire weather extremes across the world’s forests
For each event type, the authors assess the spread of results. They rank the model outputs by the severity of each type of event and compare these to the multimodel mean at different levels of warming – including 2C, 3C and 4C above pre-industrial temperatures.
In many instances, the “worst-case climate outcomes” in a 2C world are more severe than the multimodel mean in a 3C or 4C world.
Prof Rowan Sutton, director of the Met Office Hadley Centre, who was not involved in the study, tells Carbon Brief that the study’s findings are “sobering”. He adds that the paper “demonstrates that the risks at 2C of global warming may be significantly higher than previously thought”.
In its latest assessment report, the IPCC projected that, under current policies, the world could reach 2C of warming between 2037 and 2084, with a central estimate of 2052. (For more on when the IPCC says warming thresholds will be passed, read Carbon Brief’s explainer.)
Breadbasket drought
The analysis of drought in key breadbasket regions provided the “most striking results”, Dr Emanuele Bevacqua, a researcher at the Helmholtz Centre for Environmental Research and lead author of the study, tells Carbon Brief.
To assess the worst-case scenario, the authors simulated drought frequency in “critical breadbasket areas across the world”, he explains.
These are the regions where most of the world’s maize, wheat, soybean and rice is grown, including regions of northern and southern America, Europe, south-eastern Asia and Australia.
The spread of model results is shown below.
The vertical bars indicate the percentage change in average drought frequency between a pre-industrial and 2C warmer world, where more-frequent drought is at the top of the bar and less-frequent drought is at the bottom.
On the left bar, each horizontal line indicates one model. The models showing the “worst-case climate outcomes” are highlighted at the top of the bar. On the right bar, the horizontal bars show the multimodel means for warming levels of 2C, 2.5C, 3C and 4C.
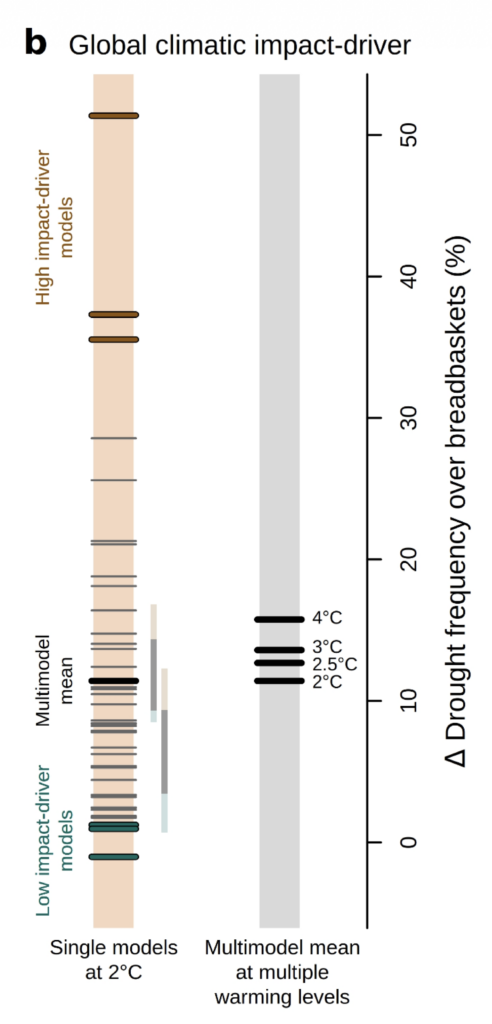
The percentage change in drought frequency in key breadbasket regions between a pre-industrial and 2C warmer world. On the beige bar (left), each horizontal line indicates a model. On the grey bar (right), the horizontal bars show the multimodel means for warming levels of 2C, 2.5C, 3C and 4C. Source: Bevacqua et al. (2026)
They find that 10 of the 42 models simulate a level of drought frequency at a 2C warming level that is higher than the multimodel mean at 4C warming.
(Some models also project a lower level of drought frequency at 2C warming than the multimodel mean. However, the focus of the study is to capture the most severe risks, which are particularly relevant for risk management.)
Bevacqua tells Carbon Brief that this result “makes it very clear that even if we stop [warming] at 2C, we cannot rule out the fact that we might end up in a worst-case outcome”.
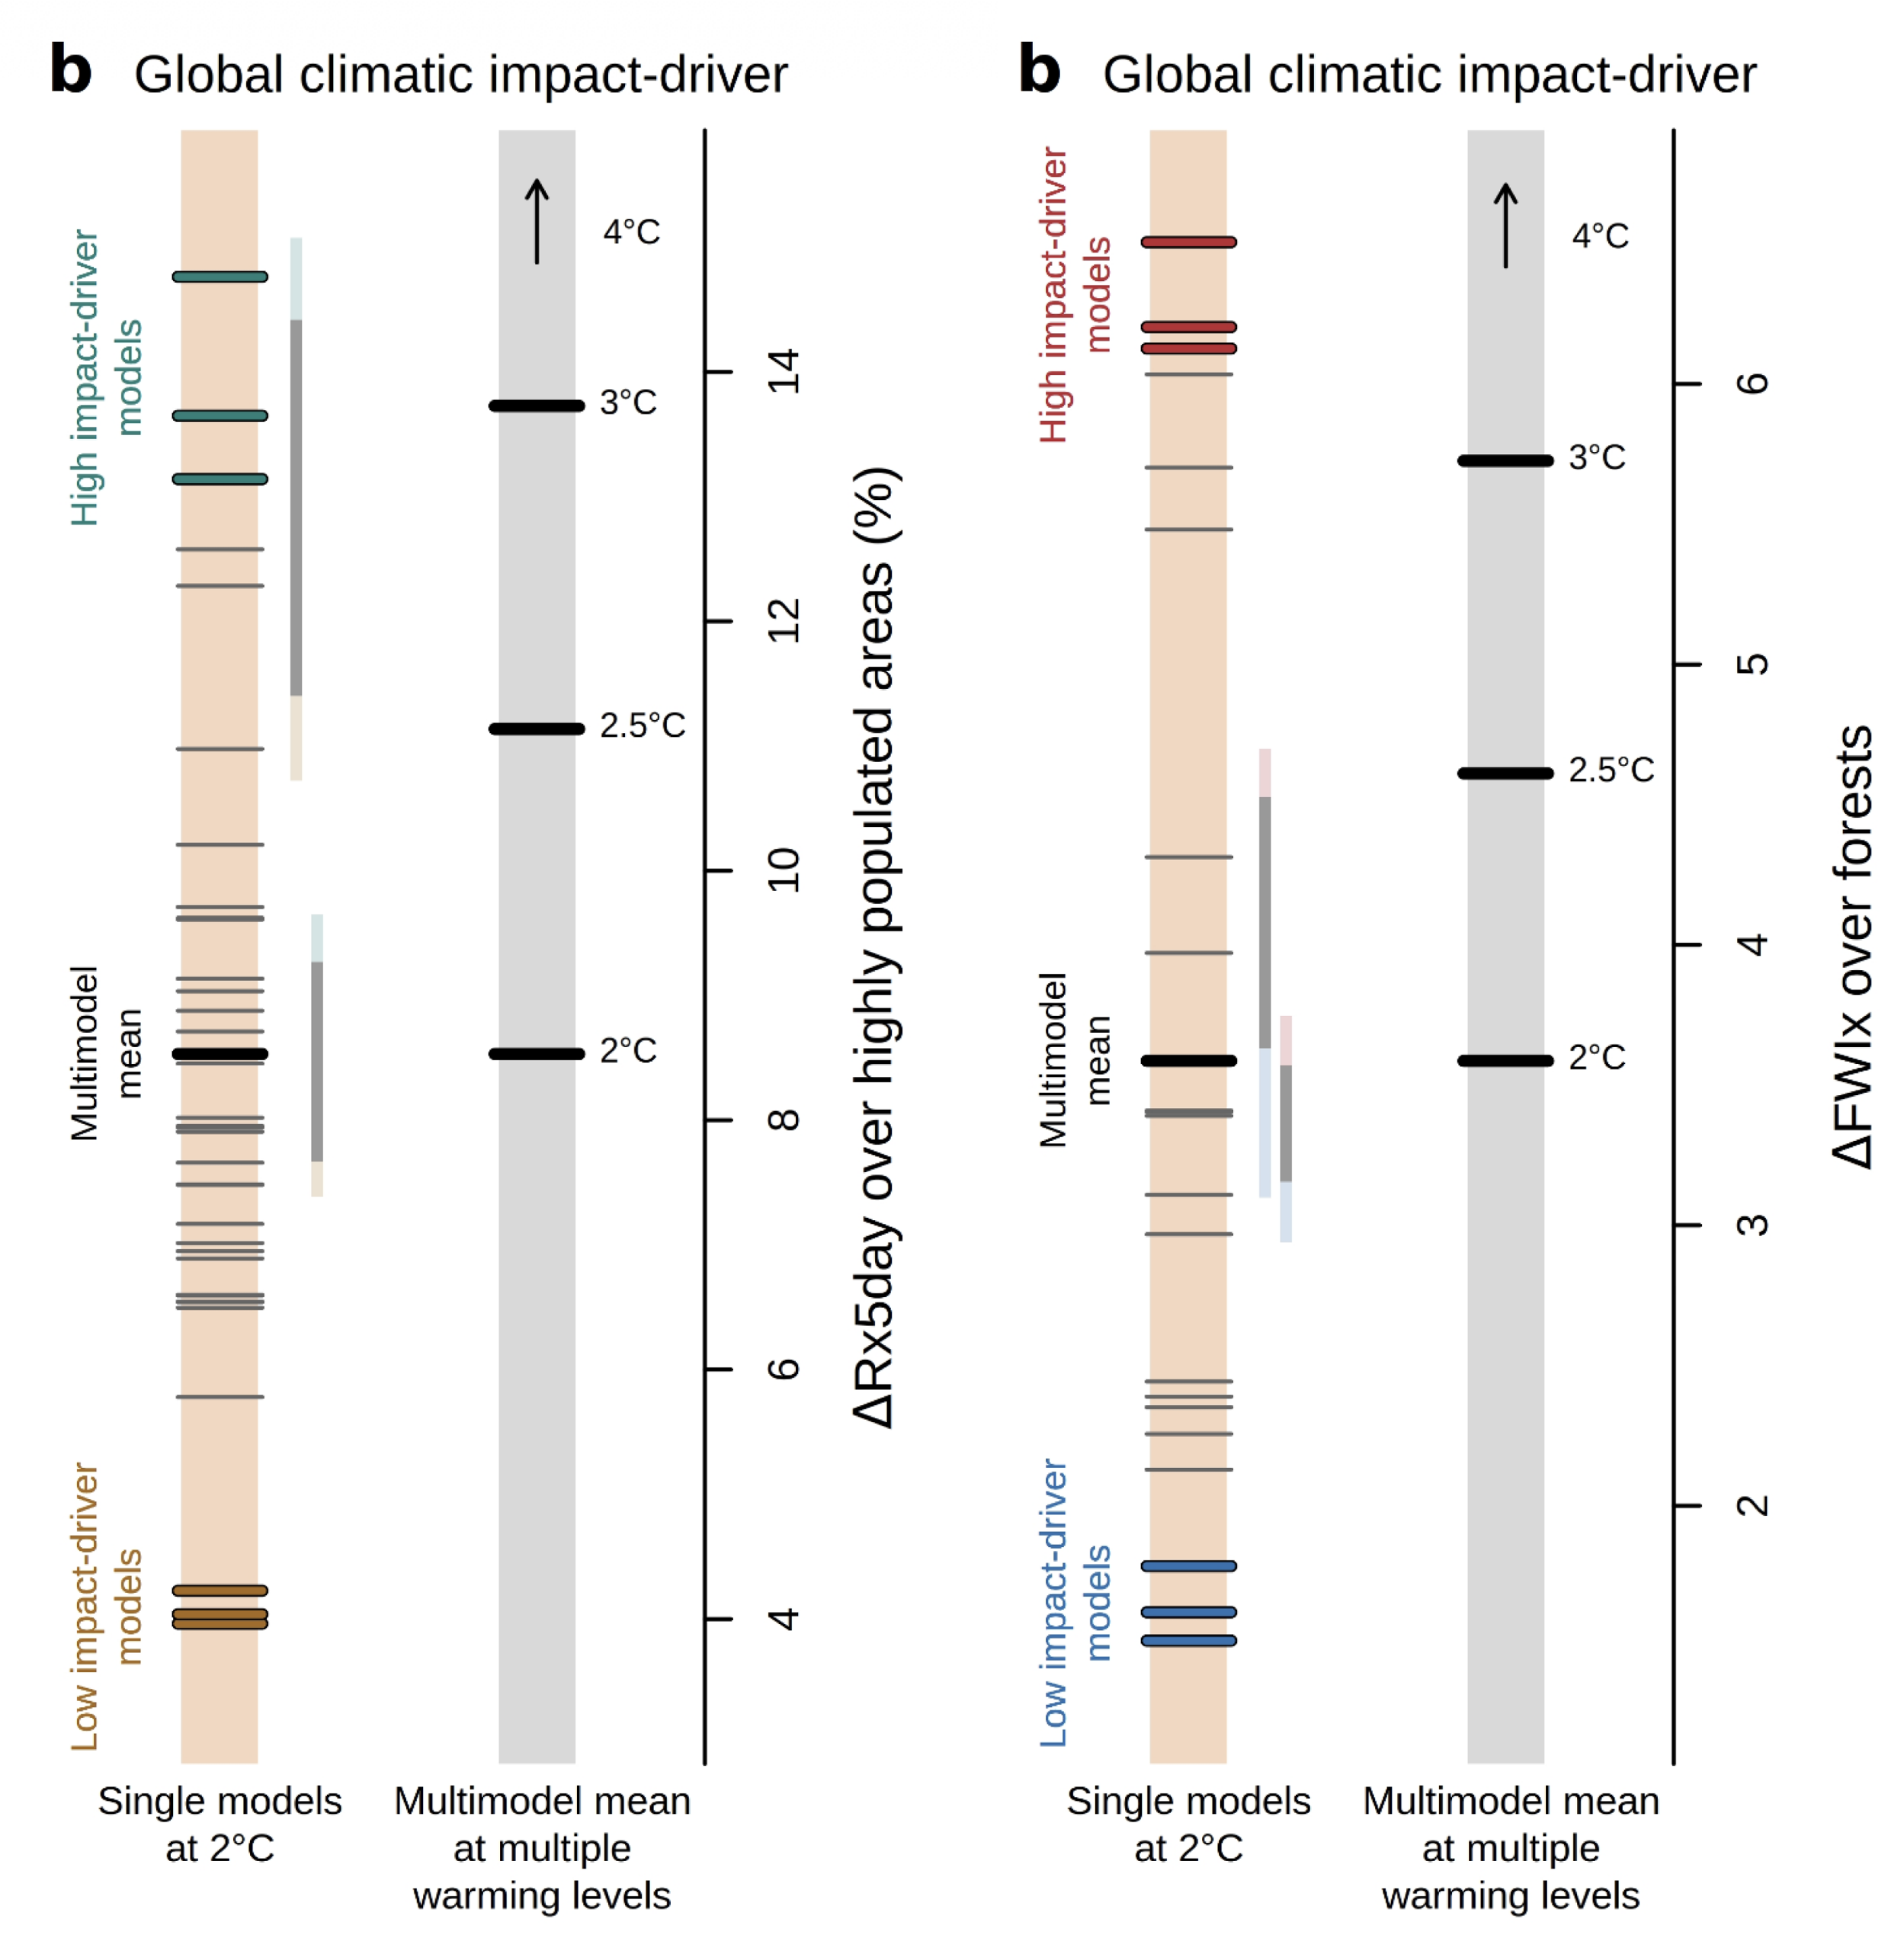
The authors also conduct their analysis for extreme rainfall in populated regions. Although they find a wide range of model results, none of the simulations of extreme rainfall at 2C are higher than the multimodal mean at 4C.
Meanwhile, analysing the risk of wildfires to the world’s forests reveals that four of the models simulate more severe fire risk at 2C than the multimodel mean at 3C and none simulate more severe fire risk at 2C than at 4C.
The spread of model results for rainfall (left) and wildfire (right) are shown below.
Dr Karen McKinnon is an associate professor in statistics and the environment at the University of California, Los Angeles. McKinnon, who was not involved in the study, tells Carbon Brief that the study highlights that “risks are obscured when considering averages across multiple climate models”.
‘Worst-case scenarios’
The authors find that the ranking of models was different across the three case studies. In other words, the same models did not produce the “worst-case” climate outcomes in every type of event.
When assessing the impact of future extremes, the findings emphasise the need to select models that “sample the full range of possible climate outcomes”, the paper says. It adds:
“Currently, large-scale initiatives such as the latest protocol of the Inter-Sectoral Impact Model Intercomparison Project (ISIMIP) rely on a limited subset of climate models that likely omits the best- and worst-case climate models.”
ISIMIP is a global modelling effort to project the impacts of climate change across different sectors. Bevacqua notes:
“[O]ur results suggest that ISIMIP-based simulations probably underestimate the range of possible global impacts at a fixed global warming level of +2C.”
He adds:
“This is worrying and calls for new approaches that can somehow lead to accounting for this.”
The study also shows that many “best-case” model outcomes for a 2C world project a lower level of risk than the multimodel mean. However, Fischer notes that “even the best-case scenario” shows that extremes will become more severe with warming.
Fischer says that the study authors are not “doomscrolling” and notes that “landing somewhere in the middle is still the more likely outcome”. However, he emphasises the importance of considering the high-impact model outcomes for planning around risk.
Communicating risk
Climate scientists and policymakers have been discussing how best to assess and communicate climate risk for decades.
Dr Robert Vautard – senior climate scientist at France’s National Centre for Scientific Research at Institut Pierre-Simon Laplac, who was not involved in the study – tells Carbon Brief that the study provides “very insightful examples of outcomes for communicating risks”.
However, he questions whether the “global indices” used in this study would be relevant for developing “regional” adaptation plans, noting that worst-case impacts in the model “may not be the most problematic locally”.
Last month, a group of leading climate scientists published a comment article – also in Nature – calling for a global climate risk assessment that identifies the “worst-case scenarios” and helps societies to prepare for them.
The article says:
“Global assessments made by IPCC have played, and continue to play, a crucial part in assessing the evidence about climate change. But the IPCC produces science assessments, rather than risk assessments. Its main focus has been to set out what is known with the greatest confidence.
“A climate risk assessment offers different information – it makes clear the scale and severity of risks, to inform judgments about the priority to be given to avoiding or mitigating them.”
Sutton, the Hadley Centre director, is an author on the article. He tells Carbon Brief that “from a policy and decision-making perspective, climate change is a problem of risk assessment and risk management”.
He says that the methods used in this study “offer a very useful contribution to a global assessment of avoidable climate-change risks”.
The post Limiting global warming to 2C would not ‘rule out’ extreme impacts appeared first on Carbon Brief.
Limiting global warming to 2C would not ‘rule out’ extreme impacts

Climate Change
Commencement of NSW Forestry assessment a ‘chance to fix a broken system’ and deliver urgent forest protection
SYDNEY, Friday 18 September 2026 — In response to the Federal and NSW government’s announcement to commence an assessment of NSW forestry under the new national nature laws, Adele Chasson, Nature Policy Lead at Greenpeace Australia Pacific said:
“This is the Federal Government’s chance to fix a broken system that has enabled the destruction of NSW’s precious forests for far too long.
“Native forest logging continues to smash threatened species habitat. In NSW, it is pushing unique wildlife like koalas, greater gliders and glossy black cockatoos towards extinction. The state-owned logging agency has a disastrous record of environmental damage and breaches.
“The Regional Forest Agreement (RFA) system has failed, allowing the industrial logging of special forests for decades across Australia with no oversight. Thankfully, the Federal Government has started the process to finally remove the logging industry’s exemption from national nature laws.
“It’s time for the Federal Government to deliver the protection that forests urgently need, and that Australians overwhelmingly want. The Government must ensure a thorough assessment of the devastating impacts of native forest logging in NSW, and establish strong environmental rules that states must follow.
“These forests have been cared for by First Nations people for tens of thousands of years. They are some of the most biodiverse on the planet, store carbon, clean our air and water. It’s critical we protect them.”
ENDS
Media contact:
Kate O’Callaghan on 0406 231 892 or kate.ocallaghan@greenpeace.org
What happens when a love of marine life meets a playful imagination?
Sydney artist, illustrator and children’s author Sha’an d’Anthes, better known as Furry Little Peach, has teamed up with Greenpeace to create Happy Ocean Happy Planet: a joyful celebration of the extraordinary creatures that call our oceans home.
Sha’an felt inspired to create an illustration celebrating the beauty and resilience of marine life. Its hopeful message, A Happy Ocean is a Happy Planet, sparked a special collaboration with Greenpeace and a limited-edition t-shirt designed to help protect the oceans that inspired it.
The exclusive Furry Little Peach tee is available as a gift to new regular Greenpeace donors who give $30 or more and make at least three donations. By becoming a regular giver, you’ll help Greenpeace campaign for ocean protection.

ARTIST INTERVIEW: Sha’an d’Anthes (Furry Little Peach)
Sha’an shares the story behind the artwork, the local marine creatures featured in the design and why hope can be such a powerful force for action.
Hi Sha’an! Can you tell us a little about yourself and what you do?
My name is Sha’an d’Anthes, I also go by the pseudonym Furry Little Peach and I’m an illustrator, artist and children’s author based in Sydney, Australia. I love creating joyful, vibrant and nostalgic art that looks at the world through the lens of childlike wonder.

What do you love about drawing animals and nature?
I love all of the different shapes, colour and narrative you get to explore when drawing animals and nature. I’m also a city-slicker these days, and so I think that my work is a sort of escapism (for myself and hopefully for my audience).
How did the Greenpeace collaboration come about?
I went to the premiere of David Attenborough’s documentary Ocean, and felt compelled to create something to share the message of the film. This t-shirt is actually based off of that illustration including the tagline in I included when I shared it “A Happy Ocean is a Happy Planet”. I’m so grateful Greenpeace approached me for the project – it was a blast.
Where did you start when creating the Happy Ocean Happy Planet design?
The Happy Ocean tee starts the same as all of my work – with a brainstorm/braindump and really loose concept sketches.
How did you choose the animals for the illustration?
I actually asked Greenpeace to help me with the research of local marine life and they were so accommodating. They very quickly delivered me a huge list of local species of fish, mammals and coral and I just went through and looked up each creature and curated a little group of sea life that I thought would look sweet together – a mix of sizes, types, colours, textures and shapes.
What did you use to create the artwork?
So much of my work is traditional, but when it comes to things like t-shirts I always use digital drawing programs because I like to draw each colour in a separate layer which requires me to jump in and out of layers because it allows me to control colour and printing. When working digitally I always sketch in Procreate (an Australian digital art app), and then with this project I created final art in Adobe Fresco because it called for a vector graphic (an image that can be blown up to any size).
Do you have a favourite creature in the design?
I love painting Humpback Whales and always have, but I also have a soft spot for the sweet little Jelly Blubber jellyfish.
What did you want people to feel when they saw the artwork?
I specifically wanted to focus on the outcome that all of us want to see – a happy, thriving ocean where creatures are given the time and space to balance themselves. I feel that even when tackling tough subjects, leaning into hope is my natural inclination. As long as we have hope that things can be better, we will continue to take action.
What was the most fun part of creating it?
I actually documented the entire process of this project in a studio vlog on YouTube – and you can see how much fun I’m having doing final art jumping between layers and building the image. I had just come off completing final art for two books which are multi-year long projects, so being able to do a project that from start to finish in just a few days was really freeing at the time.
What does a “happy ocean” mean to you?
An ocean that given the time and space to repair and balance itself. Something I really took away from David Attenborough’s Ocean is that ocean ecosystems are actually really good at repairing themselves if we just let them do their thing.
How can people get their hands on the t-shirt?
The shirt is a reward for regular givers to Greenpeace – those who commit to at least 3 months of donations will receive the tee as a gift. Read about how at http://act.gp/flp-tee
How is Greenpeace helping to make our oceans happier places?
They have a deep focus on the health and happiness of our oceans through advocating for the set up of marine sanctuaries, holding big ocean polluters to account and calling for a ban on deep sea mining.
What are you working on next?
I will be jumping headfirst into Peachtober – an annual daily art challenge I run each year in October, if there are any artists reading this it’s a great time so please come join! In terms of publications my next picture book The Late Bird will be out in February 2027 (published by Harper Collins US) and then I have an creative activity book for adults coming out next August with Chronicle US and Penguin Australia. Otherwise you can always check out what I’m tinkering away with in my studio on Instagram and YouTube.

Climate Change
AI giant Anthropic’s first Australian data centre deal an “egregious” example of Big Tech double talk
SYDNEY, Thursday 17 September 2026 — Greenpeace Australia Pacific has slammed AI giant Anthropic’s deal for its first Australian site in Queensland’s Western Downs, the heart of coal seam gas country, saying the project will entrench gas and turbocharge climate pollution.
The expected electricity demand from the data centre site, situated in the middle of the Western Downs coal seam gas fields, is comparable to 1.5 million Australian households. Greenpeace’s report Energy Vampires: The AI data centres draining Australia called for a moratorium on frenzied data centre development until appropriate guardrails are in place.
Joe Rafalowicz, Head of Climate and Energy at Greenpeace Australia Pacific, said: “This is an egregious example of Big Tech giants being given carte blanche to drain energy and water, and use polluting gas to fuel their hyperscale data centres.
“AI and Big Tech corporations claim to bring new renewable energy to the grid, while blatantly planning to power their operations with polluting fossil fuels.
“Planning documents show the first stage of this behemoth project could be powered by ‘behind the metre’ gas — the same playbook AI companies have used in the US, leading to a 20% increase in climate pollution from electricity. Now these companies want to bring their cowboy plans to Australia and the Federal Government is allowing it.
“If they plugged into the local grid, the power required would increase Queensland’s electricity grid emissions by around 6.6 million tonnes — an 18% rise. If they build their own gas-fired power plants, this will drive up Queensland’s emissions even more.
“Billions of dollars are now pouring into a massive pipeline of proposed new data centres, of unprecedented size, being built at incredible speed across the country. Australians should be worried about the extreme lack of scrutiny being applied to these projects, and the corporations leading the data centre charge.
“The data centre build-out is happening without the endorsement of the Australian people, yet we are the ones who will pay the price. We can not allow unchecked data centre expansion to derail our renewable energy transition, entrench gas and turbocharge climate pollution — that’s why Greenpeace has called for an urgent moratorium until appropriate guardrails are in place.”
ENDS
Media contact: Kate O’Callaghan on 0406 231 892 or kate.ocallaghan@greenpeace.org


-

 Greenhouse Gases2 years ago
嘉宾来稿:满足中国增长的用电需求 光伏加储能“比新建煤电更实惠”
-
Climate Change1 year ago
Guest post: Why China is still building new coal – and when it might stop
-
Greenhouse Gases1 year ago
Guest post: Why China is still building new coal – and when it might stop
-

 Climate Change2 years ago
嘉宾来稿:满足中国增长的用电需求 光伏加储能“比新建煤电更实惠”
-

 Renewable Energy11 months ago
Sending Progressive Philanthropist George Soros to Prison?
-
Climate Change2 years ago
Bill Discounting Climate Change in Florida’s Energy Policy Awaits DeSantis’ Approval
-
Greenhouse Gases1 year ago
嘉宾来稿:探究火山喷发如何影响气候预测
-

 Carbon Footprint2 years ago
US SEC’s Climate Disclosure Rules Spur Renewed Interest in Carbon Credits